

US States by Life Expectancy 2026: Latest Official CDC Ranking of All States
Latest CDC/NCHS State Life Tables: 2022 Data Snapshot
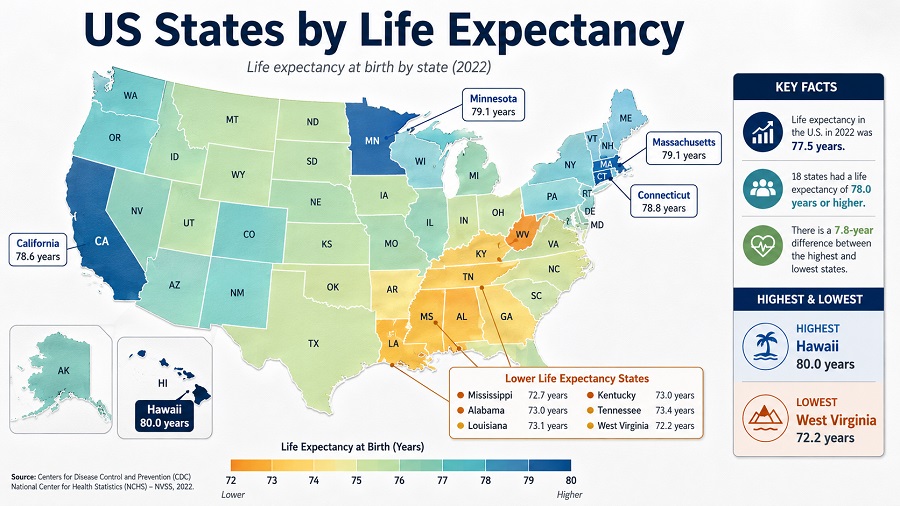
Hawaii tops all states at 80.0 years, while West Virginia ranks last at 72.2 years. The 7.8-year gap between the highest and lowest states points to major differences in population health, mortality risk and long-term social conditions across the United States.
This 2026 edition uses the latest complete official state-level life expectancy data from the CDC National Center for Health Statistics. The underlying dataset is the final 2022 U.S. State Life Tables, covering all 50 states and the District of Columbia.
Data year: 2022. Unit: years at birth. Coverage: 50 states plus the District of Columbia. Source: CDC/NCHS U.S. State Life Tables.
Which U.S. state has the highest and lowest life expectancy?
Hawaii has the highest life expectancy among U.S. states, at 80.0 years at birth. Massachusetts ranks second at 79.8 years, followed by New Jersey at 79.6 years.
West Virginia has the lowest life expectancy, at 72.2 years. Mississippi ranks next lowest at 72.6 years, followed by Kentucky at 73.6 years.
Hawaii leads all states
West Virginia ranks last
National life expectancy at birth in 2022
Gap between Hawaii and West Virginia
What this ranking shows
Life expectancy at birth shows the average number of years a newborn would be expected to live if the death rates observed in the data year remained constant throughout life. It is a period life-table measure, not a forecast for any individual person.
The top states concentrate in the Northeast and West. Hawaii, Massachusetts, New Jersey, New York and Connecticut lead the ranking, while California, Minnesota, Rhode Island, Utah and New Hampshire complete the top 10.
The bottom clusters in the South and Appalachia. West Virginia, Mississippi, Kentucky, Louisiana, Alabama, Tennessee, Oklahoma and Arkansas all fall below 74 years. This regional pattern points to overlapping differences in mortality, chronic disease burden, healthcare access, income, education, rural access and injury-related deaths.
Top 10 states by life expectancy
| Rank | State | Region | Years |
|---|---|---|---|
| 1 | Hawaii | West | 80.0 |
| 2 | Massachusetts | Northeast | 79.8 |
| 3 | New Jersey | Northeast | 79.6 |
| 4 | New York | Northeast | 79.5 |
| 5 | Connecticut | Northeast | 79.4 |
| 6 | California | West | 79.3 |
| 7 | Minnesota | Midwest | 79.3 |
| 8 | Rhode Island | Northeast | 79.2 |
| 9 | Utah | West | 79.0 |
| 10 | New Hampshire | Northeast | 78.7 |
Based on CDC/NCHS U.S. State Life Tables for 2022. Values are shown in years at birth. The full ranking includes all 50 states and the District of Columbia.
Top 20 states and D.C. by life expectancy
The top group is tightly packed between 77.8 and 80.0 years. Hawaii stands apart as the leader, while most of the top 20 cluster in the Northeast, West and upper Midwest.
Methodology
Life expectancy at birth shows the average number of years a newborn would be expected to live if the death rates observed in the data year remained constant throughout life. It is a period life-table measure, not an individual forecast.
State life tables are released after final death records and population estimates are processed, so state-level data normally lag behind national headline figures. The 2022 CDC/NCHS state life tables are the latest complete official dataset available for comparing all 50 states and the District of Columbia.
Rankings are based on CDC/NCHS unrounded estimates. Displayed values are rounded to one decimal place. Regions are broad geographic labels added for interpretation; they do not affect the ranking.
All states ranked by life expectancy
| Rank | State or D.C. | Region | Years |
|---|---|---|---|
| 1 | Hawaii | West | 80.0 |
| 2 | Massachusetts | Northeast | 79.8 |
| 3 | New Jersey | Northeast | 79.6 |
| 4 | New York | Northeast | 79.5 |
| 5 | Connecticut | Northeast | 79.4 |
| 6 | California | West | 79.3 |
| 7 | Minnesota | Midwest | 79.3 |
| 8 | Rhode Island | Northeast | 79.2 |
| 9 | Utah | West | 79.0 |
| 10 | New Hampshire | Northeast | 78.7 |
| 11 | Colorado | West | 78.5 |
| 12 | Idaho | West | 78.4 |
| 13 | Washington | West | 78.4 |
| 14 | Nebraska | Midwest | 78.3 |
| 15 | Vermont | Northeast | 78.3 |
| 16 | Wisconsin | Midwest | 78.1 |
| 17 | North Dakota | Midwest | 77.9 |
| 18 | Iowa | Midwest | 77.9 |
| 19 | Florida | South | 77.9 |
| 20 | Maryland | South | 77.8 |
| 21 | Oregon | West | 77.7 |
| 22 | Illinois | Midwest | 77.5 |
| 23 | Virginia | South | 77.5 |
| 24 | Pennsylvania | Northeast | 77.3 |
| 25 | South Dakota | Midwest | 77.3 |
| 26 | Montana | West | 77.3 |
| 27 | Texas | South | 77.1 |
| 28 | Wyoming | West | 76.8 |
| 29 | Michigan | Midwest | 76.8 |
| 30 | Arizona | West | 76.7 |
| 31 | Maine | Northeast | 76.6 |
| 32 | District of Columbia | South | 76.6 |
| 33 | Delaware | South | 76.5 |
| 34 | Kansas | Midwest | 76.5 |
| 35 | Nevada | West | 76.4 |
| 36 | Georgia | South | 75.9 |
| 37 | North Carolina | South | 75.9 |
| 38 | Alaska | West | 75.8 |
| 39 | Ohio | Midwest | 75.6 |
| 40 | Indiana | Midwest | 75.4 |
| 41 | Missouri | Midwest | 75.2 |
| 42 | South Carolina | South | 75.1 |
| 43 | New Mexico | West | 74.5 |
| 44 | Arkansas | South | 73.9 |
| 45 | Oklahoma | South | 73.8 |
| 46 | Tennessee | South | 73.8 |
| 47 | Alabama | South | 73.8 |
| 48 | Louisiana | South | 73.8 |
| 49 | Kentucky | South | 73.6 |
| 50 | Mississippi | South | 72.6 |
| 51 | West Virginia | South | 72.2 |
The table includes 50 states plus the District of Columbia. All figures are life expectancy at birth in years. Data source: CDC/NCHS U.S. State Life Tables for 2022. Rankings are based on unrounded CDC/NCHS estimates.
Key findings
High-ranking states are not all alike
The leading states include a Pacific island state, large coastal economies, compact Northeastern states and upper Midwestern states. This mix suggests that high life expectancy can emerge from different combinations of mortality patterns, health systems, demographics and socioeconomic conditions.
The bottom is regionally concentrated
West Virginia, Mississippi, Kentucky and Louisiana appear at the lower end of the ranking. The broader lower group is concentrated in the South and Appalachia, where multiple health and social risk factors often overlap.
The middle of the ranking is tightly packed. A difference of a few tenths of a year can shift a state by several places. The clearest signal is the 7.8-year gap between the top and bottom states and the regional concentration of lower life expectancy.
What this means for readers
Life expectancy is not destiny. People in lower-ranking states can live long lives, and people in higher-ranking states still face serious health risks. The ranking is best understood as a population-level signal of the environment in which people are born, age, work, access care and face preventable risks.
For families, the ranking helps frame questions about healthcare access, prevention and aging. For policymakers, it highlights where mortality reduction may have the largest payoff. For researchers and journalists, it is a starting point for deeper analysis by cause of death, county, income, race, ethnicity and rural-urban location.
Frequently asked questions
Which U.S. state has the highest life expectancy?
Hawaii has the highest life expectancy among U.S. states, at 80.0 years at birth in the latest complete CDC/NCHS state life tables.
Which U.S. state has the lowest life expectancy?
West Virginia has the lowest life expectancy, at 72.2 years at birth. Mississippi ranks next lowest at 72.6 years, followed by Kentucky at 73.6 years.
Why does Hawaii rank first?
Hawaii ranks first because its observed mortality rates in the CDC/NCHS state life table produce the highest life expectancy at birth among states. The ranking should be interpreted together with broader health, demographic, behavioral and socioeconomic indicators rather than explained by one single factor.
Why do several Southern states rank lower?
Several Southern and Appalachian states appear near the bottom because their observed mortality profiles produce lower life expectancy at birth. Interpreting the reasons requires additional indicators, including cause-of-death patterns, chronic disease rates, healthcare access, income, education and rural-urban conditions.
Is 2022 data outdated?
State life tables are released after final death records and population estimates are processed, so state-level data normally lag behind national headline figures. The 2022 CDC/NCHS state life tables are the latest complete official dataset available for comparing all 50 states and the District of Columbia.
What should not be assumed from this ranking?
The ranking should not be read as a prediction for individuals. Life expectancy is an average population measure. A complete interpretation should also consider age structure, cause-of-death patterns, healthcare coverage, income, education, race, ethnicity and geography.
Sources
-
CDC/NCHS — U.S. State Life Tables, 2022
Official state-level life expectancy at birth for total, male and female populations.
https://www.cdc.gov/nchs/data/nvsr/nvsr74/nvsr74-12.pdf -
CDC/NCHS — State Life Expectancy Map and Data
Interactive state map and data explorer for 2022 state life expectancy.
https://www.cdc.gov/nchs/data-visualization/state-life-expectancy/index_2022.htm -
CDC/NCHS — Life Expectancy Overview
Definitions and explanation of period life tables and life expectancy methodology.
https://www.cdc.gov/nchs/nvss/life-expectancy.htm
StatRanker (Website)
administrator
