

Top 100 Semiconductor Companies by Revenue, 2026
Semiconductor Revenue Leaders: 2026 Public Company Snapshot
Updated: April 26, 2026
This snapshot compares large publicly traded semiconductor-category companies by revenue using the latest available trailing-twelve-month and full-year reporting available for a 2026 view. Revenue is shown in U.S. dollars and rounded to billions, so a value of $37.67B means approximately 37.67 billion dollars of annual revenue.
Revenue matters because semiconductors sit behind AI servers, smartphones, automotive electronics, industrial automation, cloud infrastructure, memory systems and chipmaking equipment. It is not the same as market capitalization, valuation or profit: a company can be very large by sales because it ships memory, operates foundries or sells equipment, while another can have a higher stock-market value because investors expect faster future growth.
Continue exploring
More StatRanker rankings on public finance, tax burden, debt and government spending.
Several industry shifts sit behind the 2026 numbers: AI accelerator demand, high-bandwidth memory and renewed spending on advanced manufacturing equipment. This table compares public semiconductor-category companies by company-level revenue where available. It is not the same as a pure semiconductor vendor revenue list. In vendor-only semiconductor revenue lists, companies with broader consolidated revenue, especially Samsung, may appear differently.
Samsung appears first by consolidated public-company revenue in this semiconductor-category snapshot, but its pure semiconductor vendor revenue is materially lower than total group revenue.
The upper tier is extremely concentrated, with Samsung, NVIDIA, TSMC, SK Hynix, Broadcom, Micron and Intel accounting for most of the top-ten total.
The table mixes fabless chip designers, foundries, memory suppliers, IDMs, packaging firms, equipment makers and EDA/IP suppliers.
Samsung, Coherent, Lite-On and several materials or equipment suppliers are not directly comparable to pure-play semiconductor vendors on a one-to-one segment basis.
What stands out in the 2026 semiconductor revenue picture
The upper end of the list shows how broad the semiconductor economy has become. NVIDIA’s AI accelerator growth puts a fabless company near the highest-revenue group even though it does not own leading-edge fabs. TSMC remains central because the global fabless model depends on foundry capacity. Samsung and SK Hynix show the scale of the memory cycle, while Broadcom benefits from networking, custom silicon and infrastructure chips.
Equipment companies such as ASML, Applied Materials, Lam Research, KLA and Tokyo Electron are not chip sellers in the same way as NVIDIA or Qualcomm, but they are included because their revenue is directly tied to semiconductor manufacturing. Without lithography, deposition, etch, inspection, test and metrology suppliers, the modern chip supply chain cannot scale.
Regionally, the United States is strongest in fabless design, Taiwan is central to foundry and packaging capacity, South Korea is central to memory, Japan and Europe are strong in equipment and materials, and China is increasingly visible in mature-node foundry, equipment, sensors and domestic chip design.
Leading 10 semiconductor-category companies by revenue
Appears first by consolidated revenue in this semiconductor-category public-company list; semiconductor-only revenue is lower and depends heavily on memory pricing.
AI accelerators, GPUs, networking and data-center platforms make NVIDIA one of the central growth companies of the current semiconductor cycle.
TSMC is the core manufacturing partner for leading fabless chip designers and the clearest measure of advanced foundry demand.
HBM demand for AI servers has lifted SK Hynix into the top tier of the revenue table.
Broadcom combines networking chips, custom accelerators, connectivity and infrastructure exposure.
Micron reflects the rebound in DRAM, NAND and high-bandwidth memory demand.
Intel remains a large semiconductor revenue company even as it restructures around products, manufacturing and foundry ambitions.
Qualcomm’s scale comes from mobile platforms, licensing economics, RF and expansion into automotive and edge AI chips.
ASML does not manufacture chips, but its lithography systems are essential for advanced semiconductor production.
AMD’s data-center CPUs, GPUs and embedded products place it among the largest fabless semiconductor companies.
Short table: leading 20 by revenue
| Position | Company | Revenue | Main segment |
|---|---|---|---|
| 1 | Samsung | $235.65B | Memory / IDM |
| 2 | NVIDIA | $215.93B | Fabless AI / GPU |
| 3 | TSMC | $121.91B | Foundry |
| 4 | SK Hynix | $68.72B | Memory |
| 5 | Broadcom | $68.28B | Fabless / custom silicon |
| 6 | Micron Technology | $58.11B | Memory |
| 7 | Intel | $52.85B | IDM / foundry |
| 8 | QUALCOMM | $44.86B | Fabless |
| 9 | ASML | $37.67B | Equipment |
| 10 | AMD | $34.63B | Fabless CPU / GPU |
| 11 | Applied Materials | $28.21B | Equipment |
| 12 | ASE Group | $20.85B | Packaging / OSAT |
| 13 | Lam Research | $20.56B | Equipment |
| 14 | MediaTek | $19.23B | Fabless |
| 15 | Texas Instruments | $17.68B | Analog / embedded |
| 16 | Infineon | $17.18B | Power / automotive |
| 17 | KLA | $12.74B | Equipment |
| 18 | Tokyo Electron | $12.47B | Equipment |
| 19 | NXP Semiconductors | $12.26B | Automotive / embedded |
| 20 | STMicroelectronics | $11.80B | Analog / embedded |
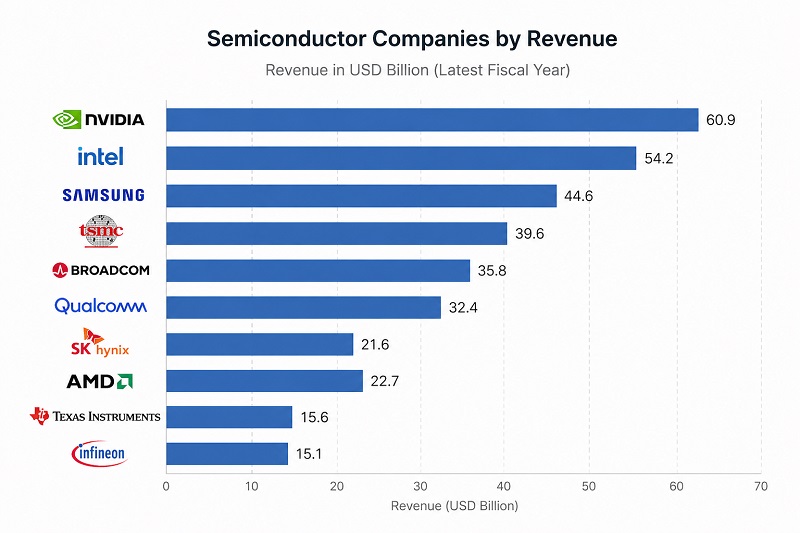
Chart 1. Leading 20 semiconductor companies by revenue
Fallback view: The five largest revenue values are Samsung $235.65B, NVIDIA $215.93B, TSMC $121.91B, SK Hynix $68.72B and Broadcom $68.28B.
The bar chart shows the scale difference between the largest semiconductor-category companies and the rest of the leading 20.
Chart 2. Revenue concentration by business model
Fallback view: The largest revenue blocks are memory/IDM, fabless AI and GPU, foundry, and semiconductor equipment.
This view groups the selected companies into broad business models. Several companies operate across more than one category, so the segments are simplified for comparison.
Methodology
The main metric is annual revenue in U.S. dollars, rounded to two decimal places in billions. The table uses a 2026 snapshot: the latest trailing-twelve-month or latest full-year revenue available from public-company financial data and company reporting. Because semiconductor companies have different fiscal calendars, the table is not a single calendar-year income statement for every company.
This page uses a broad semiconductor-company definition: chip designers, foundries, integrated device manufacturers, memory producers, packaging and test companies, equipment suppliers, semiconductor materials suppliers and EDA/IP businesses can all appear when their business is structurally tied to chip production or design. This is why ASML, Applied Materials, Lam Research, KLA, Tokyo Electron, Synopsys and Arm are included even though they do not sell chips in the same way as NVIDIA, Qualcomm or MediaTek.
- Company-level vs segment revenue: where a company is a pure-play semiconductor business, company revenue is a reasonable proxy. Where a company is a conglomerate, consolidated revenue can overstate semiconductor-only sales. Samsung is the most important example.
- Currency conversion: values are displayed in USD. Non-U.S. company revenue is converted in the source datasets or through reported USD-equivalent figures.
- Rounding: values are rounded to billions for readability. Small differences may change the order when companies are close together.
- Market coverage: private companies and subsidiaries with limited disclosure may be missing even when they are important in the supply chain.
- What the table is not: it is not a ranking of profit, market value, stock performance, wafer capacity, node leadership or national technology independence.
A company can appear high in the table because of scale, memory pricing, foundry utilization, AI accelerator demand, custom silicon, semiconductor equipment cycles or broad electronics exposure. Revenue becomes more useful when it is read together with margins, capex, product mix and customer concentration.
Main revenue table: 100 semiconductor-category public companies
The default view shows the leading 20 when JavaScript is available, while all 100 rows are embedded directly in the HTML. Search, filters and sorting only reorganize existing rows.
| Position | Company | Revenue | Segment |
|---|---|---|---|
| 1 | Samsung | $235.65B | Memory / IDM |
| 2 | NVIDIA | $215.93B | Fabless AI / GPU |
| 3 | TSMC | $121.91B | Foundry |
| 4 | SK Hynix | $68.72B | Memory |
| 5 | Broadcom | $68.28B | Fabless / custom silicon |
| 6 | Micron Technology | $58.11B | Memory |
| 7 | Intel | $52.85B | IDM / foundry |
| 8 | QUALCOMM | $44.86B | Fabless |
| 9 | ASML | $37.67B | Equipment |
| 10 | AMD | $34.63B | Fabless CPU / GPU |
| 11 | Applied Materials | $28.21B | Equipment |
| 12 | ASE Group | $20.85B | Packaging / OSAT |
| 13 | Lam Research | $20.56B | Equipment |
| 14 | MediaTek | $19.23B | Fabless |
| 15 | Texas Instruments | $17.68B | Analog / embedded |
| 16 | Infineon | $17.18B | Power / automotive |
| 17 | KLA | $12.74B | Equipment |
| 18 | Tokyo Electron | $12.47B | Equipment |
| 19 | NXP Semiconductors | $12.26B | Automotive / embedded |
| 20 | STMicroelectronics | $11.80B | Analog / embedded |
| 21 | Analog Devices | $11.75B | Analog |
| 22 | Renesas Electronics | $9.65B | Automotive / embedded |
| 23 | Marvell Technology | $8.19B | Fabless / data infrastructure |
| 24 | SMIC | $8.02B | Foundry |
| 25 | Synopsys | $8.00B | EDA / IP |
| 26 | United Microelectronics | $7.67B | Foundry |
| 27 | GlobalFoundries | $6.79B | Foundry |
| 28 | Amkor Technology | $6.70B | Packaging / OSAT |
| 29 | Coherent Corp. | $6.29B | Materials / photonics |
| 30 | ON Semiconductor | $5.99B | Power / automotive |
| 31 | Lite-On Technology | $5.06B | Optoelectronics |
| 32 | Qnity Electronics | $4.75B | Materials / components |
| 33 | NAURA Technology Group | $4.68B | Equipment |
| 34 | Arm Holdings | $4.67B | IP / design |
| 35 | Microchip Technology | $4.37B | Embedded / analog |
| 36 | Skyworks Solutions | $4.05B | RF / connectivity |
| 37 | Realtek | $3.95B | Fabless / connectivity |
| 38 | Qorvo | $3.73B | RF / connectivity |
| 39 | ASM International | $3.55B | Equipment |
| 40 | SCREEN Holdings | $3.43B | Equipment |
| 41 | Advantest | $3.32B | Test equipment |
| 42 | Novatek Microelectronics | $3.21B | Fabless display IC |
| 43 | Rohm | $3.19B | Power / analog |
| 44 | Entegris | $3.19B | Materials / equipment |
| 45 | Vishay Intertechnology | $3.06B | Discrete / passive |
| 46 | Monolithic Power Systems | $2.79B | Power management |
| 47 | Sumco Corporation | $2.68B | Silicon wafers |
| 48 | Sino-American Silicon Products | $2.52B | Silicon wafers |
| 49 | San’an Optoelectronics | $2.42B | LED / compound semis |
| 50 | Hua Hong Semiconductor | $2.28B | Foundry |
| 51 | Disco Corp. | $2.09B | Equipment |
| 52 | UCT (Ultra Clean Holdings) | $2.05B | Equipment subsystems |
| 53 | GlobalWafers | $1.98B | Silicon wafers |
| 54 | Cirrus Logic | $1.97B | Fabless mixed-signal |
| 55 | AT&S Austria Technologie & Systemtechnik | $1.85B | IC substrates |
| 56 | ASMPT | $1.74B | Packaging equipment |
| 57 | Nanya Technology | $1.74B | Memory |
| 58 | Silan Microelectronics | $1.70B | IDM / discrete |
| 59 | Siltronic | $1.53B | Silicon wafers |
| 60 | Vanguard International Semiconductor | $1.51B | Foundry |
| 61 | Tower Semiconductor | $1.51B | Foundry |
| 62 | Socionext | $1.51B | Fabless ASIC |
| 63 | Powerchip Semiconductor Manufacturing | $1.50B | Foundry / memory |
| 64 | China Resources Microelectronics | $1.47B | IDM / power |
| 65 | AMEC | $1.46B | Equipment |
| 66 | Lasertec | $1.41B | Mask inspection |
| 67 | Kokusai Electric | $1.23B | Equipment |
| 68 | GigaDevice Semiconductor | $1.10B | Memory / MCU |
| 69 | Credo Technology | $1.06B | Connectivity ASIC |
| 70 | Semtech | $1.02B | Analog / connectivity |
| 71 | MACOM Technology Solutions | $1.02B | RF / analog |
| 72 | SmartSens Technology | $1.01B | Image sensors |
| 73 | GalaxyCore | $1.00B | Image sensors |
| 74 | Onto Innovation | $1.00B | Metrology equipment |
| 75 | Global Unichip Corp. | $1.00B | ASIC design |
| 76 | Alchip Technologies | $0.99B | ASIC design |
| 77 | Soitec | $0.96B | Engineered wafers |
| 78 | Ichor Systems | $0.95B | Equipment subsystems |
| 79 | ChipMOS Technologies | $0.95B | Packaging / testing |
| 80 | Melexis NV | $0.92B | Automotive sensors |
| 81 | ACM Research | $0.90B | Equipment |
| 82 | Nova Ltd. | $0.88B | Metrology equipment |
| 83 | Himax Technologies | $0.86B | Display IC |
| 84 | Photronics | $0.86B | Photomasks |
| 85 | Astera Labs | $0.85B | Connectivity chips |
| 86 | Allegro MicroSystems | $0.83B | Sensors / power |
| 87 | Axcelis Technologies | $0.83B | Ion implant equipment |
| 88 | Tekscend Photomask | $0.81B | Photomasks |
| 89 | X-FAB | $0.81B | Foundry |
| 90 | Cambricon Technologies | $0.80B | AI accelerators |
| 91 | Silicon Motion | $0.79B | Storage controllers |
| 92 | FormFactor | $0.78B | Probe cards / test |
| 93 | Silicon Labs | $0.78B | IoT chips |
| 94 | Rorze Corporation | $0.74B | Automation equipment |
| 95 | Wolfspeed | $0.74B | SiC / power |
| 96 | Aixtron | $0.73B | Deposition equipment |
| 97 | Kulicke and Soffa Industries | $0.68B | Packaging equipment |
| 98 | Alpha & Omega Semiconductor | $0.68B | Power semiconductors |
| 99 | BE Semiconductor | $0.68B | Packaging equipment |
| 100 | Veeco | $0.66B | Deposition equipment |
Figures use the latest available public-company TTM or annual revenue for semiconductor-category companies, rounded to billions of U.S. dollars. The share toggle uses the listed-company total calculated from the embedded rows. The snapshot reflects public market and company-reporting data available in April 2026.
Insights from the revenue table
The upper tier is defined by scale and strategic bottlenecks. Samsung, NVIDIA and TSMC represent three different forms of scale: conglomerate memory and device revenue, fabless AI platform leadership, and advanced foundry capacity. SK Hynix and Micron show how memory can rapidly move up the table when HBM and DRAM prices rise.
The middle of the table is more industrial. Analog, automotive, embedded, RF, packaging and equipment suppliers may not dominate headlines, but they are essential for vehicles, factories, power systems, data centers and defense electronics. Companies such as Texas Instruments, Infineon, NXP, STMicroelectronics, Analog Devices, Renesas and ON Semiconductor reflect demand outside the pure AI server cycle.
The lower half of the list shows the specialist layer of the industry: photomasks, wafers, probe cards, ion implantation, deposition, ASIC design, image sensors and compound semiconductors. These businesses are smaller by revenue, but many are structurally important because a shortage in a narrow part of the supply chain can slow much larger chip programs.
Regional specialization is clear. The United States is strongest in design, EDA, analog and equipment. Taiwan anchors foundry, packaging and ASIC design. South Korea is central to memory. Japan remains deep in equipment, wafers and materials. Europe is prominent in lithography, power semiconductors, automotive chips and engineered substrates. China is expanding across foundry, equipment, sensors and domestic chip design, especially at mature nodes.
What this means for readers
For readers tracking AI, semiconductors are the physical layer of the digital economy. Revenue tables show which companies capture the most money from chip demand, but they do not automatically identify the most profitable, most innovative or most investable businesses.
The table is useful for understanding supply-chain concentration. A small group of companies accounts for a large share of AI accelerators, memory, leading-edge foundry capacity and critical production tools. That concentration affects data-center buildouts, national industrial policy, export controls, automotive supply resilience and the cost of advanced electronics.
The table works best as a comparison of industry structure, not as a forecast. High revenue can signal durable scale, but it can also reflect cyclical memory pricing, equipment order timing, or broad consolidated revenue outside a pure semiconductor segment.
FAQ
What does semiconductor revenue include?
It can include chip sales, foundry services, memory, analog chips, AI accelerators, equipment, packaging, materials and EDA/IP revenue depending on the company. For pure-play chip companies, the figure is closer to semiconductor sales. For conglomerates, it may include broader revenue unless segment disclosure is separated.
Why can a fabless company appear above manufacturers?
Fabless companies such as NVIDIA, Qualcomm, AMD, Broadcom and MediaTek design chips but outsource manufacturing. They can appear very high because they capture large product revenue even though foundries such as TSMC manufacture the wafers.
Is ASML a semiconductor company if it does not make chips?
ASML is a semiconductor equipment company. It does not sell chips, but its lithography systems are essential for advanced chip manufacturing. Including equipment companies gives readers a broader view of the semiconductor value chain.
Why is Samsung hard to compare with NVIDIA or TSMC?
Samsung is a large conglomerate with memory, foundry, consumer electronics and other operations. Its consolidated revenue is much larger than its semiconductor-only vendor revenue. That is why this article flags Samsung as a key comparability limitation.
Why is revenue different from market capitalization?
Revenue measures annual sales. Market capitalization measures the stock market’s valuation of a company. A company with lower revenue can have a higher valuation if investors expect faster growth, stronger margins or more strategic control over future markets.
Why does the table change during AI and memory cycles?
AI demand raises revenue for accelerators, networking chips and HBM memory. Memory prices can also swing sharply from one cycle to another. These shifts can move NVIDIA, SK Hynix, Micron, Samsung and Broadcom faster than companies tied to slower industrial or automotive markets.
Does higher revenue mean better technology leadership?
No. Revenue shows scale, not necessarily the best process node, margins, software ecosystem, patent position or stock performance. A niche equipment or materials company can be technologically critical even if its revenue is far below the largest chip vendors.
Sources
- SEC EDGAR company filingsOfficial filings for U.S.-listed companies such as NVIDIA, Intel, Qualcomm, Broadcom, AMD, Micron, Texas Instruments, Applied Materials, Lam Research and KLA. https://www.sec.gov/edgar/search/
- TSMC investor relationsFoundry revenue context and annual reporting for TSMC. https://investor.tsmc.com/english/annual-reports
- Samsung Electronics investor relationsSamsung consolidated revenue and semiconductor-segment reporting context. https://www.samsung.com/global/ir/reports-disclosures/annual-reports/
- ASML annual reportsSemiconductor equipment revenue context and lithography supply-chain background. https://www.asml.com/en/investors/annual-report
- Gartner — Worldwide semiconductor revenue, 2025 preliminary dataPure semiconductor vendor context for the leading companies, including AI, HBM and memory-cycle effects. https://www.gartner.com/en/newsroom/press-releases/2026-01-12-gartner-says-worldwide-semiconductor-revenue-grew-21-percent-in-2025
- Semiconductor Industry Association — global semiconductor sales in 2025Market-size context, WSTS-based annual sales and 2026 industry outlook. https://www.semiconductors.org/global-annual-semiconductor-sales-increase-25-6-to-791-7-billion-in-2025/
- CompaniesMarketCap — semiconductor companies by revenuePublic aggregator for broad TTM revenue comparison and table cross-checking. https://companiesmarketcap.com/semiconductors/largest-semiconductor-companies-by-revenue/
Related rankings
More StatRanker rankings on public finance, tax burden, debt and government spending.
Top 100 Defense Companies by Revenue, 2026 Snapshot
Open rankingTop 100 Pharma Companies by Revenue in 2026
Open rankingTop 30 Companies by Revenue, 2026
Open rankingTop 1000 Global Companies by Revenue (Sales), Latest FY
Open rankingStatRanker (Website)
administrator
