

Top 100 Cities by PM2.5 Air Pollution, 2026
Where annual PM2.5 exposure is highest in the 2025 city dataset
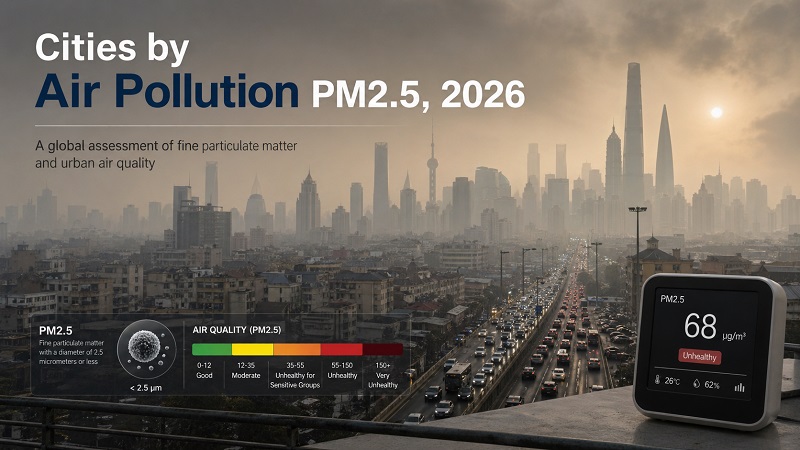
Annual PM2.5 is one of the clearest indicators of long-term urban air-pollution exposure. It measures fine particulate matter with an aerodynamic diameter of 2.5 micrometers or smaller, reported in micrograms per cubic meter. Unlike a short AQI spike, the annual average shows the background pollution burden residents live with across the year.
What the top of the PM2.5 ranking shows
The upper part of the 2025 city dataset is highly concentrated in South Asia and parts of western China. Loni, Hotan, Byrnihat, Delhi and Faisalabad lead the list, and the full Top 25 is dominated by cities in India, Pakistan and China. This pattern points to regional pollution systems rather than isolated local failures. Transport emissions, industrial activity, coal and power generation, construction dust, winter temperature inversions, biomass burning and desert dust can all contribute to elevated annual PM2.5.
A high annual PM2.5 rank does not mean the city has the worst air every hour of the year. It means the average measured concentration across the year was among the highest in the dataset. Seasonal smog episodes, wildfire smoke, dust events and winter inversions can heavily influence the annual mean, while cleaner days can still occur in highly ranked cities.
There is no single official worldwide city ranking that covers every city with identical monitoring density, boundaries and methods. This ranking uses a comparable annual PM2.5 city dataset, while WHO guidelines and official monitoring networks provide the health and methodological reference.
Top 10 cities by annual PM2.5 concentration
The leading cities are clustered around the Indo-Gangetic Plain, Pakistan’s Punjab and Sindh regions, and arid western China. Common contributors across these regions include dense transport corridors, industrial belts, dust, household and commercial fuel use, crop-residue burning, power generation and meteorological trapping during winter months.
Measured annual exposure was more than 22 times the WHO annual guideline. Regional drivers commonly include traffic, industry, construction dust and winter smog conditions.
Hotan has a long history of high annual PM2.5 readings, with desert dust and regional meteorology contributing to persistent particulate exposure.
The city appears near the top because its annual mean remained extremely high across the year, not only during isolated pollution episodes.
Delhi’s PM2.5 burden reflects a large urban airshed shaped by transport, industry, construction, waste burning, winter inversions and regional agricultural burning.
Faisalabad’s high annual concentration fits a broader Punjab pollution pattern involving industry, transport, fuel use and seasonal atmospheric stagnation.
The city’s ranking reflects sustained annual exposure, with regional dust, combustion sources and weather patterns likely influencing measured concentrations.
Ghaziabad sits within the wider Delhi-NCR pollution system, where local emissions and regional air movement both matter for annual PM2.5.
Lahore’s annual mean reflects intense winter smog episodes combined with year-round urban and regional emissions.
Sukkur’s place in the Top 10 shows that high PM2.5 exposure is not limited to the largest metropolitan areas.
Even the tenth-ranked city remains far above the WHO health guideline, underlining the scale of structural particulate exposure in the most affected urban areas.
Full Top 100 cities by annual PM2.5 concentration
The table lists the 100 cities with the highest annual PM2.5 concentrations in the 2025 dataset. Use the controls to search by city, filter by region, compare the highest-ranked cities, or switch from concentration to the WHO-guideline multiple.
Showing the 20 highest-ranked cities by default.
| Rank | City | Country / Region | PM2.5 |
|---|---|---|---|
| 1 | Loni | India · Asia | 112.5 µg/m³22.5× WHO guideline |
| 2 | Hotan | China · Asia | 109.6 µg/m³21.9× WHO guideline |
| 3 | Byrnihat | India · Asia | 101.1 µg/m³20.2× WHO guideline |
| 4 | Delhi | India · Asia | 99.6 µg/m³19.9× WHO guideline |
| 5 | Faisalabad | Pakistan · Asia | 98.8 µg/m³19.8× WHO guideline |
| 6 | Rahim Yar Khan | Pakistan · Asia | 92.6 µg/m³18.5× WHO guideline |
| 7 | Ghaziabad | India · Asia | 89.2 µg/m³17.8× WHO guideline |
| 8 | Lahore | Pakistan · Asia | 88.9 µg/m³17.8× WHO guideline |
| 9 | Sukkur | Pakistan · Asia | 88.6 µg/m³17.7× WHO guideline |
| 10 | Ula | India · Asia | 86.8 µg/m³17.4× WHO guideline |
| 11 | Pattoki | Pakistan · Asia | 86.7 µg/m³17.3× WHO guideline |
| 12 | Mullanpur Dhaka | India · Asia | 86.2 µg/m³17.2× WHO guideline |
| 13 | Lodhran | Pakistan · Asia | 85.3 µg/m³17.1× WHO guideline |
| 14 | Kashgar | China · Asia | 84.0 µg/m³16.8× WHO guideline |
| 15 | Madhyamgram | India · Asia | 83.3 µg/m³16.7× WHO guideline |
| 16 | New Delhi | India · Asia | 82.2 µg/m³16.4× WHO guideline |
| 17 | Peshawar | Pakistan · Asia | 81.7 µg/m³16.3× WHO guideline |
| 18 | Noida | India · Asia | 80.5 µg/m³16.1× WHO guideline |
| 19 | Kizilsu | China · Asia | 79.7 µg/m³15.9× WHO guideline |
| 20 | Sialkot | Pakistan · Asia | 78.6 µg/m³15.7× WHO guideline |
| 21 | Greater Noida | India · Asia | 77.2 µg/m³15.4× WHO guideline |
| 22 | Aksu | China · Asia | 74.9 µg/m³15.0× WHO guideline |
| 23 | Gurugram | India · Asia | 74.6 µg/m³14.9× WHO guideline |
| 24 | Mandi Bahauddin | Pakistan · Asia | 74.4 µg/m³14.9× WHO guideline |
| 25 | Bhiwadi | India · Asia | 74.1 µg/m³14.8× WHO guideline |
| 26 | Karaganda | Kazakhstan · Asia | 72.6 µg/m³14.5× WHO guideline |
| 27 | Hajipur | India · Asia | 71.5 µg/m³14.3× WHO guideline |
| 28 | Multan | Pakistan · Asia | 71.1 µg/m³14.2× WHO guideline |
| 29 | Muzaffarnagar | India · Asia | 69.1 µg/m³13.8× WHO guideline |
| 30 | Fergana | Uzbekistan · Asia | 68.8 µg/m³13.8× WHO guideline |
| 31 | Talcher | India · Asia | 68.1 µg/m³13.6× WHO guideline |
| 32 | Dhaka | Bangladesh · Asia | 68.0 µg/m³13.6× WHO guideline |
| 33 | Bahawalpur | Pakistan · Asia | 67.7 µg/m³13.5× WHO guideline |
| 34 | Hapur | India · Asia | 67.6 µg/m³13.5× WHO guideline |
| 35 | Baghpat | India · Asia | 65.8 µg/m³13.2× WHO guideline |
| 36 | Bulandshahr | India · Asia | 64.5 µg/m³12.9× WHO guideline |
| 37 | Igdir | Turkey · MENA | 64.4 µg/m³12.9× WHO guideline |
| 38 | Jhang | Pakistan · Asia | 63.6 µg/m³12.7× WHO guideline |
| 39 | Mandideep | India · Asia | 63.0 µg/m³12.6× WHO guideline |
| 40 | Singrauli | India · Asia | 62.9 µg/m³12.6× WHO guideline |
| 41 | Barrackpore | India · Asia | 62.6 µg/m³12.5× WHO guideline |
| 42 | Meerut | India · Asia | 61.8 µg/m³12.4× WHO guideline |
| 43 | Gummidipoondi | India · Asia | 61.5 µg/m³12.3× WHO guideline |
| 44 | Mandi Gobindgarh | India · Asia | 60.0 µg/m³12.0× WHO guideline |
| 45 | Baddi | India · Asia | 59.6 µg/m³11.9× WHO guideline |
| 46 | Baruipur | India · Asia | 59.0 µg/m³11.8× WHO guideline |
| 47 | Angul | India · Asia | 58.5 µg/m³11.7× WHO guideline |
| 48 | Bihar Sharif | India · Asia | 57.7 µg/m³11.5× WHO guideline |
| 49 | Pali | India · Asia | 57.7 µg/m³11.5× WHO guideline |
| 50 | Mirpur Khas | Pakistan · Asia | 57.7 µg/m³11.5× WHO guideline |
| 51 | Dushanbe | Tajikistan · Asia | 57.3 µg/m³11.5× WHO guideline |
| 52 | Thai Nguyen | Vietnam · Asia | 56.4 µg/m³11.3× WHO guideline |
| 53 | Howrah | India · Asia | 55.1 µg/m³11.0× WHO guideline |
| 54 | Patna | India · Asia | 54.8 µg/m³11.0× WHO guideline |
| 55 | Pithampur | India · Asia | 54.6 µg/m³10.9× WHO guideline |
| 56 | Sri Ganganagar | India · Asia | 54.4 µg/m³10.9× WHO guideline |
| 57 | Chandigarh | India · Asia | 54.3 µg/m³10.9× WHO guideline |
| 58 | Lucknow | India · Asia | 54.2 µg/m³10.8× WHO guideline |
| 59 | Bali | India · Asia | 53.9 µg/m³10.8× WHO guideline |
| 60 | Araria | India · Asia | 53.8 µg/m³10.8× WHO guideline |
| 61 | N'Djamena | Chad · Africa | 53.6 µg/m³10.7× WHO guideline |
| 62 | Durgapur | India · Asia | 53.6 µg/m³10.7× WHO guideline |
| 63 | Kishanganj | India · Asia | 53.5 µg/m³10.7× WHO guideline |
| 64 | Rourkela | India · Asia | 53.1 µg/m³10.6× WHO guideline |
| 65 | Aurangabad | India · Asia | 53.0 µg/m³10.6× WHO guideline |
| 66 | Ludhiana | India · Asia | 52.8 µg/m³10.6× WHO guideline |
| 67 | Khurja | India · Asia | 52.8 µg/m³10.6× WHO guideline |
| 68 | Khulna | Bangladesh · Asia | 52.7 µg/m³10.5× WHO guideline |
| 69 | Asansol | India · Asia | 52.2 µg/m³10.4× WHO guideline |
| 70 | Wujiaqu | China · Asia | 52.0 µg/m³10.4× WHO guideline |
| 71 | Visakhapatnam | India · Asia | 51.8 µg/m³10.4× WHO guideline |
| 72 | Haora | India · Asia | 51.5 µg/m³10.3× WHO guideline |
| 73 | South Tangerang | Indonesia · Asia | 51.5 µg/m³10.3× WHO guideline |
| 74 | Buca | Turkey · MENA | 51.5 µg/m³10.3× WHO guideline |
| 75 | Nalbari | India · Asia | 51.4 µg/m³10.3× WHO guideline |
| 76 | Manesar | India · Asia | 51.1 µg/m³10.2× WHO guideline |
| 77 | Kolkata | India · Asia | 51.0 µg/m³10.2× WHO guideline |
| 78 | Jaipur | India · Asia | 50.7 µg/m³10.1× WHO guideline |
| 79 | Gwalior | India · Asia | 50.5 µg/m³10.1× WHO guideline |
| 80 | Kinshasa | Democratic Republic of the Congo · Africa | 50.2 µg/m³10.0× WHO guideline |
| 81 | Rajgir | India · Asia | 50.2 µg/m³10.0× WHO guideline |
| 82 | Sasaram | India · Asia | 50.2 µg/m³10.0× WHO guideline |
| 83 | Balasore | India · Asia | 49.9 µg/m³10.0× WHO guideline |
| 84 | Hanumangarh | India · Asia | 49.6 µg/m³9.9× WHO guideline |
| 85 | Tonk | India · Asia | 49.6 µg/m³9.9× WHO guideline |
| 86 | Rawalpindi | Pakistan · Asia | 49.1 µg/m³9.8× WHO guideline |
| 87 | Bac Ninh | Vietnam · Asia | 48.7 µg/m³9.7× WHO guideline |
| 88 | Vapi | India · Asia | 48.6 µg/m³9.7× WHO guideline |
| 89 | Srinagar | India · Asia | 48.4 µg/m³9.7× WHO guideline |
| 90 | Chittoor | India · Asia | 48.3 µg/m³9.7× WHO guideline |
| 91 | Begusarai | India · Asia | 48.3 µg/m³9.7× WHO guideline |
| 92 | Islamabad | Pakistan · Asia | 48.1 µg/m³9.6× WHO guideline |
| 93 | Barbil | India · Asia | 48.0 µg/m³9.6× WHO guideline |
| 94 | Dholpur | India · Asia | 48.0 µg/m³9.6× WHO guideline |
| 95 | Sikar | India · Asia | 47.9 µg/m³9.6× WHO guideline |
| 96 | Kota | India · Asia | 47.6 µg/m³9.5× WHO guideline |
| 97 | Haldia | India · Asia | 47.5 µg/m³9.5× WHO guideline |
| 98 | Cuttack | India · Asia | 47.3 µg/m³9.5× WHO guideline |
| 99 | Gitarama | Rwanda · Africa | 47.1 µg/m³9.4× WHO guideline |
| 100 | Guliston | Uzbekistan · Asia | 47.1 µg/m³9.4× WHO guideline |
Source: IQAir historical PM2.5 city ranking for calendar year 2025. Values are annual average PM2.5 concentrations in µg/m³; WHO multiple is calculated against the WHO annual PM2.5 guideline of 5 µg/m³. Updated: April 25, 2026.
Charts: concentration and regional clustering
The first chart compares the Top 20 cities by annual PM2.5 concentration. The second chart counts how many cities from each region appear in the Top 100, showing that the ranking is shaped by regional air-pollution systems rather than evenly distributed exposure around the world.
Top 20 cities by annual PM2.5, 2025 data
- Loni — 112.5 µg/m³
- Hotan — 109.6 µg/m³
- Byrnihat — 101.1 µg/m³
- Delhi — 99.6 µg/m³
- Faisalabad — 98.8 µg/m³
- Rahim Yar Khan — 92.6 µg/m³
- Ghaziabad — 89.2 µg/m³
- Lahore — 88.9 µg/m³
- Sukkur — 88.6 µg/m³
- Ula — 86.8 µg/m³
- Pattoki — 86.7 µg/m³
- Mullanpur Dhaka — 86.2 µg/m³
- Lodhran — 85.3 µg/m³
- Kashgar — 84.0 µg/m³
- Madhyamgram — 83.3 µg/m³
- New Delhi — 82.2 µg/m³
- Peshawar — 81.7 µg/m³
- Noida — 80.5 µg/m³
- Kizilsu — 79.7 µg/m³
- Sialkot — 78.6 µg/m³
Regional distribution inside the Top 100
- Asia: 95 cities
- Africa: 3 cities
- MENA: 2 cities
- Europe, Americas and Oceania: 0 cities in this Top 100 list
Methodology
This ranking uses annual average PM2.5 concentration as the core metric. PM2.5 refers to fine particulate matter with an aerodynamic diameter of 2.5 micrometers or smaller. The unit is micrograms per cubic meter, written as µg/m³. The data year is calendar year 2025. The article is dated 2026 because it uses the latest full-year 2025 city dataset available at the time of publication.
The primary ranking dataset is IQAir’s historical city PM2.5 ranking for 2025, which compiles measurements from regulatory monitoring stations, low-cost sensors and other validated monitoring sources. City names, country labels and region labels were harmonised for a clean table. Values are kept to one decimal place where the source provides one decimal. The WHO multiple shown in the interactive table is calculated by dividing each annual PM2.5 value by the WHO annual guideline of 5 µg/m³.
The ranking should not be interpreted as a regulatory compliance table. National environmental agencies and local monitoring networks remain the official source for legal compliance in their jurisdictions. Monitoring density, sensor placement, calibration methods, city-boundary definitions and data completeness differ across countries. Some under-monitored cities may be absent, and the absence of a city from the Top 100 does not prove clean air. It may reflect lower measured PM2.5, incomplete monitoring coverage or lack of comparable annual data.
Annual averages are powerful for long-term exposure comparison, but they hide short-term peaks. A city with a high annual mean can still have clean days, while a city with a moderate annual mean can experience severe wildfire smoke, dust or winter-smog episodes. Daily AQI should be used for day-to-day decisions; annual PM2.5 is better suited for comparing structural air-pollution burden.
Insights from the city PM2.5 ranking
Regional concentration is the main story
The Top 100 is not geographically balanced. It is overwhelmingly concentrated in Asia, especially India, Pakistan, China, Bangladesh, Vietnam, Indonesia and Central Asia. This points to shared regional airsheds, industrial corridors, fuel patterns and weather conditions.
City rankings reveal what national averages hide
National PM2.5 averages can obscure local exposure. A country may contain both cleaner coastal cities and severely polluted inland industrial or transport hubs. City-level measurements are therefore essential for understanding where exposure is most intense.
Annual exposure is different from daily AQI
Daily AQI can change quickly with wind, rain, dust, fireworks, crop burning or wildfire smoke. Annual PM2.5 is slower-moving and better at showing the persistent background burden that affects health risk over time.
Clean-air policy must work across sectors
High PM2.5 rarely has one cause. Durable improvement usually requires cleaner power, stricter industrial controls, cleaner transport, dust management, waste-burning enforcement, household-fuel transition and better regional coordination.
What this ranking means for readers
For residents, annual PM2.5 is a long-term exposure signal. It does not replace local health alerts, but it helps explain the background burden behind respiratory and cardiovascular risk. Children, older adults and people with asthma, heart disease or other health vulnerabilities should rely on local health advisories and real-time air-quality alerts for daily decisions.
For people comparing cities for relocation, PM2.5 belongs beside housing, income, climate, transport, education and healthcare access. A city with strong jobs and low rent may still impose hidden costs through pollution exposure, missed work, medical expenses and lower outdoor quality of life.
For businesses and investors, persistent PM2.5 is a productivity and urban-attractiveness issue. High pollution can increase healthcare costs, reduce outdoor activity, make talent attraction harder and raise pressure for tighter environmental regulation. For city governments, annual PM2.5 is a structural indicator: it shows whether clean-air policy is changing the yearly baseline, not only reacting to short smog episodes.
FAQ
What does PM2.5 mean?
PM2.5 means fine particulate matter with a diameter of 2.5 micrometers or smaller. These particles can come from combustion, transport, industry, dust, fires and chemical reactions in the atmosphere. Their small size makes them important for health analysis because they can penetrate deep into the lungs.
Is this ranking the same as AQI?
No. AQI is a real-time or short-period index that can include several pollutants depending on the system used. This ranking uses annual average PM2.5 concentration only. It is better for long-term exposure comparison, while daily AQI is better for deciding whether outdoor activity is advisable on a specific day.
Why can a city rank high even if it has clean days?
The ranking is based on the yearly average. A city can have clean days after rain or wind and still rank high if winter smog, dust, combustion sources or stagnant weather push the annual mean upward. The annual average smooths daily variation into one long-term exposure figure.
Why do South Asian cities appear so often?
Many South Asian cities sit within large regional airsheds where transport, industry, construction dust, biomass burning, crop-residue burning, household fuel use and winter inversions interact. Dense populations and rapid urbanisation can intensify exposure. The pattern is regional, not only municipal.
Is 5 µg/m³ a legal limit?
The 5 µg/m³ value is the WHO annual PM2.5 guideline. It is a health-based benchmark, not automatically a legal standard in every country. National legal limits and compliance rules differ by jurisdiction and should be checked with the relevant environmental agency.
Does a higher PM2.5 value mean the city has unsafe air every day?
No. A high annual PM2.5 value indicates higher long-term particulate exposure, not the same air quality every day. Conditions can vary by season, neighbourhood, wind, rainfall and emission episodes. For daily behaviour, use local real-time air-quality alerts.
Why are some well-known polluted cities missing?
A city may be absent if comparable annual PM2.5 data were not available, if monitoring coverage was insufficient, or if its annual average was below the Top 100 threshold. Absence from this ranking should not be read as proof of clean air.
Can PM2.5 improve quickly?
Short-term improvements can happen after weather changes, fuel restrictions or temporary emission controls. Durable improvement usually requires sustained policy across transport, power, industry, waste, household fuels and construction dust. Cities such as Beijing have shown that long-term reductions are possible, but the process requires consistent enforcement and investment.
Sources
-
IQAir — 2025 World Air Quality Report and historical city PM2.5 ranking.
Used as the primary compiled dataset for annual average city PM2.5 values.
https://www.iqair.com/world-air-quality-report
https://www.iqair.com/world-most-polluted-cities -
World Health Organization — Global Air Quality Guidelines.
Used for the annual PM2.5 health guideline of 5 µg/m³ and interpretation of particulate-matter exposure.
https://www.who.int/publications/i/item/9789240034228 -
World Health Organization — Ambient Air Quality Database.
Used as an official global reference for city-level annual PM2.5, PM10 and NO2 monitoring concepts.
https://www.who.int/data/gho/data/themes/air-pollution/who-air-quality-database -
OpenAQ.
Used as a reference for open air-quality monitoring infrastructure and the availability of measurement data from multiple sources.
https://openaq.org/ -
U.S. Environmental Protection Agency — Particulate Matter basics.
Used for general technical context on fine particles and health relevance.
https://www.epa.gov/pm-pollution/particulate-matter-pm-basics
This ranking should be read together with local air-quality alerts, national monitoring data and health guidance. Annual PM2.5 is useful for long-term comparison, while daily AQI is better for immediate decisions.
StatRanker (Website)
administrator
