Top 100 Happiest Countries (World Happiness Report 2025 Edition)
How the World Happiness Report measures national wellbeing
The World Happiness Report ranks countries by average life evaluation on the 0–10 Cantril ladder, based on Gallup World Poll surveys. The 2025 edition uses a three-year average for 2022–2024, which smooths temporary shocks and makes cross-country comparisons more stable.
“Happiness” here is not mood. It is a broad assessment of life as a whole, and it is strongly connected to social trust, supportive relationships, health, and the quality of institutions.
- Indicator: Life evaluation (Cantril ladder), 0–10 scale
- Reporting window: 2022–2024 (three-year average)
- Ranking basis: Country means with confidence intervals and factor decomposition
Top 10 happiest countries in 2025
The top of the table is still dominated by the Nordics, where high social trust and strong safety nets tend to coincide with low inequality in wellbeing. The 2025 Top 10 also includes two Latin American standouts, reinforcing that supportive social life can lift life evaluations even when GDP per person is lower than in Western Europe.
Europe · Consistently high trust, safety, and strong social support.
Europe · High institutional trust and strong work-life balance norms.
Europe · Tight-knit communities and high perceived freedom.
Europe · Strong social support plus high health and safety outcomes.
Europe · High life satisfaction linked to security and social cohesion.
Americas · Social connectedness and community life stand out globally.
Europe · High material security and strong trust in public institutions.
MENA · High social support contributes strongly to life evaluations.
Europe · Very high incomes plus robust services and safety.
Americas · Strong family and social bonds are a recurring advantage.
Table 1. Top 10 happiest countries (score)
| Rank | Country | Score |
|---|---|---|
| 1 | Finland | 7.736 |
| 2 | Denmark | 7.521 |
| 3 | Iceland | 7.515 |
| 4 | Sweden | 7.345 |
| 5 | Netherlands | 7.306 |
| 6 | Costa Rica | 7.274 |
| 7 | Norway | 7.262 |
| 8 | Israel | 7.234 |
| 9 | Luxembourg | 7.122 |
| 10 | Mexico | 6.979 |
Scores are three-year averages for 2022–2024 (0–10 ladder scale).
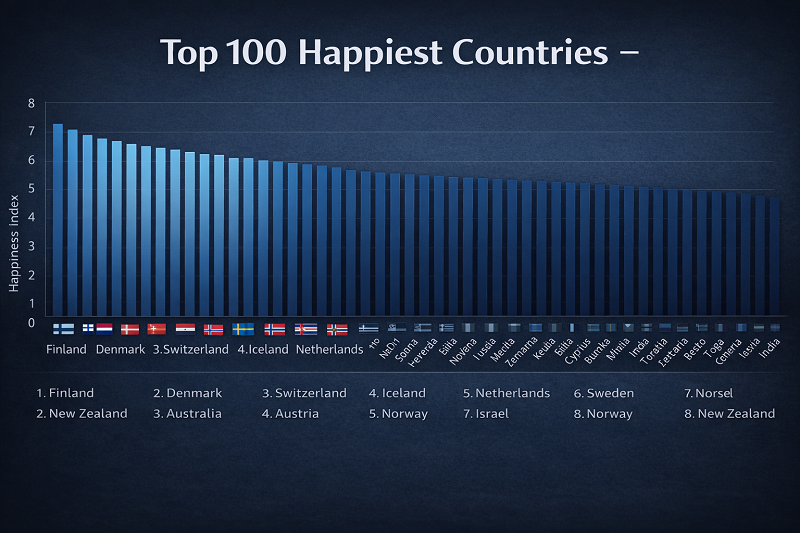
Chart 1. Happiness score for the Top 20
Top 20 (text fallback)
- Finland — 7.736
- Denmark — 7.521
- Iceland — 7.515
- Sweden — 7.345
- Netherlands — 7.306
- Costa Rica — 7.274
- Norway — 7.262
- Israel — 7.234
- Luxembourg — 7.122
- Mexico — 6.979
- Australia — 6.974
- New Zealand — 6.952
- Switzerland — 6.935
- Belgium — 6.910
- Ireland — 6.889
- Lithuania — 6.829
- Austria — 6.810
- Canada — 6.803
- Slovenia — 6.792
- Czechia — 6.775
The bar chart uses the official World Happiness Report 2025 country averages for 2022–2024.
Methodology: how the World Happiness Report score is built
The ranking is based on responses to the Cantril ladder question: respondents rate their life today from 0 (worst possible) to 10 (best possible). For the 2025 edition, country scores are the average of survey waves from 2022–2024, reported with uncertainty bands (confidence intervals). Using a three-year window improves comparability by reducing year-specific noise.
To explain differences in scores across countries, the report presents a factor decomposition that links life evaluations to six correlates: log GDP per capita, social support, healthy life expectancy, freedom to make life choices, generosity, and perceptions of corruption. These components are not “sub-scores” from a questionnaire; they are statistical contributions derived from cross-country relationships in the data. A residual term (“Dystopia + residual”) captures the share not explained by the six factors.
Practical limitations matter. Survey-based wellbeing depends on sampling, question translation, and cultural norms in responding. Country ranks can move when confidence intervals overlap, and the three-year average can still be affected by major shocks (conflict, inflation surges, natural disasters). The score is most useful for comparisons and trends, not as an single definitive verdict on national quality of life.
Insights: what stands out in the 2025 Top 100
- Nordic concentration: Finland, Denmark, Iceland, Sweden and Norway remain global leaders, combining trust, safety and social support.
- Latin American strength at the top: Costa Rica and Mexico appear in the Top 10, highlighting the role of community ties beyond income.
- Europe’s depth: A large share of the Top 30 is European, suggesting that institutional quality and social protection are persistent advantages.
- Multiple pathways: High-income status helps, but it is not sufficient—countries with strong social support and perceived freedom often outperform peers with similar GDP.
The 2025 edition puts extra emphasis on caring, sharing, and everyday prosocial behaviour as drivers of wellbeing. The practical takeaway from the ranking is that social trust and supportive relationships are not “soft” variables—they are tightly connected to how people rate their lives.
What this means for readers
- Relocation: treat the score as a starting point—pair it with wages, housing costs, language, and healthcare access.
- Personal finance: higher happiness is often linked with lower insecurity and better public services, which can change the real value of income.
- Business and investment: high-trust environments tend to reduce friction (contracts, compliance, corruption risks) and improve productivity.
- Policy context: social support and trust are measurable assets; changes in them can shift wellbeing even when GDP grows.
FAQ: understanding the happiness ranking
Is this a “happiness” ranking or a life satisfaction ranking?
It is primarily a life evaluation ranking. The main measure is the Cantril ladder score (0–10), which captures how people rate their life as a whole rather than how happy they felt yesterday.
Why does the report use a three-year average (2022–2024)?
Averaging across three years reduces short-term volatility from temporary events and improves statistical precision, especially for smaller countries.
Can small rank changes be over-interpreted?
Not always. Many countries have overlapping confidence intervals, meaning small differences in rank may not be statistically meaningful. It is safer to compare broad groups or multi-year changes.
Does a higher score mean people feel happy all the time?
No. High-scoring countries often have lower levels of severe distress and higher perceived security and trust, but individuals still experience normal ups and downs.
What do the “explained by” factors actually represent?
They are model-based contributions that show how much each factor is associated with the country’s score relative to a baseline. They help interpret differences but are not direct survey subscales.
Why do some countries with modest GDP rank surprisingly high?
Social support, trust, and perceived freedom can boost life evaluations even when income is lower. Strong community ties and supportive institutions often matter as much as material conditions.
Full Top 100 ranking (search, sort, filters)
Table 2 lists the Top 100 happiest countries from the World Happiness Report 2025 edition (three-year average for 2022–2024). Search by country, filter by region, and sort by the score level or by the year-over-year change in score.
Table 2. Top 100 happiest countries (World Happiness Report 2025 edition)
| Rank | Country | Score / Share | YoY (score) |
|---|---|---|---|
| 1 | Finland | 7.736 1.24% | −0.005 |
| 2 | Denmark | 7.521 1.20% | −0.062 |
| 3 | Iceland | 7.515 1.20% | −0.010 |
| 4 | Sweden | 7.345 1.18% | +0.001 |
| 5 | Netherlands | 7.306 1.17% | −0.013 |
| 6 | Costa Rica | 7.274 1.17% | +0.319 |
| 7 | Norway | 7.262 1.16% | −0.040 |
| 8 | Israel | 7.234 1.16% | −0.107 |
| 9 | Luxembourg | 7.122 1.14% | +0.000 |
| 10 | Mexico | 6.979 1.12% | +0.301 |
| 11 | Australia | 6.974 1.12% | −0.083 |
| 12 | New Zealand | 6.952 1.11% | −0.077 |
| 13 | Switzerland | 6.935 1.11% | −0.125 |
| 14 | Belgium | 6.910 1.11% | +0.016 |
| 15 | Ireland | 6.889 1.10% | +0.051 |
| 16 | Lithuania | 6.829 1.09% | +0.057 |
| 17 | Austria | 6.810 1.09% | −0.011 |
| 18 | Canada | 6.803 1.09% | −0.066 |
| 19 | Slovenia | 6.792 1.09% | −0.024 |
| 20 | Czechia | 6.775 1.09% | +0.014 |
| 21 | United Arab Emirates | 6.759 1.08% | +0.166 |
| 22 | Germany | 6.753 1.08% | −0.038 |
| 23 | United Kingdom | 6.728 1.08% | −0.069 |
| 24 | United States | 6.724 1.08% | +0.002 |
| 25 | Belize | 6.711 1.07% | −0.015 |
| 26 | Poland | 6.673 1.07% | +0.084 |
| 27 | Taiwan Province of China | 6.669 1.07% | +0.020 |
| 28 | Uruguay | 6.661 1.07% | −0.003 |
| 29 | Kosovo | 6.659 1.07% | +0.086 |
| 30 | Kuwait | 6.629 1.06% | −0.322 |
| 31 | Serbia | 6.609 1.06% | −0.042 |
| 32 | Saudi Arabia | 6.594 1.06% | −0.004 |
| 33 | France | 6.594 1.06% | −0.004 |
| 34 | Singapore | 6.564 1.05% | −0.019 |
| 35 | Romania | 6.564 1.05% | −0.019 |
| 36 | Brazil | 6.547 1.05% | −0.067 |
| 37 | El Salvador | 6.535 1.05% | +0.060 |
| 38 | Spain | 6.534 1.05% | +0.036 |
| 39 | Estonia | 6.519 1.04% | +0.028 |
| 40 | Italy | 6.519 1.04% | +0.028 |
| 41 | Panama | 6.504 1.04% | −0.012 |
| 42 | Argentina | 6.397 1.02% | −0.558 |
| 43 | Kazakhstan | 6.383 1.02% | +0.001 |
| 44 | Guatemala | 6.360 1.02% | −0.031 |
| 45 | Chile | 6.343 1.02% | +0.050 |
| 46 | Viet Nam | 6.343 1.02% | +0.050 |
| 47 | Nicaragua | 6.343 1.02% | +0.050 |
| 48 | Malta | 6.343 1.02% | +0.050 |
| 49 | Thailand | 6.343 1.02% | +0.050 |
| 50 | Slovakia | 6.343 1.02% | +0.050 |
| 51 | Latvia | 6.343 1.02% | +0.050 |
| 52 | Oman | 6.343 1.02% | +0.050 |
| 53 | Uzbekistan | 6.343 1.02% | +0.050 |
| 54 | Paraguay | 6.343 1.02% | +0.050 |
| 55 | Japan | 6.343 1.02% | +0.050 |
| 56 | Bosnia and Herzegovina | 6.343 1.02% | +0.050 |
| 57 | Philippines | 6.343 1.02% | +0.050 |
| 58 | Republic of Korea | 6.343 1.02% | +0.050 |
| 59 | Bahrain | 6.343 1.02% | +0.050 |
| 60 | Portugal | 6.343 1.02% | +0.050 |
| 61 | Colombia | 6.343 1.02% | +0.050 |
| 62 | Ecuador | 6.343 1.02% | +0.050 |
| 63 | Honduras | 6.343 1.02% | +0.050 |
| 64 | Malaysia | 6.343 1.02% | +0.050 |
| 65 | Peru | 6.343 1.02% | +0.050 |
| 66 | Russian Federation | 6.343 1.02% | +0.050 |
| 67 | Cyprus | 6.343 1.02% | +0.050 |
| 68 | China | 6.343 1.02% | +0.050 |
| 69 | Hungary | 6.343 1.02% | +0.050 |
| 70 | Trinidad and Tobago | 6.343 1.02% | +0.050 |
| 71 | Montenegro | 6.343 1.02% | +0.050 |
| 72 | Croatia | 6.343 1.02% | +0.050 |
| 73 | Jamaica | 6.343 1.02% | +0.050 |
| 74 | Bolivia | 6.343 1.02% | +0.050 |
| 75 | Kyrgyzstan | 6.343 1.02% | +0.050 |
| 76 | Dominican Republic | 6.343 1.02% | +0.050 |
| 77 | Mongolia | 6.343 1.02% | +0.050 |
| 78 | Mauritius | 6.343 1.02% | +0.050 |
| 79 | Libya | 6.343 1.02% | +0.050 |
| 80 | Republic of Moldova | 6.343 1.02% | +0.050 |
| 81 | Greece | 6.343 1.02% | +0.050 |
| 82 | Venezuela | 6.343 1.02% | +0.050 |
| 83 | Indonesia | 6.343 1.02% | +0.050 |
| 84 | Algeria | 5.571 0.89% | −0.011 |
| 85 | Bulgaria | 5.562 0.89% | +0.019 |
| 86 | North Macedonia | 5.556 0.89% | −0.043 |
| 87 | Armenia | 5.494 0.88% | −0.058 |
| 88 | Hong Kong SAR of China | 5.445 0.87% | −0.028 |
| 89 | Albania | 5.411 0.87% | −0.063 |
| 90 | Tajikistan | 5.384 0.86% | −0.026 |
| 91 | Georgia | 5.330 0.85% | −0.060 |
| 92 | Nepal | 5.232 0.84% | −0.028 |
| 93 | Lao PDR | 5.201 0.83% | +0.000 |
| 94 | Türkiye | 5.194 0.83% | −0.037 |
| 95 | South Africa | 5.193 0.83% | −0.116 |
| 96 | Mozambique | 5.190 0.83% | −0.026 |
| 97 | Gabon | 5.120 0.82% | +0.014 |
| 98 | Côte d’Ivoire | 5.102 0.82% | +0.022 |
| 99 | Iran | 5.093 0.82% | +0.170 |
| 100 | Congo | 5.030 0.81% | −0.191 |
Score is the 2022–2024 three-year average (0–10 Cantril ladder). YoY compares the 2024 value to the prior year (2023) in the World Happiness Report dataset.
Chart 2. Happiness score vs. social support contribution (Top 100)
Each dot is a country. The x-axis is the model-based contribution from social support used in the report’s decomposition, and the y-axis is the overall life evaluation score.
Chart unavailable. You can still use Table 2 above to search, sort and filter the full Top 100 ranking.
Data source: World Happiness Report 2025 edition — “Data for Figure 2.1 (2011–2024)”.
How to interpret the 2025 happiness ranking
The Top 100 list is best read as a picture of average life evaluation rather than an absolute measure of “joy”. Countries rise to the top when daily life combines material security with safety, health, freedom, and—critically—reliable social support. Across editions, the World Happiness Report shows that trust and supportive relationships are consistently linked with higher national wellbeing.
What the Top 100 table is telling you
The 2025 edition remains a strong reminder that there are multiple routes to high life evaluation. The Nordics combine broad material security with high institutional trust and strong social support. At the same time, some countries with lower incomes score surprisingly well thanks to community ties, perceived agency, and supportive social networks. These patterns show up in the decomposition charts: the same overall score can be achieved with different mixes of drivers.
For comparisons, it is safer to look at groups (top 10, top 20, top 50) and the size of the gaps, not single-rank differences where confidence intervals often overlap.
Practical takeaways
- Relocation: use the score to shortlist, then check wages, housing affordability, safety, healthcare access, and language fit.
- Personal finance: a higher score often comes with lower insecurity and better public services, changing the real value of income.
- Business climate: high-trust environments typically reduce friction around contracts, compliance, and corruption risks.
- Time horizon: the score is a three-year average, so it is better for structural comparisons than for “this month’s mood”.
Limits and common misreads
Survey-based wellbeing is comparable across countries, but it is not immune to differences in language, culture, and expectations. Small movements in rank can reflect statistical noise when confidence intervals overlap. The three-year averaging window reduces volatility but can also mask very recent changes. For decisions, pair this ranking with complementary indicators such as real incomes, housing costs, safety statistics, and health system capacity.
The “explained by” components are not questionnaire sub-scores. They are model-based contributions that help interpret cross-country differences. A country can have a strong income contribution and still rank lower overall if social support, perceived freedom, or trust are weaker.
Sources
Official documentation and datasets used for the Top 100 table and charts.
-
World Happiness Report 2025 — edition landing pagehttps://www.worldhappiness.report/ed/2025/
-
World Happiness Report — Data Sharing (Figure 2.1 datasets)https://www.worldhappiness.report/data-sharing/
-
WHR 2025 — Data for Figure 2.1 (country rankings, confidence intervals, factor decomposition)https://files.worldhappiness.report/WHR25_Data_Figure_2.1v3.xlsx
-
WHR 2025 — Chapter 2 PDF (method and interpretation)https://files.worldhappiness.report/WHR25_Ch02.pdf
-
WHR 2025 — Chapter 2 Statistical Appendixhttps://files.worldhappiness.report/WHR25_Ch02_Appendix_B.pdf