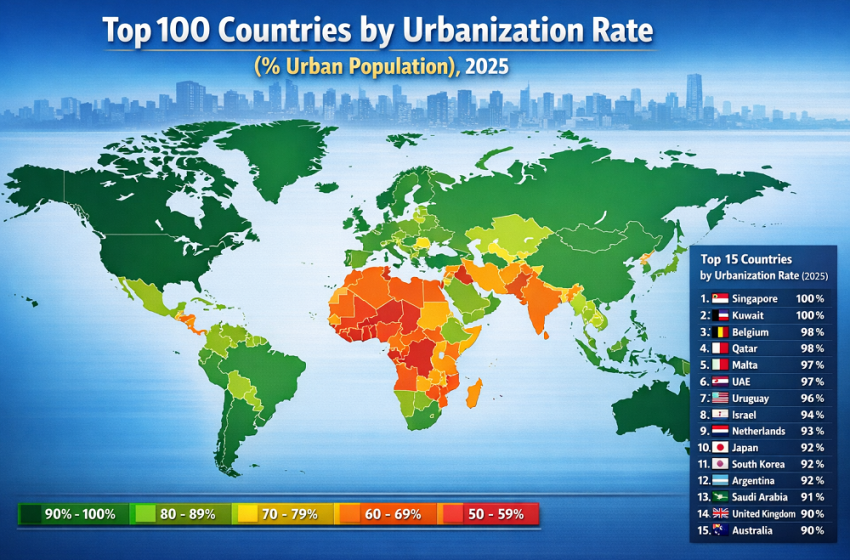
Top 100 Countries by Urbanization Rate (% Urban Population), 2025
Urbanization is one of the fastest ways to understand how a country is physically organized. A high urban share usually means more population concentrated around cities, denser service networks, more commuter infrastructure, and stronger metropolitan labor markets. A lower share usually points to a larger rural footprint, a more dispersed settlement pattern, or an earlier stage of structural transformation.
For a ranking page, the most useful comparison is not a long theory section. It is a clean four-part read: country, region, urban share, and distance from the world average. That is why this page is built around a single question: how urban is each country relative to the global norm?
The latest full year in the current public country series is 2024, so this page uses 2024 as the working proxy for a 2025 snapshot. The global average is 61.7%. That means any country above 61.7% is more urbanized than the world as a whole, while countries below that level still carry a heavier rural population mix.
This is a ranking about settlement structure, not a direct ranking of prosperity or quality of life. Some countries are highly urbanized because they are rich, dense, service-driven economies. Others are highly urbanized because they are geographically compact, heavily coastal, or statistically defined in a way that leaves very little population outside urban settlements.
Top 10 most urbanized countries in the 2025 snapshot
The Top 10 is not a list of the “best” countries. It is mostly a list of places where almost all population is counted as urban. That is why micro-territories and compact city economies dominate the very top, while only a small number of larger sovereign states manage to reach a similar level.
Urban share: 100.00% · Delta vs world average: +38.30 pp
Bermuda sits at the ceiling of the indicator. For practical reading, that means housing, retail, services, roads, and daily commuting function inside an almost fully urban settlement system.
Urban share: 100.00% · Delta vs world average: +38.30 pp
Gibraltar’s position reflects a compact territory where urban life is effectively the default condition rather than one option among many settlement types.
Urban share: 100.00% · Delta vs world average: +38.30 pp
Hong Kong is the classic large-scale city economy in this group: dense housing, rail-led movement, service concentration, and a metropolitan labor market that shapes the entire territory.
Urban share: 100.00% · Delta vs world average: +38.30 pp
Kuwait shows how a small territory with strong metropolitan concentration can produce a fully urban population profile even outside the city-state model.
Urban share: 100.00% · Delta vs world average: +38.30 pp
Macao combines limited land area, intense built density, and a service-heavy economy, so its population structure leaves virtually no statistical rural fringe.
Urban share: 100.00% · Delta vs world average: +38.30 pp
Monaco is not just highly urbanized; it is effectively all city. It belongs to a category that should be read separately from large, internally varied countries.
Urban share: 100.00% · Delta vs world average: +38.30 pp
Singapore pairs full urbanization with advanced planning, logistics, public transport, and one of the clearest examples of state-managed metropolitan efficiency.
Urban share: 99.39% · Delta vs world average: +37.69 pp
Qatar is one of the strongest non-microstate examples of near-total urban concentration, reflecting migration, income concentration, and metropolitan settlement patterns.
Urban share: 98.22% · Delta vs world average: +36.52 pp
Belgium is analytically important because it reaches the top tier without being a micro-territory. It shows what a mature, dense, multi-city European economy looks like in settlement terms.
Urban share: 97.93% · Delta vs world average: +36.23 pp
San Marino completes a top tier that is best understood as a mix of city-territories, compact states, and a few unusually dense national systems.
Top 20 countries by urbanization rate
The upper end of the ranking is more diverse than it first looks. Europe contributes many microstates and dense mature economies. Asia contributes both city economies and large advanced states. MENA contributes highly urbanized Gulf systems. The Americas are carried not only by small territories, but also by Latin American countries where urbanization moved faster than income convergence for decades.
How to read the top correctly
The first thing to separate is micro-territories versus large sovereign states. A value near 100% means something very different in Monaco than in Belgium or Japan. One reflects scale compression; the other reflects decades of dense infrastructure, suburban integration, and urban continuity.
Why Latin America matters here
Countries such as Uruguay and Argentina remind readers that urbanization can run ahead of rich-country income levels. This is one reason urbanization rate should never be used as a shortcut for national wealth.
Top 100 countries by urbanization rate
The table below is designed for direct comparison. Each row shows the country, region, urban share, and the gap versus the global average of 61.7%. By default, the page opens in Top 20 mode for readability, but all 100 rows are present in the HTML source. JavaScript only handles filtering and visibility.
| Country | Region | Urban share | Delta vs world average |
|---|---|---|---|
| #1 Bermuda | Americas | 100.00% | +38.30 pp |
| #2 Gibraltar | Europe | 100.00% | +38.30 pp |
| #3 Hong Kong | Asia | 100.00% | +38.30 pp |
| #4 Kuwait | MENA | 100.00% | +38.30 pp |
| #5 Macao | Asia | 100.00% | +38.30 pp |
| #6 Monaco | Europe | 100.00% | +38.30 pp |
| #7 Singapore | Asia | 100.00% | +38.30 pp |
| #8 Qatar | MENA | 99.39% | +37.69 pp |
| #9 Belgium | Europe | 98.22% | +36.52 pp |
| #10 San Marino | Europe | 97.93% | +36.23 pp |
| #11 Uruguay | Americas | 95.85% | +34.15 pp |
| #12 Malta | Europe | 95.01% | +33.31 pp |
| #13 Iceland | Europe | 94.09% | +32.39 pp |
| #14 Puerto Rico | Americas | 93.66% | +31.96 pp |
| #15 Netherlands | Europe | 93.45% | +31.75 pp |
| #16 Israel | MENA | 92.95% | +31.25 pp |
| #17 Argentina | Americas | 92.58% | +30.88 pp |
| #18 Luxembourg | Europe | 92.27% | +30.57 pp |
| #19 Jordan | MENA | 92.21% | +30.51 pp |
| #20 Japan | Asia | 92.13% | +30.43 pp |
| #21 Gabon | Africa | 91.31% | +29.61 pp |
| #22 Bahrain | MENA | 90.00% | +28.30 pp |
| #23 Lebanon | MENA | 89.60% | +27.90 pp |
| #24 Oman | MENA | 89.00% | +27.30 pp |
| #25 Sweden | Europe | 88.98% | +27.28 pp |
| #26 Denmark | Europe | 88.63% | +26.93 pp |
| #27 Venezuela | Americas | 88.50% | +26.80 pp |
| #28 Chile | Americas | 88.12% | +26.42 pp |
| #29 Brazil | Americas | 88.02% | +26.32 pp |
| #30 United Arab Emirates | MENA | 88.01% | +26.31 pp |
| #31 Andorra | Europe | 87.75% | +26.05 pp |
| #32 New Zealand | Oceania | 87.09% | +25.39 pp |
| #33 Australia | Oceania | 86.75% | +25.05 pp |
| #34 Finland | Europe | 85.87% | +24.17 pp |
| #35 Saudi Arabia | MENA | 85.17% | +23.47 pp |
| #36 Dominican Republic | Americas | 85.01% | +23.31 pp |
| #37 United Kingdom | Europe | 84.88% | +23.18 pp |
| #38 Norway | Europe | 84.32% | +22.62 pp |
| #39 Bahamas | Americas | 83.76% | +22.06 pp |
| #40 United States | Americas | 83.51% | +21.81 pp |
| #41 Costa Rica | Americas | 83.17% | +21.47 pp |
| #42 Palau | Oceania | 82.84% | +21.14 pp |
| #43 Colombia | Americas | 82.65% | +20.95 pp |
| #44 France | Europe | 82.04% | +20.34 pp |
| #45 Canada | Americas | 81.98% | +20.28 pp |
| #46 Libya | MENA | 81.91% | +20.21 pp |
| #47 Mexico | Americas | 81.86% | +20.16 pp |
| #48 Spain | Europe | 81.80% | +20.10 pp |
| #49 South Korea | Asia | 81.50% | +19.80 pp |
| #50 Belarus | Europe | 81.13% | +19.43 pp |
| #51 Greece | Europe | 80.98% | +19.28 pp |
| #52 Brunei | Asia | 79.44% | +17.74 pp |
| #53 Malaysia | Asia | 79.20% | +17.50 pp |
| #54 Peru | Americas | 79.14% | +17.44 pp |
| #55 Djibouti | Africa | 78.73% | +17.03 pp |
| #56 Germany | Europe | 77.89% | +16.19 pp |
| #57 Turkey | MENA | 77.89% | +16.19 pp |
| #58 Palestine | MENA | 77.88% | +16.18 pp |
| #59 Iran | MENA | 77.70% | +16.00 pp |
| #60 Bulgaria | Europe | 77.04% | +15.34 pp |
| #61 Sao Tome and Principe | Africa | 77.01% | +15.31 pp |
| #62 El Salvador | Americas | 76.00% | +14.30 pp |
| #63 Algeria | MENA | 75.75% | +14.05 pp |
| #64 Russia | Europe | 75.55% | +13.85 pp |
| #65 Equatorial Guinea | Africa | 74.87% | +13.17 pp |
| #66 Czechia | Europe | 74.74% | +13.04 pp |
| #67 Switzerland | Europe | 74.33% | +12.63 pp |
| #68 Botswana | Africa | 73.49% | +11.79 pp |
| #69 Hungary | Europe | 73.18% | +11.48 pp |
| #70 New Caledonia | Oceania | 73.11% | +11.41 pp |
| #71 Dominica | Americas | 72.31% | +10.61 pp |
| #72 Italy | Europe | 72.29% | +10.59 pp |
| #73 Iraq | MENA | 71.85% | +10.15 pp |
| #74 Bolivia | Americas | 71.54% | +9.84 pp |
| #75 Tunisia | MENA | 70.88% | +9.18 pp |
| #76 Ukraine | Europe | 70.28% | +8.58 pp |
| #77 Estonia | Europe | 70.02% | +8.32 pp |
| #78 Panama | Americas | 69.89% | +8.19 pp |
| #79 Republic of the Congo | Africa | 69.64% | +7.94 pp |
| #80 South Africa | Africa | 69.30% | +7.60 pp |
| #81 Angola | Africa | 69.28% | +7.58 pp |
| #82 Mongolia | Asia | 69.26% | +7.56 pp |
| #83 Lithuania | Europe | 68.94% | +7.24 pp |
| #84 Montenegro | Europe | 68.84% | +7.14 pp |
| #85 Latvia | Europe | 68.82% | +7.12 pp |
| #86 Portugal | Europe | 68.42% | +6.72 pp |
| #87 Cape Verde | Africa | 68.41% | +6.71 pp |
| #88 Cyprus | MENA | 67.08% | +5.38 pp |
| #89 Tuvalu | Oceania | 66.93% | +5.23 pp |
| #90 Suriname | Americas | 66.53% | +4.83 pp |
| #91 Morocco | MENA | 65.64% | +3.94 pp |
| #92 China | Asia | 65.54% | +3.84 pp |
| #93 Albania | Europe | 65.38% | +3.68 pp |
| #94 Gambia | Africa | 65.08% | +3.38 pp |
| #95 Ecuador | Americas | 65.03% | +3.33 pp |
| #96 Ireland | Europe | 64.76% | +3.06 pp |
| #97 Armenia | Asia | 63.93% | +2.23 pp |
| #98 North Korea | Asia | 63.50% | +1.80 pp |
| #99 Paraguay | Americas | 63.49% | +1.79 pp |
| #100 Georgia | Asia | 61.16% | −0.54 pp |
Source base: World Bank urban population (% of total population), sourced from UN urbanization data; ranking view uses the latest full-year values available for 2024 as a 2025 snapshot. All rows are present directly in the HTML source.
Insights and interpretation
The first pattern in this ranking is extreme concentration at the top. Most of the very highest scores belong to places where national territory and urban territory are practically the same thing. That is why Bermuda, Gibraltar, Macao, Monaco, and Singapore cluster so tightly. The number is real, but the interpretation is narrow: a 100% urban share in a city-territory does not carry the same analytical meaning as 90%+ in a larger, internally differentiated country.
The second pattern is that Latin America remains one of the world’s most urbanized broad regions, even though many of its countries do not rank among the richest. Uruguay, Argentina, Chile, Brazil, Colombia, Mexico, Peru, and others illustrate a long-known development pattern: cities grew quickly, sometimes faster than industrial upgrading or income catch-up. For readers, this matters because it breaks a common shortcut. High urbanization does not automatically mean high productivity or high wages.
The third pattern is that the most economically interesting part of the ranking is often not the Top 10, but the band around 60% to 80%. That is where a country is urban enough for city systems to dominate national demand, but still dynamic enough for transport, utilities, warehousing, housing supply, peri-urban growth, and service coverage to keep changing rapidly. Countries around this band are often where the biggest medium-term infrastructure stories sit.
Europe’s role in the Top 100 is also worth reading carefully. Some of its entries are tiny states, but others are large mature systems where the ranking reflects urban continuity rather than city-state scale. Belgium is a strong example. So are the Netherlands and the United Kingdom, though each gets there through a different historical geography. In Asia, the ranking splits between fully urban city economies and large countries still moving through a longer transition. China, for example, is now above the world average, but still far from the top tier, which tells a more interesting story than either “urban giant” or “still rural” would suggest on its own.
What urbanization rate does not tell you
- It does not tell you whether housing is affordable.
- It does not tell you whether a country is rich.
- It does not tell you whether jobs are evenly spread across cities.
- It does not tell you whether urban growth is planned well or badly.
- It does not solve the definition problem: “urban” is still counted using national rules, not one fully uniform global standard.
What this means for the reader
- For migration decisions: a higher urban share often means thicker job markets, better university access, and stronger health-service concentration, but also structurally tighter housing markets.
- For logistics and retail: urban concentration usually lowers delivery friction and improves customer density, which matters for e-commerce, groceries, and platform services.
- For real-estate watchers: urbanization is a demand context variable, not a price forecast. It matters most when paired with income, supply, and land-use rules.
- For investors: countries near or modestly above the world average can be more informative than countries already near 100%, because they are often where urban buildout is still reshaping the economy.
- For country comparison: the delta versus the 61.7% world average is the fastest way to locate a country in the global settlement hierarchy.
Methodology
This ranking is built around the World Bank indicator Urban population (% of total population). In the World Bank metadata, urban population refers to people living in areas defined as urban by national statistical offices, while the data are collected and smoothed by the United Nations Population Division. That point matters because it means the series is internationally assembled, but not based on one single global urban definition.
The latest full year currently available in the public country series is 2024, so this article uses 2024 as the proxy year for a 2025 ranking page. This is deliberate. It is better to anchor the page to the latest complete year than to imply a false precision for a year that is not yet fully published across countries.
The comparison anchor on this page is the world average of 61.7% shown in the 2024 global ranking. The “delta vs world average” is calculated as each country’s urban share minus 61.7 percentage points. Country names have been lightly standardized for readability. Regions are grouped into practical editorial buckets: Europe, Asia, Americas, MENA, Africa, and Oceania.
There are several limitations readers should keep in mind. First, countries define “urban” differently: by administrative status, settlement size, density, infrastructure, or mixed criteria. Second, microstates and city-territories naturally crowd the top of the ranking. Third, urbanization rate should not be confused with metropolitan concentration, density, or planning quality. A country can be highly urbanized but poorly managed, or only moderately urbanized but rapidly modernizing.
The safest interpretation is this: urbanization rate is a strong structural comparison metric, but a weak standalone welfare metric. It becomes much more useful when read together with income, infrastructure, housing supply, and demographic change.
FAQ
Why are so many tiny territories at the top of the ranking?
Because almost the whole territory is counted as urban. In a microstate or compact territory, there may be little or no population living outside an urban settlement system, so the percentage quickly rises to 100% or very close to it.
Does a higher urbanization rate mean a country is richer?
No. Rich countries are often highly urbanized, but the relationship is not one-to-one. Latin America is the clearest reminder: several countries are very urbanized without matching the income levels of the richest OECD economies.
Why use 2024 data on a 2025 page?
Because 2024 is the latest complete year in the public country series. Using the last full year is more reliable than pretending that a fully comparable 2025 dataset already exists.
Why is the world average lower than many countries in the Top 100?
Because this page is a ranking of the most urbanized countries. Once you filter out the lower half of the global distribution, most entries will naturally sit above the world average.
Can two countries with the same urbanization rate still be very different?
Yes. One may be a dense city economy with advanced transit, while another may have a few dominant cities and a different infrastructure profile. The same percentage can sit on top of very different physical and economic realities.
Is urbanization the same as living in a megacity?
No. A country can be highly urbanized through many mid-sized cities, suburban belts, and interconnected towns. Urbanization rate does not tell you whether the country is dominated by one megacity or by a network of smaller urban centers.
What is the quickest way to use this ranking well?
Start with the country’s urban share, then compare it with the 61.7% world average, then look at regional context, and only after that ask what the number might imply for jobs, infrastructure, housing, or market access.
Sources
- World Bank — Urban population (% of total population)
- World Bank metadata glossary — definition and methodology for SP.URB.TOTL.IN.ZS
- United Nations Population Division — World Urbanization Prospects
- Our World in Data — Share of the population living in urban areas
- TheGlobalEconomy — Percent urban population, 2024 ranking view