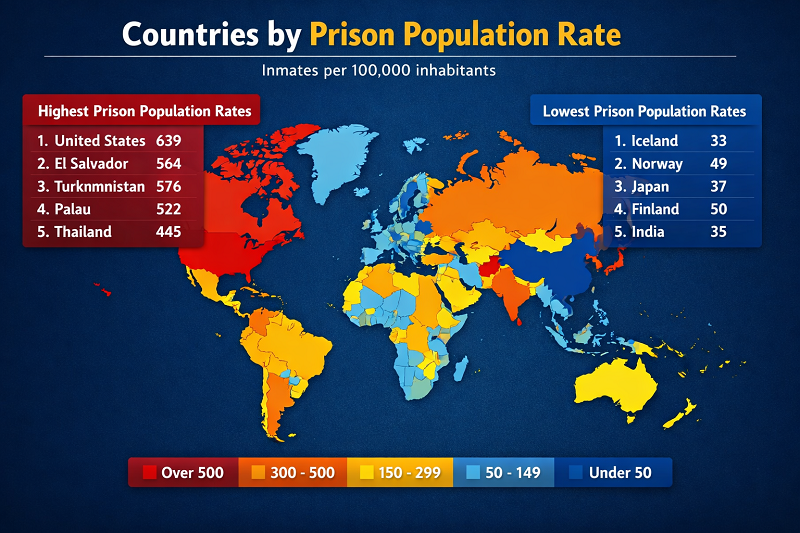
Top 100 Countries by Prison Population Rate in 2025
How prison population rate should be read in a 2025 snapshot
Indicator: prisoners per 100,000 population · Scope here: sovereign countries only · Latest available national figures used as the 2025 snapshot
Prison population rate is one of the clearest cross-country measures of how heavily a state relies on imprisonment. It standardizes prison populations by national population size, which makes a small country with a very high incarceration footprint directly comparable to a very large country. For justice analysis, that matters more than raw prisoner totals alone.
In the World Prison Brief family of datasets, the rate covers people held in prison, including pre-trial detainees and remand prisoners. That means the indicator captures not only sentencing intensity, but also how much a system depends on custodial detention before conviction. In other words, a very high rate can reflect a mix of policing, prosecution, sentencing rules, prison capacity choices, and pre-trial detention practice.
The sovereign-country ranking in this article is led by El Salvador, Cuba, Rwanda, Turkmenistan and the United States. That top tier is unusually concentrated: ten of the top twenty sovereign states are in the Americas, while small island states and compact systems can jump sharply when a modest absolute prison population is divided by a small national population.
Top 10 countries by prison population rate
The leading positions are not all driven by the same story. Some systems reflect sweeping security crackdowns, some reflect long-run penal policy, and some are structurally amplified by small population size. The rate is therefore a signal of intensity, not a simple moral ranking of “safe” or “unsafe” societies.
1,659 prisoners per 100,000 · 109,519 prisoners
El Salvador is a global outlier. Its rate is far above every other sovereign state in this list and reflects a radically expanded use of incarceration in recent years.
794 per 100,000 · 90,000 prisoners
Cuba remains in the extreme high-incarceration tier. The gap between Cuba and the rest of the field is still very large, even after the exceptional Salvadoran surge.
637 per 100,000 · 89,034 prisoners
Rwanda combines a very high incarceration rate with a sizeable prison population for its demographic scale, keeping it firmly among the world’s most prison-intensive systems.
576 per 100,000 · 35,000 prisoners
Turkmenistan stands out because its rate is extremely high without the sheer population size that drives the biggest absolute prison systems elsewhere.
541 per 100,000 · 1,808,100 prisoners
The United States is the most consequential large-country case in the ranking: not the highest sovereign rate, but by far the largest prison population in absolute terms among the listed sovereign countries.
522 per 100,000 · 23,798 prisoners
Panama’s position shows how Central America remains heavily represented at the top of imprisonment rankings, even after excluding territories and non-sovereign systems.
516 per 100,000 · 557 prisoners
Tonga illustrates why rate and total should always be read together: the absolute prison population is tiny, but the incarceration burden relative to population is still extremely high.
449 per 100,000 · 15,767 prisoners
Uruguay is one of the strongest examples of a high-income or upper-middle-income democracy with a prison rate that sits much closer to punitive systems than to Western European norms.
424 per 100,000 · 362,422 prisoners
Turkey pairs a very high rate with one of the world’s biggest prison populations, making it one of the most important prison systems in comparative justice analysis.
409 per 100,000 · 1,617 prisoners
The Bahamas rounds out the sovereign Top 10, reinforcing how the Caribbean remains overrepresented in the global high-incarceration tier.
Table 1. Top 10 sovereign countries by prison population rate
| Rank | Country | Rate per 100,000 | Prisoners |
|---|---|---|---|
| 1 | El Salvador | 1,659 | 109,519 |
| 2 | Cuba | 794 | 90,000 |
| 3 | Rwanda | 637 | 89,034 |
| 4 | Turkmenistan | 576 | 35,000 |
| 5 | United States | 541 | 1,808,100 |
| 6 | Panama | 522 | 23,798 |
| 7 | Tonga | 516 | 557 |
| 8 | Uruguay | 449 | 15,767 |
| 9 | Turkey | 424 | 362,422 |
| 10 | Bahamas | 409 | 1,617 |
Rate = prisoners per 100,000 population. Prisoner totals are shown for scale because a very high rate in a microstate can coexist with a very small prison system in absolute terms.
Chart 1. Top 20 sovereign countries by prison population rate
- El Salvador — 1,659 per 100,000
- Cuba — 794 per 100,000
- Rwanda — 637 per 100,000
- Turkmenistan — 576 per 100,000
- United States — 541 per 100,000
- Panama — 522 per 100,000
- Tonga — 516 per 100,000
- Uruguay — 449 per 100,000
- Turkey — 424 per 100,000
- Bahamas — 409 per 100,000
- Antigua and Barbuda — 400 per 100,000
- Seychelles — 393 per 100,000
- Brazil — 392 per 100,000
- Thailand — 391 per 100,000
- Palau — 367 per 100,000
- Cape Verde — 366 per 100,000
- St. Vincent and the Grenadines — 353 per 100,000
- Dominica — 348 per 100,000
- Belarus — 345 per 100,000
- Nauru — 345 per 100,000
Methodology
This page uses the latest available prison population rate data as a practical 2025 snapshot, not a single-date census. The base concept is the World Prison Brief rate: prisoners per 100,000 population, including pre-trial detainees and remand prisoners. Because the World Prison Brief “highest to lowest” universe also includes territories and subnational prison systems, this article filters those out and keeps sovereign-country reporting only, so the “Top 100 countries” label remains accurate.
The rate is the primary ranking metric. Prisoner totals are included as a companion field because they add scale and interpretation. A country can rank very high on the rate with only a few hundred people in custody, while a lower-rate country can still operate one of the largest prison systems in the world in absolute terms.
Data dates vary by country. The World Prison Brief itself warns that the “highest to lowest” lists use the most recent available data and that countries are not necessarily aligned to the same reference date. That is normal for comparative prison data, where administrative updates arrive asynchronously. In the text, values are lightly harmonized and rounded for readability.
Insights and takeaways
The first pattern is regional concentration. The Americas dominate the upper edge of the sovereign ranking: ten of the top twenty are in the Americas, and the Caribbean/Central America corridor is especially prominent. That suggests the global imprisonment frontier is not just a story about one famous outlier, but about a broader regional cluster of punitive or detention-heavy systems.
The second pattern is the gap between rate and scale. The United States is only fifth in the sovereign rate ranking, but it remains the single largest prison system in absolute numbers among sovereign states in this comparison. Brazil, Turkey, Russia and Thailand show a similar but less extreme pattern: they combine high or very high rates with prison systems that are large enough to shape regional and global totals.
The third pattern is small-state volatility. Tonga, Palau, Nauru, Dominica and St. Kitts and Nevis all rank very high on the rate, but their absolute prison populations are tiny. These cases are analytically real, not errors, yet they should be interpreted with caution because a modest shift in prisoner count or population can change the rate sharply.
What this means for the reader
For readers interested in justice systems, migration, civil liberties or public policy, prison population rate is a fast way to understand the intensity of custodial punishment in a country. A high rate does not automatically tell you whether crime is higher, whether prisons are safer, or whether justice outcomes are better. What it does tell you is that the state relies more heavily on imprisonment relative to population size.
For journalists, NGOs and researchers, the most useful habit is to read the rate together with three other lenses: absolute prisoner totals, the pre-trial share, and prison occupancy or overcrowding. A country can have a moderate rate but still run a huge prison estate; another can have a very high rate that is driven by a detention surge rather than by long-run sentencing patterns.
FAQ
Why is El Salvador so far above everyone else?
Is prison population rate the same thing as the number of prisoners?
Does the rate include people who have not yet been convicted?
Why are the country dates not perfectly aligned?
Why did you exclude territories and subnational systems?
Can a democratic country still rank very high?
Does a high incarceration rate prove a country is safer?
Full Top 100 ranking and distribution pattern
This block contains all 100 sovereign-country rows directly in the HTML. JavaScript is used only to search, sort and hide or show rows. With JavaScript disabled, the full ranking remains visible and readable.
The rate ranking and the prisoner count tell different stories. By rate, microstates and small countries can climb very high. By prisoner count, the United States, Brazil, Turkey and Russia remain system-shaping giants. Both dimensions matter for comparative justice work.
Table 2. Top 100 sovereign countries by prison population rate
Showing all 100 rows in the source HTML. With JavaScript active, the default view switches to Top 20.
| Rate rank | Country | Rate per 100,000 | Prisoners |
|---|---|---|---|
| 1 | El Salvador | 1,659 | 109,519 |
| 2 | Cuba | 794 | 90,000 |
| 3 | Rwanda | 637 | 89,034 |
| 4 | Turkmenistan | 576 | 35,000 |
| 5 | United States | 541 | 1,808,100 |
| 6 | Panama | 522 | 23,798 |
| 7 | Tonga | 516 | 557 |
| 8 | Uruguay | 449 | 15,767 |
| 9 | Turkey | 424 | 362,422 |
| 10 | Bahamas | 409 | 1,617 |
| 11 | Antigua and Barbuda | 400 | 400 |
| 12 | Seychelles | 393 | 474 |
| 13 | Brazil | 392 | 850,377 |
| 14 | Thailand | 391 | 274,277 |
| 15 | Palau | 367 | 66 |
| 16 | Cape Verde | 366 | 2,100 |
| 17 | St. Vincent and the Grenadines | 353 | 392 |
| 18 | Dominica | 348 | 261 |
| 19 | Belarus | 345 | 32,556 |
| 20 | Nauru | 345 | 38 |
| 21 | Costa Rica | 343 | 17,829 |
| 22 | Grenada | 338 | 385 |
| 23 | Nicaragua | 332 | 20,918 |
| 24 | Namibia | 318 | 8,900 |
| 25 | Maldives | 314 | 1,700 |
| 26 | St. Lucia | 308 | 572 |
| 27 | Chile | 306 | 58,248 |
| 28 | Russia | 300 | 433,006 |
| 29 | St. Kitts and Nevis | 296 | 160 |
| 30 | Belize | 289 | 1,199 |
| 31 | Peru | 285 | 97,605 |
| 32 | Trinidad and Tobago | 276 | 3,802 |
| 33 | Georgia | 275 | 10,523 |
| 34 | Guyana | 271 | 2,156 |
| 35 | Libya | 269 | 19,103 |
| 36 | Morocco | 267 | 102,653 |
| 37 | South Africa | 258 | 157,056 |
| 38 | Barbados | 258 | 743 |
| 39 | Cambodia | 257 | 45,122 |
| 40 | Argentina | 254 | 117,810 |
| 41 | Taiwan | 250 | 58,571 |
| 42 | Fiji | 248 | 2,276 |
| 43 | Azerbaijan | 244 | 24,698 |
| 44 | Eswatini | 243 | 3,405 |
| 45 | Malaysia | 241 | 82,144 |
| 46 | Paraguay | 239 | 17,712 |
| 47 | Moldova | 235 | 5,695 |
| 48 | Bahrain | 234 | 3,485 |
| 49 | Dominican Republic | 231 | 25,987 |
| 50 | Iran | 228 | 189,000 |
| 51 | Gabon | 228 | 5,226 |
| 52 | Algeria | 217 | 94,749 |
| 53 | Israel | 217 | 19,756 |
| 54 | Mauritius | 215 | 2,755 |
| 55 | Bolivia | 209 | 25,291 |
| 56 | Saudi Arabia | 207 | 68,056 |
| 57 | Colombia | 200 | 103,530 |
| 58 | Venezuela | 199 | 67,200 |
| 59 | Tunisia | 196 | 23,484 |
| 60 | Poland | 194 | 70,927 |
| 61 | Hungary | 192 | 18,270 |
| 62 | Honduras | 189 | 19,500 |
| 63 | Brunei | 186 | 841 |
| 64 | Jordan | 185 | 19,140 |
| 65 | Suriname | 185 | 1,000 |
| 66 | Kazakhstan | 184 | 35,228 |
| 67 | Myanmar | 183 | 100,324 |
| 68 | Mongolia | 183 | 5,832 |
| 69 | New Zealand | 181 | 9,638 |
| 70 | Ecuador | 180 | 33,472 |
| 71 | Iraq | 179 | 73,715 |
| 72 | Czech Republic | 179 | 19,649 |
| 73 | Samoa | 179 | 358 |
| 74 | Latvia | 175 | 3,271 |
| 75 | Mexico | 174 | 233,687 |
| 76 | Montenegro | 170 | 1,046 |
| 77 | Albania | 168 | 4,565 |
| 78 | Laos | 166 | 11,885 |
| 79 | Slovakia | 164 | 8,895 |
| 80 | Philippines | 162 | 180,826 |
| 81 | Serbia | 162 | 10,787 |
| 82 | Botswana | 161 | 3,971 |
| 83 | Australia | 157 | 41,929 |
| 84 | Singapore | 156 | 9,536 |
| 85 | Lithuania | 156 | 4,551 |
| 86 | Zimbabwe | 153 | 24,068 |
| 87 | Uganda | 152 | 76,946 |
| 88 | Bhutan | 145 | 1,119 |
| 89 | Tajikistan | 141 | 14,000 |
| 90 | Lebanon | 141 | 9,254 |
| 91 | North Macedonia | 140 | 2,555 |
| 92 | Benin | 138 | 18,170 |
| 93 | Vietnam | 135 | 133,986 |
| 94 | Sri Lanka | 131 | 28,555 |
| 95 | Ukraine | 130 | 44,024 |
| 96 | Estonia | 129 | 1,805 |
| 97 | Sao Tome and Principe | 129 | 300 |
| 98 | Micronesia | 127 | 132 |
| 99 | Romania | 126 | 24,106 |
| 100 | Zambia | 125 | 25,372 |
Source basis: World Prison Brief prison population rate ranking, filtered here to sovereign-country reporting only; latest available country figures used as a 2025 snapshot. Total prisoners shown for context. Sum of prisoner totals across these Top 100 sovereign countries: 6,946,500.
Chart 2. Prison population rate vs. prison population size
The scatter below shows why “high rate” and “large prison system” are not interchangeable. El Salvador is the most extreme sovereign outlier on the rate axis, while the United States and China dominate on the size axis. Countries such as Turkey, Brazil and Thailand sit in the middle zone where both dimensions are large enough to matter internationally.
- United States — 541 per 100,000; 1,808.1 thousand prisoners.
- China — 119 per 100,000; 1,690.0 thousand prisoners.
- Brazil — 392 per 100,000; 850.4 thousand prisoners.
- India — 41 per 100,000; 573.2 thousand prisoners.
- Turkey — 424 per 100,000; 362.4 thousand prisoners.
- Russia — 300 per 100,000; 433.0 thousand prisoners.
- El Salvador — 1,659 per 100,000; 109.5 thousand prisoners.
How to interpret the 2025 prison rate hierarchy
The top of this ranking is not a single story. It mixes very different justice models: aggressive anti-gang or emergency-style detention strategies, historically punitive systems, small states where the rate is highly sensitive to population size, and mid-sized countries where prison expansion has outpaced alternatives to custody. That variety is exactly why prison population rate remains such a useful comparative metric.
One lesson is that incarceration rate and prison scale should never be collapsed into one idea. El Salvador is the sovereign outlier on rate, but the United States remains the dominant sovereign prison system by absolute size. Brazil and Turkey also sit in the zone where both the rate and the raw number are internationally important. By contrast, several island states rank near the top on rate while holding only a few hundred people in custody.
Another lesson is regional. The Americas are heavily overrepresented at the top of the sovereign table, especially Central America and the Caribbean. That points to a justice-policy pattern rather than a random distribution. If a reader is trying to understand penal severity, prison crowding risk, or the political appeal of incarceration-heavy policy, the regional cluster matters as much as the individual country story.
A high prison population rate is best interpreted as a sign of how intensively a state uses incarceration relative to population size. It is not a standalone measure of crime, rule of law, prison safety, rehabilitation quality, or human-rights performance.
The policy reading is therefore comparative rather than simplistic. When rates climb rapidly, the obvious follow-up questions are about pre-trial detention, sentence length, alternatives to custody, prison occupancy and the quality of legal process. Without those additional indicators, a prison-rate leaderboard can tell you where incarceration is heavy, but not whether it is proportionate, effective or sustainable.
Policy takeaways
- Countries at the top of the rate distribution should be examined for detention intensity, sentence inflation and prison-capacity pressure rather than treated as a single homogeneous group.
- Large prison systems with only mid-range rates still matter enormously for global prisoner totals and prison health, staffing and fiscal pressure.
- Small countries need extra caution in interpretation because the rate can move sharply even when the underlying prisoner count changes only modestly.
- Readers should combine this ranking with indicators on pre-trial detention, prison occupancy, deaths in custody, release policy and recidivism before drawing broad policy conclusions.
- For journalism and civil-society monitoring, the most revealing comparison is often between countries with similar crime environments but very different reliance on custody.
Sources
-
World Prison Brief — Highest to Lowest: Prison Population Rate.
Core ranking source for prison population rate by country/system.
https://www.prisonstudies.org/highest-to-lowest/prison_population_rate?field_region_taxonomy_tid=All -
World Prison Brief — Data page.
Gateway to country profiles and methodological context.
https://www.prisonstudies.org/world-prison-brief-data -
Our World in Data — Prison population rate.
Documents the WPB-derived series, definition, last update and processing notes.
https://ourworldindata.org/grapher/prison-population-rate -
Institute for Crime & Justice Policy Research — World Prison Brief project page.
Notes that country information is updated monthly and is largely drawn from governmental or other official sources.
https://www.icpr.org.uk/theme/prisons-and-use-imprisonment/world-prison-brief -
World Prison Population List, 14th edition.
Useful reference publication for global totals and prison-system comparisons.
https://www.prisonstudies.org/resources/world-prison-population-list-14th-edition -
UNODC — Global prison population and trends (2025 brief).
Adds broader context on global prison totals, pre-trial detention and staffing pressure.
https://www.unodc.org/documents/data-and-analysis/prison/Prison_brief_2025.pdf -
UNODC data portal — persons detained in prisons.
Official justice-statistics companion source.
https://dataunodc.un.org/dp-prisons-persons-held