Top 100 Countries by Population Growth Rate, 2025
Top 100 Countries by Population Growth Rate, 2025
Population growth rate is one of the clearest ways to gauge demographic momentum because it combines births, deaths and net migration into one annual percentage. For a 2025 ranking, the latest broadly comparable cross-country year is 2024, so this page uses 2024 values as the best available proxy for 2025.
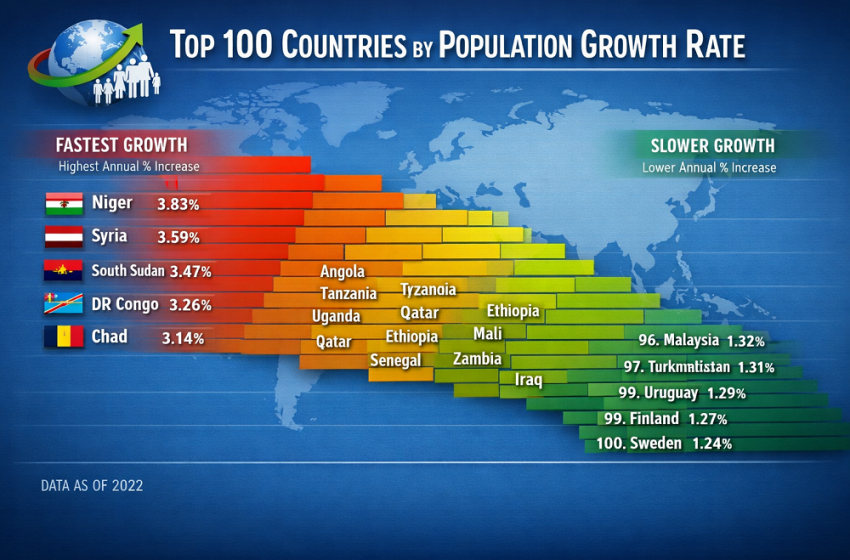
That matters because demographic data do not update on a single global schedule. Public discussions often mix provisional national updates, migration shocks and older UN estimates. A comparable country ranking works best when it starts from one harmonized annual dataset. In the latest comparable view, the world average is about 1.19%, Qatar is the fastest-growing country at 7.32%, and Moldova has the weakest current reading at -2.28%.
The top of the table is split between migration-driven Gulf economies and very young African populations with high natural increase. The lower end of the global ranking tells a different story: aging, low fertility and emigration are already pushing several countries into outright population decline.
Top 10 fastest-growing countries
The top 10 does not represent one single demographic model. Qatar, the United Arab Emirates, Saudi Arabia and Oman rise to the top because net migration can move annual totals quickly in labor-importing economies. Chad, Niger, the Democratic Republic of the Congo and Somalia sit near the top for a different reason: very young populations and high natural increase still drive strong expansion.
Qatar
Qatar is the clearest migration-led outlier in the current ranking. In smaller labor-importing states, annual population growth can swing much faster than fertility alone would allow.
Chad
Chad remains one of the strongest examples of youth-driven demographic expansion. High fertility and a very young age structure keep the annual growth rate elevated.
United Arab Emirates
The United Arab Emirates shows how migration, investment and labor demand can rapidly reshape population totals in high-income urban economies.
Saudi Arabia
Saudi Arabia combines natural increase with sizable labor-market inflows, making it one of the most important large-country growth stories in the current table.
Oman
Oman’s position is another reminder that similar growth rates can reflect very different demographic mechanisms from one country to another.
Syria
Syria’s reading should be handled with caution because conflict, displacement, return flows and revisions can all affect one-year estimates.
Somalia
Somalia remains in the high-growth cluster primarily because of natural increase, which creates long-run labor-force potential but also heavy service pressure.
Central African Republic
The Central African Republic illustrates how fast population growth in low-income settings can be more about infrastructure strain than market depth.
Niger
Niger remains a textbook case of rapid demographic expansion. Even gradual fertility decline still leaves annual growth high because the youth base is so large.
DR Congo
The Democratic Republic of the Congo combines high fertility with continental scale, which gives its long-run population path global significance.
Table 1. Top 10 fastest-growing countries
| Rank | Country | Growth rate | Region |
|---|---|---|---|
| 1 | Qatar | 7.32% | MENA |
| 2 | Chad | 4.95% | Africa |
| 3 | United Arab Emirates | 4.68% | MENA |
| 4 | Saudi Arabia | 4.63% | MENA |
| 5 | Oman | 4.50% | MENA |
| 6 | Syria | 4.47% | MENA |
| 7 | Somalia | 3.48% | Africa |
| 8 | Central African Republic | 3.40% | Africa |
| 9 | Niger | 3.28% | Africa |
| 10 | DR Congo | 3.24% | Africa |
Latest comparable annual values, using 2024 as the working 2025 snapshot.
Chart 1. Top 20 countries by annual population growth
A bar layout works better than a pie or map here because the real story is the gap structure. Qatar stands well above the rest, followed by a compact group of Gulf and African countries. Canada is the main high-income exception in the top 20: migration has pushed it into a range more often associated with much younger populations.
Top 20 values: Qatar 7.32%, Chad 4.95%, United Arab Emirates 4.68%, Saudi Arabia 4.63%, Oman 4.50%, Syria 4.47%, Somalia 3.48%, Central African Republic 3.40%, Niger 3.28%, DR Congo 3.24%, Angola 3.04%, Yemen 2.98%, Canada 2.96%, Mali 2.94%, Mozambique 2.92%, Mauritania 2.88%, Malta 2.87%, Tanzania 2.87%, Afghanistan 2.84%, Zambia 2.81%.
Full ranking: Top 100 countries by population growth rate
The ranking below can be filtered, sorted and narrowed to Top 10, Top 20 or All 100. The controls only change the current view of the existing country rows.
| Rank | Country | Growth rate | Region |
|---|---|---|---|
| 1 | Qatar | 7.32% | MENA |
| 2 | Chad | 4.95% | Africa |
| 3 | United Arab Emirates | 4.68% | MENA |
| 4 | Saudi Arabia | 4.63% | MENA |
| 5 | Oman | 4.50% | MENA |
| 6 | Syria | 4.47% | MENA |
| 7 | Somalia | 3.48% | Africa |
| 8 | Central African Republic | 3.40% | Africa |
| 9 | Niger | 3.28% | Africa |
| 10 | DR Congo | 3.24% | Africa |
| 11 | Angola | 3.04% | Africa |
| 12 | Yemen | 2.98% | MENA |
| 13 | Canada | 2.96% | Americas |
| 14 | Mali | 2.94% | Africa |
| 15 | Mozambique | 2.92% | Africa |
| 16 | Mauritania | 2.88% | Africa |
| 17 | Malta | 2.87% | Europe |
| 18 | Tanzania | 2.87% | Africa |
| 19 | Afghanistan | 2.84% | Asia |
| 20 | Zambia | 2.81% | Africa |
| 21 | Uganda | 2.75% | Africa |
| 22 | Cameroon | 2.61% | Africa |
| 23 | Burundi | 2.58% | Africa |
| 24 | Ethiopia | 2.58% | Africa |
| 25 | Malawi | 2.58% | Africa |
| 26 | Benin | 2.46% | Africa |
| 27 | Ivory Coast | 2.44% | Africa |
| 28 | Madagascar | 2.44% | Africa |
| 29 | Equatorial Guinea | 2.40% | Africa |
| 30 | Guinea | 2.40% | Africa |
| 31 | Republic of the Congo | 2.40% | Africa |
| 32 | Solomon Islands | 2.37% | Oceania |
| 33 | Palestine | 2.36% | MENA |
| 34 | Senegal | 2.32% | Africa |
| 35 | Armenia | 2.31% | Asia |
| 36 | Gambia | 2.28% | Africa |
| 37 | Vanuatu | 2.27% | Oceania |
| 38 | Burkina Faso | 2.25% | Africa |
| 39 | Namibia | 2.24% | Africa |
| 40 | Togo | 2.24% | Africa |
| 41 | Gibraltar | 2.21% | Europe |
| 42 | Guinea-Bissau | 2.21% | Africa |
| 43 | Gabon | 2.16% | Africa |
| 44 | Liberia | 2.16% | Africa |
| 45 | Rwanda | 2.14% | Africa |
| 46 | Iraq | 2.12% | MENA |
| 47 | Sierra Leone | 2.12% | Africa |
| 48 | Nigeria | 2.08% | Africa |
| 49 | Sao Tome and Principe | 2.00% | Africa |
| 50 | Australia | 1.99% | Oceania |
| 51 | Singapore | 1.99% | Asia |
| 52 | Uzbekistan | 1.97% | Asia |
| 53 | Kenya | 1.96% | Africa |
| 54 | Tajikistan | 1.92% | Asia |
| 55 | Comoros | 1.89% | Africa |
| 56 | Ghana | 1.88% | Africa |
| 57 | Eritrea | 1.86% | Africa |
| 58 | Papua New Guinea | 1.78% | Oceania |
| 59 | Zimbabwe | 1.78% | Africa |
| 60 | Turkmenistan | 1.75% | Asia |
| 61 | Egypt | 1.73% | MENA |
| 62 | Kyrgyzstan | 1.71% | Asia |
| 63 | Honduras | 1.68% | Americas |
| 64 | New Zealand | 1.67% | Oceania |
| 65 | Botswana | 1.64% | Africa |
| 66 | Luxembourg | 1.58% | Europe |
| 67 | Ireland | 1.57% | Europe |
| 68 | Guatemala | 1.54% | Americas |
| 69 | Pakistan | 1.51% | Asia |
| 70 | Liechtenstein | 1.50% | Europe |
| 71 | Kiribati | 1.49% | Oceania |
| 72 | Belize | 1.44% | Americas |
| 73 | Algeria | 1.40% | MENA |
| 74 | Bolivia | 1.37% | Americas |
| 75 | Djibouti | 1.36% | Africa |
| 76 | Laos | 1.36% | Asia |
| 77 | Nicaragua | 1.35% | Americas |
| 78 | Andorra | 1.33% | Europe |
| 79 | Seychelles | 1.31% | Africa |
| 80 | Switzerland | 1.31% | Europe |
| 81 | Kazakhstan | 1.28% | Asia |
| 82 | Israel | 1.27% | MENA |
| 83 | Panama | 1.27% | Americas |
| 84 | Mongolia | 1.25% | Asia |
| 85 | South Africa | 1.25% | Africa |
| 86 | Cambodia | 1.23% | Asia |
| 87 | Paraguay | 1.23% | Americas |
| 88 | Malaysia | 1.22% | Asia |
| 89 | Bangladesh | 1.21% | Asia |
| 90 | Macao | 1.20% | Asia |
| 91 | Haiti | 1.15% | Americas |
| 92 | Lesotho | 1.12% | Africa |
| 93 | Portugal | 1.10% | Europe |
| 94 | Peru | 1.09% | Americas |
| 95 | Colombia | 1.07% | Americas |
| 96 | United Kingdom | 1.07% | Europe |
| 97 | Iran | 1.05% | MENA |
| 98 | Libya | 1.03% | MENA |
| 99 | Spain | 1.02% | Europe |
| 100 | Eswatini | 1.00% | Africa |
Source basis: latest comparable 2024 international annual population-growth data, used here as the working 2025 reference year.
Countries with the weakest current rates
The lower end of the global distribution is just as important as the fastest-growing group. In several European countries and a few small states, the demographic cycle has already turned negative. That tends to show up later in school enrollment, labor availability, housing turnover, military-age cohorts and pension-system stress.
| Rank from bottom | Country | Growth rate | Region |
|---|---|---|---|
| 1 | Moldova | -2.28% | Europe |
| 2 | Tuvalu | -1.75% | Oceania |
| 3 | Albania | -1.54% | Europe |
| 4 | Latvia | -0.94% | Europe |
| 5 | Monaco | -0.84% | Europe |
| 6 | Saint Vincent and the Grenadines | -0.70% | Americas |
| 7 | Bosnia and Herzegovina | -0.66% | Europe |
| 8 | Japan | -0.56% | Asia |
| 9 | Belarus | -0.55% | Europe |
| 10 | Greece | -0.50% | Europe |
Methodology
This article uses the World Bank indicator SP.POP.GROW, which is defined in the metadata as population growth derived from total population. The World Bank states that the population source is the United Nations Population Division, national statistical offices, Eurostat and the United Nations Statistics Division. Because a full global 2025 annual ranking is not yet closed across all countries, the latest comparable broad year is 2024, which is used here as a clear 2025 proxy.
The ordering on this page follows the latest comparable cross-country ranking for the indicator, which reports a 2024 world average of 1.19%, Qatar at 7.32% and Moldova at -2.28%. Values are shown as annual percentages and rounded to two decimals. Region labels are editorial tags added for filtering and page usability only.
The biggest limitation is interpretation. One-year population growth can reflect very different underlying realities. In the Gulf, migration can dominate the annual change. In many African countries, natural increase still drives the result. In fragile states, conflict, displacement, return flows and estimation revisions can affect the latest reading. That is why population growth is best read alongside fertility, median age, dependency ratios and net migration.
Practical rule: a high growth rate is not automatically “good,” and a low or negative rate is not automatically “bad.” The economic meaning depends on jobs, productivity, housing supply, age structure and the balance between natural increase and migration.
Insights and interpretation
The first big pattern is concentration. The fastest current growth rates are concentrated in migration-led Gulf economies and in younger African countries where natural increase remains high. That means the same headline number can imply very different policy priorities.
The second pattern is demographic divergence. Large parts of Africa are still in a strong expansion phase, while several European countries and parts of East Asia are already shrinking. The world is no longer moving through one shared demographic cycle.
The third pattern is the growing role of migration. Canada’s position inside the top 20 is the clearest reminder that migration policy can push a mature high-income economy far above its traditional demographic profile in a short period.
The fourth pattern is scale versus speed. A small country can post a very high percentage change, but a giant country with a modest rate can still add more people in absolute terms. That is why annual percentage rankings should always be read alongside total population size.
The fifth pattern is structural strain at both ends. Very fast growth can overwhelm schools, transport, health systems and housing if investment lags. Negative growth can undermine tax bases, labor supply, regional balance and pension sustainability. Demographic pressure looks different at the top and bottom of the ranking, but both matter.
What it means in practice: if you track countries for migration, real estate, consumer demand, labor markets or long-run economic potential, population growth is one of the simplest early signals to watch. It does not tell the whole story, but it quickly shows where demand, workforce pressure or aging risk is likely to build next.
FAQ
Why is Qatar first by such a large margin?
Because this indicator reflects total population change, not only births and deaths. In smaller labor-importing states, migration can push annual growth far above what natural increase alone would produce.
Does fast population growth automatically mean a strong economy?
No. It can mean a larger future labor force and consumer market, but it can also create major pressure on housing, schools, transport and food systems if productivity and infrastructure do not keep up.
Why is Canada so high in the ranking?
Canada is the standout high-income migration case. Its recent population growth has been lifted by strong inflows, which makes it very different from most mature developed economies.
Is population growth rate the same as fertility rate?
No. Fertility tracks births per woman. Population growth rate is broader and captures fertility, mortality and migration together as the annual percentage change in total population.
Why use 2024 for a 2025 ranking?
Because 2024 is the latest broadly comparable annual year currently visible across the global dataset. Using it openly as a 2025 proxy is more honest than presenting a fully closed 2025 world ranking before that data cycle is complete.
Why do some European countries already have negative growth?
Usually because low fertility, aging and outward migration or weak net inflows combine to push total population lower year by year.
Which indicators should be read together with population growth?
Median age, fertility rate, dependency ratio, net migration, urbanization and employment growth. Together they show whether demographic momentum is likely to become an advantage, a fiscal burden or a mixed outcome.
Sources
- World Bank — Population growth (annual %), indicator SP.POP.GROW.
Definition and metadata for the core indicator.
https://data.worldbank.org/indicator/SP.POP.GROW - World Bank metadata PDF for SP.POP.GROW.
Technical note stating that the series is derived from total population and uses UN Population Division, national statistical offices, Eurostat and the UN Statistics Division.
https://data360files.worldbank.org/data360-data/metadata/WB_WDI/WB_WDI_SP_POP_GROW.pdf - United Nations — World Population Prospects 2024.
Main international demographic benchmark for cross-country estimates and projections.
https://population.un.org/wpp/ - TheGlobalEconomy — Population growth by country, around the world.
Country ranking view used for the latest 2024 ordering; reports world average, top and bottom readings and cites the United Nations Population Division as the source.
https://www.theglobaleconomy.com/rankings/population_growth/
Values and ordering follow the sources listed above.