

Nuclear Power Capacity Under Construction by Country: IAEA 2025 Edition
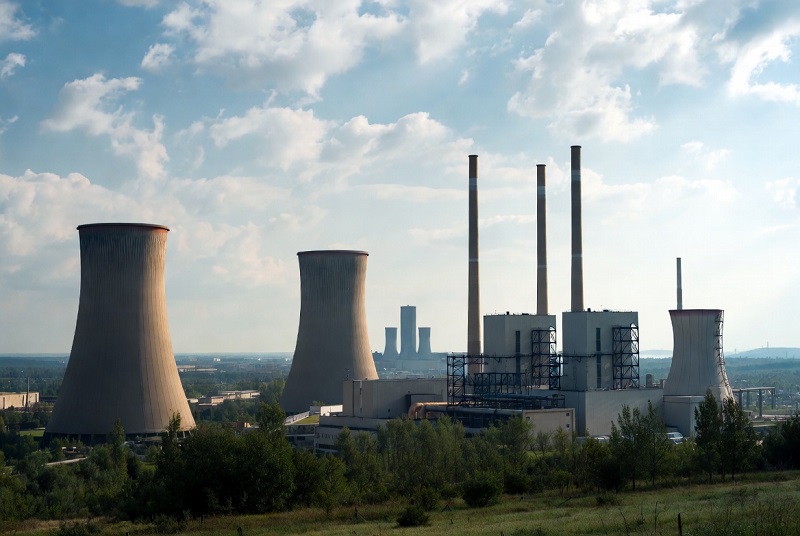
Nuclear power capacity under construction by country
China had the world's largest nuclear construction pipeline in the IAEA's 2025 edition of Nuclear Power Reactors in the World, with 29,638 MW(e) of net electrical capacity under construction. India ranked second with 5,398 MW(e), followed by Türkiye at 4,456 MW(e) and Egypt at 4,400 MW(e).
The publication reports reactor status at 31 December 2024. At that date, 62 reactors were under construction across 15 countries, representing 64,461 MW(e) of net electrical capacity. The ranking therefore uses the complete official year-end dataset published by the IAEA in its 2025 edition rather than later changes in the live PRIS database.
The metric is net electrical capacity of reactors under construction, measured in MW(e). Higher capacity ranks higher. All 15 rows are official IAEA values; there are no forecast or modeled projection rows.
28 reactors and about 46.0% of the global capacity reported in the IAEA table.
One reactor was classified as under construction at the reference date.
Every country with a positive under-construction value in IAEA Table 3 is included.
IAEA RDS-2/45 · 31 Dec 2024 · 15 official values · no forecasts or modeled projections.
What this ranking measures
The ranking compares the total net electrical capacity of nuclear power reactors classified by the IAEA as under construction in each country. Country totals come directly from Table 3 of the 2025 edition of Nuclear Power Reactors in the World.
In PRIS, construction begins with the first major placement of concrete, usually for the reactor building base mat. First grid connection occurs later and marks the transition from construction to operation in the IAEA database.
Planned reactors and policy targets are not included. A project must have reached the formal construction-start milestone to appear in this dataset.
Capacity and reactor count are not interchangeable. This ranking is based on MW(e), so countries building fewer high-capacity reactors can rank above countries with a larger number of smaller units.
Top 10 countries by nuclear capacity under construction
China's 29,638 MW(e) construction pipeline was more than five times India's second-place total. The gap was much narrower among the next countries: Türkiye, Egypt and Russia each had between 3,850 and 4,456 MW(e) under construction.
Top 10 countries by net nuclear capacity under construction, 31 December 2024
| Rank | Entity | Value | Region / Note |
|---|---|---|---|
| 1 | China | 29,638 MW(e) | Asia · official value · IAEA RDS-2/45 · 31 Dec 2024 · 28 reactors. |
| 2 | India | 5,398 MW(e) | Asia · official value · IAEA RDS-2/45 · 31 Dec 2024 · 7 reactors. |
| 3 | Türkiye | 4,456 MW(e) | Europe · official value · IAEA RDS-2/45 · 31 Dec 2024 · 4 reactors. |
| 4 | Egypt | 4,400 MW(e) | Africa · official value · IAEA RDS-2/45 · 31 Dec 2024 · 4 reactors. |
| 5 | Russia | 3,850 MW(e) | Europe · official value · IAEA RDS-2/45 · 31 Dec 2024 · 4 reactors. |
| 6 | United Kingdom | 3,260 MW(e) | Europe · official value · IAEA RDS-2/45 · 31 Dec 2024 · 2 reactors. |
| 7 | Korea, Republic of | 2,680 MW(e) | Asia · official value · IAEA RDS-2/45 · 31 Dec 2024 · 2 reactors. |
| 8 | Japan | 2,653 MW(e) | Asia · official value · IAEA RDS-2/45 · 31 Dec 2024 · 2 reactors. |
| 9 | Bangladesh | 2,160 MW(e) | Asia · official value · IAEA RDS-2/45 · 31 Dec 2024 · 2 reactors. |
| 10 | Ukraine | 2,070 MW(e) | Europe · official value · IAEA RDS-2/45 · 31 Dec 2024 · 2 reactors. |
Countries are ranked by total net electrical capacity in MW(e), descending. Values are used exactly as published by the IAEA.
Chart: Top 15 confirmed entries
China's lead dominates the distribution: its capacity under construction exceeded the combined total of India, Türkiye, Egypt, Russia and the United Kingdom.
Methodology
Metric and unit
The metric is total net electrical capacity of nuclear reactors under construction, measured in MW(e). Net capacity is the electrical output available after a plant's own auxiliary consumption.
Reference date
The 2025 edition of IAEA Reference Data Series No. 2 reports the construction status of reactors at 31 December 2024.
Ranking rule
Countries are sorted from highest to lowest total net electrical capacity under construction. All 15 country totals are different, so no tie-break rule is required.
Coverage
All 15 countries listed with reactors under construction in IAEA Table 3 are included. Countries with no reactors in this category are not ranked.
Construction status
PRIS records construction start at the first major placement of concrete, usually for the reactor building base mat. First grid connection is a later milestone. Once a unit first connects to the electrical grid, it is no longer counted by PRIS as under construction.
Source priority
IAEA Reference Data Series No. 2/45 is the controlling source for every capacity value, reactor count and rank on this page. The live PRIS database is cited for definitions and current database context, but later updates are not substituted into the published year-end table.
Data treatment and assumptions
Country values are used as published. Missing values are not estimated, and later revisions are not averaged with the reference-date figures. The ranking formula is descending country MW(e). Percentage shares are calculated as country capacity divided by the global total of 64,461 MW(e), multiplied by 100.
The IAEA's year-end classifications and net capacity values are accepted without adjustment. No completion weighting, gross-to-net conversion, probability estimate, commissioning forecast or modeled projection is applied.
What the metric does not show
The ranking does not measure construction progress, project cost, scheduled completion, commissioning dates, reactor count alone, operating nuclear capacity, electricity generation or the probability that each reactor will ultimately enter commercial operation.
Full ranking: all 15 countries
The table includes every country with nuclear generating capacity classified as under construction in the IAEA's reference-date dataset.
Official IAEA net electrical capacity under construction, 31 December 2024
| Rank | Entity | Value | Region / Note |
|---|---|---|---|
| 1 | China | 29,638 MW(e) | Asia · official value · IAEA RDS-2/45 · 31 Dec 2024 · 28 reactors. |
| 2 | India | 5,398 MW(e) | Asia · official value · IAEA RDS-2/45 · 31 Dec 2024 · 7 reactors. |
| 3 | Türkiye | 4,456 MW(e) | Europe · official value · IAEA RDS-2/45 · 31 Dec 2024 · 4 reactors. |
| 4 | Egypt | 4,400 MW(e) | Africa · official value · IAEA RDS-2/45 · 31 Dec 2024 · 4 reactors. |
| 5 | Russia | 3,850 MW(e) | Europe · official value · IAEA RDS-2/45 · 31 Dec 2024 · 4 reactors. |
| 6 | United Kingdom | 3,260 MW(e) | Europe · official value · IAEA RDS-2/45 · 31 Dec 2024 · 2 reactors. |
| 7 | Korea, Republic of | 2,680 MW(e) | Asia · official value · IAEA RDS-2/45 · 31 Dec 2024 · 2 reactors. |
| 8 | Japan | 2,653 MW(e) | Asia · official value · IAEA RDS-2/45 · 31 Dec 2024 · 2 reactors. |
| 9 | Bangladesh | 2,160 MW(e) | Asia · official value · IAEA RDS-2/45 · 31 Dec 2024 · 2 reactors. |
| 10 | Ukraine | 2,070 MW(e) | Europe · official value · IAEA RDS-2/45 · 31 Dec 2024 · 2 reactors. |
| 11 | Brazil | 1,340 MW(e) | South America · official value · IAEA RDS-2/45 · 31 Dec 2024 · 1 reactor. |
| 12 | Pakistan | 1,117 MW(e) | Asia · official value · IAEA RDS-2/45 · 31 Dec 2024 · 1 reactor. |
| 13 | Iran | 974 MW(e) | Asia · official value · IAEA RDS-2/45 · 31 Dec 2024 · 1 reactor. |
| 14 | Slovakia | 440 MW(e) | Europe · official value · IAEA RDS-2/45 · 31 Dec 2024 · 1 reactor. |
| 15 | Argentina | 25 MW(e) | South America · official value · IAEA RDS-2/45 · 31 Dec 2024 · 1 reactor. |
The 15 country values sum to the official IAEA total of 64,461 MW(e) across 62 reactors. Geographic labels are used only for filtering and do not affect country values or ranks.
What stands out in the ranking
China accounts for 46% of global construction capacity
China's 29,638 MW(e) represented about 46.0% of the global total. No other country exceeded 5,400 MW(e).
Four countries form the next capacity tier
India, Türkiye, Egypt and Russia each had between 3,850 and 5,398 MW(e) under construction, creating a much tighter group below China.
Asian countries account for about two-thirds
China, India, Korea, Japan, Bangladesh and Pakistan together accounted for 43,646 MW(e), equivalent to about 67.7% of the global total.
Argentina has the smallest positive total
Argentina recorded 25 MW(e), compared with more than 29 GW(e) in China. The large difference shows how widely national construction programmes vary in scale.
How to interpret the ranking
A high position means that a country had a large amount of net nuclear generating capacity in the physical construction stage at the reference date. It does not indicate how close those reactors were to completion.
Countries with similar capacity totals can also have different project structures. Some programmes contain several large reactors, while others rely on fewer units. Capacity should therefore be considered alongside the reactor count shown in the table notes.
The figures represent one official year-end snapshot. Reactor status changes when new construction starts, units connect to the grid or technical data are revised, so current PRIS figures can differ from the values published in the IAEA's 2025 edition.
FAQ
Which country had the most nuclear capacity under construction in the IAEA's 2025 edition?
China ranked first with 29,638 MW(e) across 28 reactors. That represented about 46% of the global capacity in the table.
Why does the IAEA 2025 edition use a 31 December 2024 reference date?
The annual publication summarizes the complete reactor status reported for the end of the preceding calendar year. The publication year and the underlying reference date are therefore different.
How many reactors were under construction worldwide?
The IAEA table contains 62 reactors in 15 countries with a combined net electrical capacity of 64,461 MW(e).
What does the IAEA mean by construction start?
PRIS uses the first major placement of concrete, usually for the reactor building base mat, as the construction-start date.
Does under construction mean a reactor was being commissioned?
No. Construction begins before later milestones such as first criticality, first grid connection and commercial operation.
Are planned nuclear reactors included?
No. Projects that had not reached the IAEA construction-start milestone at the reference date are outside this ranking.
Why can current PRIS values be different?
PRIS is updated as reactor status and technical information change. This ranking preserves the values published for 31 December 2024 so that every country is compared at the same point in time.
Sources
IAEA — Nuclear Power Reactors in the World, 2025 Edition
Primary source for the ranking. Table 3 provides country reactor counts and net electrical capacity under construction at 31 December 2024.
https://www.iaea.org/publications/15943/nuclear-power-reactors-in-the-world
IAEA Reference Data Series No. 2/45
Full 2025 publication containing the country tables, reactor-level records and definitions used for this ranking.
https://www-pub.iaea.org/MTCD/Publications/PDF/RDS-2-45_web.pdf
IAEA Power Reactor Information System
Official international reactor database maintained by the IAEA and used for reactor status definitions and database context.
PRIS — Reactors Under Construction by Country
Current country-level view of reactors under construction. It is useful for later status checks but does not replace the historical reference-date values used here.
https://pris.iaea.org/PRIS/WorldStatistics/UnderConstructionReactorsByCountry.aspx
