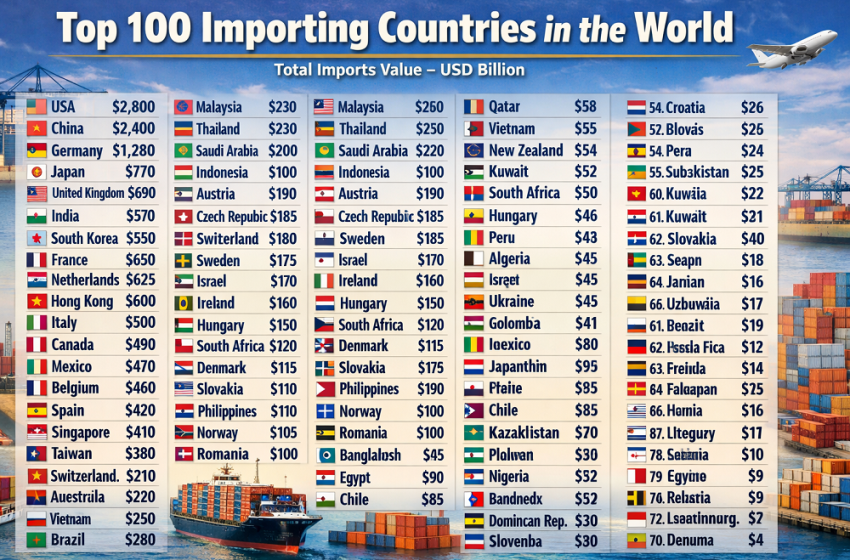
Top 100 Importing Countries in the World, 2025
Where global import demand is concentrated in 2025
This ranking uses the latest full-year 2024 imports of goods and services in current US dollars as the best cross-country proxy for the 2025 ranking. On that basis, the world total stood at about $31.28 trillion, and the gap between the first three positions remains unusually wide: the United States led with $4.10 trillion, followed by China at $3.22 trillion and Germany at $1.76 trillion.
That headline matters because import totals capture different economic realities at once. In the United States, a very large import bill reflects the depth of household consumption and business demand. In Germany, the Netherlands and Belgium, it also reflects dense cross-border manufacturing and distribution inside Europe. In Japan and India, energy and capital-goods demand remain central. In Singapore and Hong Kong, gross flows are amplified by hub functions, re-exports and regional logistics.
What stands out in the 2025 import map
The top of the ranking is not a simple list of countries that “buy the most.” It is a mix of different import models. The United States dominates because of its scale as a consumer and investment market. China stays near the top because it is both a huge domestic buyer and a manufacturing system that pulls in components, commodities and premium inputs. Germany, the Netherlands and Belgium sit high because European production is deeply cross-border. Singapore and Hong Kong show what happens when port, finance, refining and logistics functions are concentrated in small but highly connected economies.
The second major pattern is that import growth is spreading beyond the traditional core. India’s position in the top seven is not only about population. It reflects a bigger appetite for fuel, electronics, machinery, transport equipment and business services as industrial capacity expands. Vietnam’s rise into the top twenty points in the same direction: countries that are still moving up the manufacturing chain often import more before they become much richer, because factories need components, capital equipment and external services long before the income story is fully visible in GDP per capita.
Top 10 importing countries in 2025
United States
Imports in 2024: $4,103.1 bn
Share of world total: 13.12% · YoY: +6.6% · Region: Americas
The United States is still in a category of its own. Its import bill is driven not by one trade story, but by several at once: consumer demand, capital spending, pharmaceuticals, vehicles, electronics, industrial supplies, energy flows and a large market for services purchased from abroad.
China
Imports in 2024: $3,219.3 bn
Share of world total: 10.29% · YoY: +3.6% · Region: Asia
China remains a giant importer because factory demand and domestic demand reinforce each other. The country buys large volumes of energy, metals, agricultural inputs, industrial components, advanced machinery and branded consumer goods while also supplying the world with finished products.
Germany
Imports in 2024: $1,764.4 bn
Share of world total: 5.64% · YoY: −0.8% · Region: Europe
Germany’s rank reflects its role as Europe’s industrial crossroads. A large share of imports consists of intermediate goods, machinery, chemicals, transport equipment and energy inputs that move through manufacturing chains rather than straight into household consumption.
United Kingdom
Imports in 2024: $1,174.2 bn
Share of world total: 3.75% · YoY: +3.8% · Region: Europe
The UK combines strong household demand, energy needs, pharmaceuticals, vehicles, business services and dense sourcing links with Europe, North America and Asia. Its import bill is large because it is both a consumption market and a service-heavy advanced economy.
France
Imports in 2024: $1,081.5 bn
Share of world total: 3.46% · YoY: −2.2% · Region: Europe
France stays in the top tier because of its large domestic market, broad industrial base, transport equipment, chemicals, consumer demand and energy-related flows. The modest year-on-year decline does not change its position as one of the world’s core import markets.
Japan
Imports in 2024: $952.0 bn
Share of world total: 3.04% · YoY: −3.0% · Region: Asia
Japan’s import bill is shaped by fuel dependence, food imports, technology inputs and advanced manufactures required by a mature industrial system. That makes Japan a large importer even in years when real demand is not especially strong.
India
Imports in 2024: $918.3 bn
Share of world total: 2.94% · YoY: +7.2% · Region: Asia
India has moved firmly into the top seven because industrial upgrading is now visible in the trade data. Faster imports of energy, electronics, machinery, transport equipment and business services typically appear when a very large economy is scaling factories, infrastructure and urban demand at the same time.
Netherlands
Imports in 2024: $867.5 bn
Share of world total: 2.77% · YoY: −1.5% · Region: Europe
The Dutch total is best read as a gateway figure, not a pure domestic-demand figure. Rotterdam, inland distribution, refining and re-export activity lift gross imports well above what population size alone would imply.
Singapore
Imports in 2024: $786.0 bn
Share of world total: 2.51% · YoY: +7.9% · Region: Asia
Singapore’s ranking reflects a concentrated mix of electronics, energy products, petrochemicals, finance-linked trade and regional logistics. Like the Netherlands, it is a trade-hub economy whose gross flows serve a market much larger than its resident population.
South Korea
Imports in 2024: $755.5 bn
Share of world total: 2.42% · YoY: +0.0% · Region: Asia
South Korea’s import demand is anchored in semiconductors, energy, industrial inputs and consumer demand inside one of the world’s most trade-intensive advanced economies. Its flat annual change masks a still very large structural role in regional supply chains.
Table 1. Top 10 by total imports
| Rank | Country | Imports, 2024 | YoY |
|---|---|---|---|
| 1 | United States | $4,103.1 bn | +6.6% |
| 2 | China | $3,219.3 bn | +3.6% |
| 3 | Germany | $1,764.4 bn | −0.8% |
| 4 | United Kingdom | $1,174.2 bn | +3.8% |
| 5 | France | $1,081.5 bn | −2.2% |
| 6 | Japan | $952.0 bn | −3.0% |
| 7 | India | $918.3 bn | +7.2% |
| 8 | Netherlands | $867.5 bn | −1.5% |
| 9 | Singapore | $786.0 bn | +7.9% |
| 10 | South Korea | $755.5 bn | +0.0% |
Chart 1. Top 20 importing countries by value
Methodology
This ranking is built from the World Bank indicator “Imports of goods and services (current US$)”. The latest broadly completed reporting year in that series is 2024, and that year is used here as the 2025 proxy because it gives a full annual baseline across countries instead of mixing incomplete monthly customs releases with modelled estimates. Year-on-year growth compares 2024 with 2023 in the same source series.
This article uses the broader national-accounts measure instead of merchandise-only customs data. That choice matters. A goods-only ranking tells a narrower story about physical trade in products. The World Bank series captures both goods and services purchased from abroad, which is closer to how many readers interpret the question “which countries import the most?” WTO merchandise tables for 2024 were used as a top-end cross-check, while UNCTAD trade reporting was used for global context.
The limitations are straightforward. First, current-dollar rankings move with prices and exchange rates as well as with real trade volumes. Second, gateway economies such as the Netherlands, Singapore and Hong Kong can appear exceptionally large because gross flows include refining, storage, redistribution and re-export activity. Third, a large import bill is not a weakness by itself. In some countries it signals rich consumers, in others energy dependence, and in others industrial depth or a logistics role inside a larger regional market.
Insights and conclusions
The import hierarchy is more concentrated than many readers expect. When half of world imports sit inside ten countries, the trade cycle is heavily influenced by a small set of demand centers. That is why US retail demand, Chinese industrial restocking, German factory orders, Japanese fuel purchases and Indian infrastructure demand all matter far beyond their borders. A change in only one of those markets can be enough to move container flows, inventories, commodity pricing and supplier decisions elsewhere.
Europe’s strong representation in the Top 100 is also easy to misread. It does not simply mean Europeans buy a lot of finished goods. In many cases it reflects intermediate trade inside production networks. Germany imports to manufacture. The Netherlands imports to distribute. Belgium and Poland sit inside the same regional system, where parts, chemicals, machinery and energy cross borders several times before reaching the final buyer. The ranking therefore captures industrial architecture as much as household demand.
The most dynamic part of the table sits in Asia and selected middle-income economies. India’s rise into the top seven and Vietnam’s strong annual increase matter because they usually signal investment and capacity-building, not just stronger consumer spending. When countries import more machinery, electronics, transport equipment, industrial components and external services, they are often expanding production capability as well as current demand. That is one reason import growth can sometimes be a forward-looking indicator of industrial change.
What this means for the reader
For exporters and B2B suppliers, the ranking is most useful when it is read as a map of where demand is deep enough to support repeated orders. The biggest importers are usually either giant consumer markets, economies that absorb large volumes of intermediate goods, or trade gateways that serve wider regions. Those are different opportunities. Selling branded consumer goods into the United States is not the same playbook as selling industrial components into Germany or logistics-linked products into Singapore.
For investors and operators in logistics, warehousing, ports, customs software and freight services, the table highlights where trade infrastructure matters most. Very large import markets tend to reward reliability: inland transport, port handling, customs speed, storage capacity and digital documentation become decisive when volumes are high and supply chains are complex.
For ordinary readers, the ranking is a reminder that a big import bill is not automatically a “trade problem.” Rich countries import heavily because they can afford to. Industrial countries import heavily because production needs inputs. Energy-importing countries can see their totals jump when fuel prices rise even if physical volumes barely move. The useful question is not whether imports are large, but what they are buying and what that demand is doing for the economy underneath.
FAQ
Why is the United States still number one?
The United States combines the world’s deepest consumer market with heavy business demand for capital goods, pharmaceuticals, vehicles, electronics, energy products and imported services. That scale keeps its import bill well ahead of every other country.
Why are the Netherlands and Singapore so high for their size?
Both economies function as major trade gateways. Rotterdam and Singapore handle refining, storage, redistribution and re-export flows for much larger regional markets, so gross imports are far bigger than domestic household demand alone.
Does a large import bill mean an economy is weak?
No. A large import bill often reflects market size, industrial complexity, high incomes or a central place in supply chains. The more useful question is what the country is importing and whether those imports support production, consumption or energy security.
Why use 2024 data for a 2025 ranking?
Because 2024 is the latest completed year with broad cross-country coverage in the World Bank series. Using one fully reported year is more comparable than mixing partial 2025 customs releases with annual national accounts data.
Are these goods only?
No. This ranking uses the World Bank measure for imports of goods and services in current US dollars. WTO merchandise statistics were used only as a cross-check for the leading positions at the top of the list.
Why is India already in the global top seven?
India’s import bill reflects a combination of scale, industrial upgrading and energy demand. A very large economy that is still building manufacturing capacity imports more fuel, electronics, machinery, components and business services even while exports are expanding.
What is the best way to compare countries of very different size?
Total imports are best for measuring market size. For intensity comparisons, analysts usually look at imports per person, imports as a share of GDP, or the split between consumer goods, capital goods, energy and intermediate inputs.
Full Top 100 importing countries table
The table starts in Top 20 mode for easier reading, but all 100 countries are already embedded below. You can search, sort, filter by region or income group, and switch the value display from nominal dollars to share of the world total.
World total (2024): $31.28 trillion. Coverage in this table: Top 100 countries account for 94.5% of the world total in the source series.
| Rank | Country | Value | YoY |
|---|---|---|---|
| 1 | United States | $4,103.1 bn 13.12% | +6.6% |
| 2 | China | $3,219.3 bn 10.29% | +3.6% |
| 3 | Germany | $1,764.4 bn 5.64% | −0.8% |
| 4 | United Kingdom | $1,174.2 bn 3.75% | +3.8% |
| 5 | France | $1,081.5 bn 3.46% | −2.2% |
| 6 | Japan | $952.0 bn 3.04% | −3.0% |
| 7 | India | $918.3 bn 2.94% | +7.2% |
| 8 | Netherlands | $867.5 bn 2.77% | −1.5% |
| 9 | Singapore | $786.0 bn 2.51% | +7.9% |
| 10 | South Korea | $755.5 bn 2.42% | +0.0% |
| 11 | Canada | $733.8 bn 2.35% | +1.4% |
| 12 | Hong Kong | $723.1 bn 2.31% | +7.7% |
| 13 | Italy | $721.8 bn 2.31% | −1.9% |
| 14 | Mexico | $703.3 bn 2.25% | +4.3% |
| 15 | Ireland | $622.5 bn 1.99% | +6.4% |
| 16 | Switzerland | $580.1 bn 1.85% | +4.6% |
| 17 | Spain | $567.6 bn 1.81% | +3.1% |
| 18 | Belgium | $534.8 bn 1.71% | −1.2% |
| 19 | Poland | $442.2 bn 1.41% | +4.4% |
| 20 | Vietnam | $398.8 bn 1.27% | +17.3% |
| 21 | Australia | $395.7 bn 1.27% | +2.1% |
| 22 | Brazil | $385.7 bn 1.23% | +12.1% |
| 23 | Russia | $382.4 bn 1.22% | +0.6% |
| 24 | Turkey | $367.4 bn 1.17% | −4.7% |
| 25 | Thailand | $351.2 bn 1.12% | +7.4% |
| 26 | Saudi Arabia | $317.0 bn 1.01% | +8.7% |
| 27 | Sweden | $311.4 bn 1.00% | +2.6% |
| 28 | Indonesia | $284.7 bn 0.91% | +6.0% |
| 29 | Austria | $284.2 bn 0.91% | −2.9% |
| 30 | Malaysia | $278.8 bn 0.89% | +9.1% |
| 31 | Denmark | $258.0 bn 0.82% | +5.7% |
| 32 | Czechia | $217.3 bn 0.69% | −0.8% |
| 33 | Philippines | $185.2 bn 0.59% | +3.9% |
| 34 | Norway | $163.8 bn 0.52% | +4.5% |
| 35 | Romania | $159.2 bn 0.51% | +3.7% |
| 36 | Hungary | $158.4 bn 0.51% | −3.7% |
| 37 | Luxembourg | $149.0 bn 0.48% | −9.4% |
| 38 | Israel | $140.6 bn 0.45% | −0.5% |
| 39 | Portugal | $137.6 bn 0.44% | +2.4% |
| 40 | Iran | $135.5 bn 0.43% | +16.3% |
| 41 | Finland | $124.1 bn 0.40% | −1.6% |
| 42 | Greece | $122.1 bn 0.39% | +3.4% |
| 43 | Slovakia | $120.8 bn 0.39% | +0.6% |
| 44 | South Africa | $119.8 bn 0.38% | −3.2% |
| 45 | Chile | $99.5 bn 0.32% | −0.8% |
| 46 | Iraq | $92.8 bn 0.30% | +15.8% |
| 47 | Ukraine | $92.2 bn 0.29% | +3.4% |
| 48 | Egypt | $90.4 bn 0.29% | +6.9% |
| 49 | Colombia | $87.6 bn 0.28% | +6.1% |
| 50 | Argentina | $80.9 bn 0.26% | −10.0% |
| 51 | Morocco | $80.6 bn 0.26% | +8.9% |
| 52 | Kazakhstan | $74.5 bn 0.24% | +2.8% |
| 53 | Bangladesh | $73.4 bn 0.23% | −5.8% |
| 54 | New Zealand | $68.7 bn 0.22% | +0.9% |
| 55 | Peru | $66.3 bn 0.21% | +5.1% |
| 56 | Pakistan | $63.9 bn 0.20% | +5.5% |
| 57 | Bulgaria | $61.0 bn 0.20% | +3.2% |
| 58 | Lithuania | $58.5 bn 0.19% | +1.0% |
| 59 | Algeria | $54.6 bn 0.17% | +10.4% |
| 60 | Slovenia | $54.5 bn 0.17% | +2.6% |
| 61 | Puerto Rico (US) | $53.9 bn 0.17% | −5.3% |
| 62 | Serbia | $52.4 bn 0.17% | +8.4% |
| 63 | Oman | $52.3 bn 0.17% | +9.7% |
| 64 | Croatia | $50.9 bn 0.16% | +8.7% |
| 65 | Belarus | $50.8 bn 0.16% | +6.9% |
| 66 | Uzbekistan | $43.6 bn 0.14% | +2.0% |
| 67 | Congo, Dem. Rep. | $36.8 bn 0.12% | +17.8% |
| 68 | Dominican Republic | $36.1 bn 0.12% | +5.0% |
| 69 | Guatemala | $35.6 bn 0.11% | +7.6% |
| 70 | Cyprus | $35.1 bn 0.11% | +6.2% |
| 71 | Panama | $34.0 bn 0.11% | −5.0% |
| 72 | Ecuador | $33.6 bn 0.11% | −2.5% |
| 73 | Cambodia | $33.4 bn 0.11% | +17.2% |
| 74 | Bahrain | $33.0 bn 0.11% | +2.1% |
| 75 | Estonia | $32.5 bn 0.10% | +2.0% |
| 76 | Costa Rica | $31.3 bn 0.10% | +7.7% |
| 77 | Jordan | $30.4 bn 0.10% | +4.9% |
| 78 | Latvia | $29.2 bn 0.09% | −1.9% |
| 79 | Tunisia | $28.9 bn 0.09% | +1.5% |
| 80 | Ghana | $28.2 bn 0.09% | +7.5% |
| 81 | Kenya | $27.8 bn 0.09% | +6.9% |
| 82 | Libya | $27.6 bn 0.09% | −13.4% |
| 83 | Azerbaijan | $27.3 bn 0.09% | +9.3% |
| 84 | Malta | $24.9 bn 0.08% | +8.5% |
| 85 | Macao SAR, China | $24.7 bn 0.08% | +1.2% |
| 86 | Sri Lanka | $22.3 bn 0.07% | +16.5% |
| 87 | Cote d'Ivoire | $22.0 bn 0.07% | +3.2% |
| 88 | Honduras | $21.4 bn 0.07% | +1.2% |
| 89 | Armenia | $19.8 bn 0.06% | +31.4% |
| 90 | Angola | $19.6 bn 0.06% | −11.9% |
| 91 | Uruguay | $19.2 bn 0.06% | −0.7% |
| 92 | Georgia | $19.0 bn 0.06% | +6.8% |
| 93 | El Salvador | $18.4 bn 0.06% | +7.7% |
| 94 | Ethiopia | $17.8 bn 0.06% | −6.6% |
| 95 | Paraguay | $17.6 bn 0.06% | +1.3% |
| 96 | Tanzania | $17.1 bn 0.05% | +2.9% |
| 97 | Mongolia | $16.6 bn 0.05% | +22.6% |
| 98 | Bosnia and Herzegovina | $16.1 bn 0.05% | +4.6% |
| 99 | Kyrgyzstan | $14.7 bn 0.05% | +1.5% |
| 100 | Iceland | $14.5 bn 0.05% | +5.6% |
Source: World Bank, Imports of goods and services (current US$), latest completed year 2024 used as the 2025 ranking proxy. Values rounded for readability; growth compares 2024 with 2023.
Chart 2. Import size vs. import growth
This scatter chart compares selected major importers by two dimensions at once: the size of the 2024 import bill and the year-on-year growth rate against 2023. It separates mature, slow-growing high-volume markets from countries where import demand is still accelerating because factories, infrastructure and urban demand are scaling together.
How to read the 2025 import ranking
Interpretation
The ranking is most useful as a map of where foreign supply is being absorbed, not as a scoreboard of economic strength or weakness. Very large import totals usually appear when at least one of four conditions is present: a massive consumer market, a complex manufacturing base, structural energy dependence, or a gateway role in logistics and re-export. The United States leads because its domestic market is unmatched. China stays huge because industrial depth and domestic demand pull together. Germany, the Netherlands and Belgium reflect the mechanics of European production networks. Singapore and Hong Kong are the cleanest examples of trade-hub economics.
That is why import rankings need context. A country can be a giant importer because it is rich, because it is industrially dense, because it processes and redistributes goods, or because it must buy large volumes of fuel and intermediate inputs from abroad. The headline value is important, but the structure underneath matters more. In trade analysis, the next question should always be: consumer demand, energy dependence, capital formation, industrial inputs or gateway function?
Policy takeaways
- Large markets need resilience. The biggest importers are also the countries most exposed to port congestion, customs delays, shipping disruption and geopolitical supply shocks.
- Trade gateways need infrastructure more than headlines. Ports, warehousing, customs digitalisation and inland transport explain why some smaller economies rank far above what population alone would predict.
- Fast import growth can be healthy. Rising imports of machinery, components and business services often point to industrial upgrading when they support later export capacity and productivity growth.
- Energy structure still matters. Import totals in Europe and Asia can swing sharply when fuel prices change, even if physical trade volumes do not move as much.
- Current-dollar rankings are useful, but incomplete. Policymakers should pair them with volume measures, balance-of-payments data and trade composition to separate price effects from real demand.
What the ranking suggests about 2025
The import map still revolves around a familiar core, but momentum is no longer confined to the traditional rich-country cluster. The upper end remains dominated by the United States, China, the largest European economies and the major Asian industrial hubs. At the same time, countries such as India, Vietnam, Brazil, Saudi Arabia and Malaysia are showing faster import growth, which usually points to stronger domestic demand, higher investment and more active integration into supply chains.
That matters because changes in the largest importing countries travel quickly. When major import markets accelerate or slow, shipping lanes, commodity prices, freight rates, inventories, currency pressures and supplier strategy usually move with them. The ranking therefore helps explain not only where demand is now, but also where trade-sensitive businesses are most likely to feel the next shift first.
Sources
World Bank — Imports of goods and services (current US$)
The core dataset used for the Top 100 ranking. The World Bank page shows coverage through 2024 and documents the national-accounts framework behind the series.
https://data.worldbank.org/indicator/NE.IMP.GNFS.CD
WTO — World Trade Statistics
Used to cross-check the leading merchandise importers in 2024 and confirm that the same top tier dominates the global trade system at the goods-only level.
https://www.wto.org/english/res_e/statis_e/world_trade_statistics_e.htm
WTO — Global Trade Outlook and Statistics, April 2025
Provides appendix tables and commentary on the leading importers and exporters in world merchandise trade around the 2024 cycle.
https://www.wto.org/english/res_e/publications_e/trade_outlook25_e.htm
UNCTAD — Global trade updates
Used for macro context on the record level of world trade in 2024 and the relative contribution of goods and services to that result.
https://unctad.org/news/global-trade-hits-record-33-trillion-2024-driven-services-and-developing-economies
WITS — Country trade summaries
Useful for merchandise-level cross-checks once the headline ranking identifies the largest import markets.
https://wits.worldbank.org/