Countries by Trade Balance (USD) — 2025
Trade balance snapshot (2025 view, using latest available year as proxy)
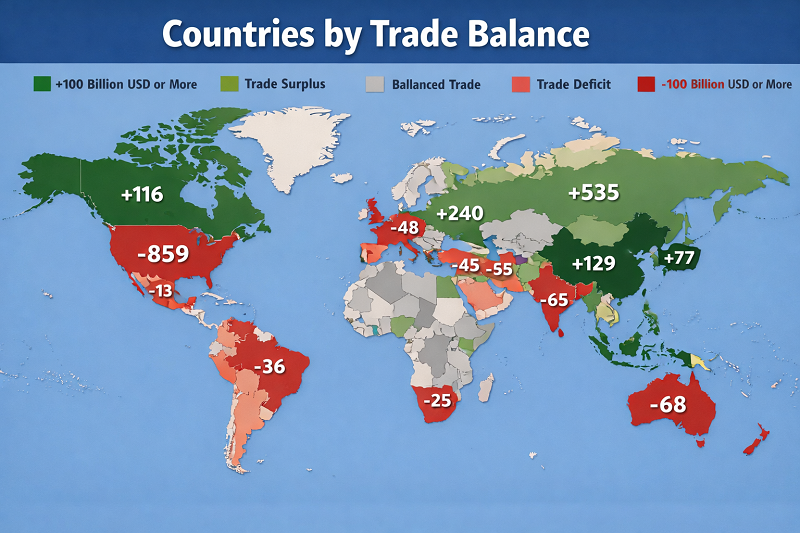
This ranking tracks net exports — exports minus imports — expressed in current U.S. dollars. In this snapshot, the largest surpluses are led by China (+$385.58bn), Singapore (+$209.92bn), and Ireland (+$189.18bn), while the largest deficit is the United States (−$774.17bn).
Important: the values below use a national-accounts concept of trade (goods and services). Goods-only (customs/Comtrade) balances can differ materially — especially for service exporters and re-export hubs.
How to read the ranking
- Positive balance = the economy sells more abroad than it buys (net exporter).
- Negative balance = the economy buys more abroad than it sells (net importer).
- Large values can reflect competitiveness, commodity cycles, tourism/IT services, or financial/re-export hubs — not just “manufacturing strength.”
What this is (and isn’t)
- This is: net exports (goods + services) in current USD; comparable across countries in one framework.
- Not: the customs merchandise balance. For goods-only analysis, use UN Comtrade / OEC / WITS tables.
| Rank | Country | Trade balance (USD bn) |
|---|---|---|
| 1 | China | +385.58 |
| 2 | Singapore | +209.92 |
| 3 | Ireland | +189.18 |
| 4 | United Arab Emirates | +181.48 |
| 5 | Germany | +176.81 |
| 6 | Russia | +112.85 |
| 7 | Netherlands | +97.82 |
| 8 | Norway | +85.52 |
| 9 | Switzerland | +78.82 |
| 10 | Taiwan | +70.18 |
| Rank | Country | Trade balance (USD bn) |
|---|---|---|
| 1 | United States | −774.17 |
| 2 | India | −327.44 |
| 3 | United Kingdom | −36.25 |
| 4 | Philippines | −47.85 |
| 5 | Nepal | −27.59 |
| 6 | Greece | −23.71 |
| 7 | Portugal | −18.08 |
| 8 | Cuba | −12.54 |
| 9 | Morocco | −12.85 |
| 10 | Iceland | −3.60 |
Method note (provenance)
- Primary series: World Bank WDI — Net exports of goods and services (current US$) (indicator: NE.RSB.GNFS.CD).
- Context fields used in Part 2: Exports (NE.EXP.GNFS.CD), Imports (NE.IMP.GNFS.CD), GDP (NY.GDP.MKTP.CD), Current account (BN.CAB.XOKA.CD) — all for the same proxy year where available.
- Rounding: displayed in USD billions, rounded to 2 decimals; small differences can occur due to revisions.
Why it matters
Persistent trade surpluses tend to coincide with stronger external buffers (FX reserves accumulation, lower reliance on foreign funding), while large deficits can raise rollover and currency-pressure risks when financing conditions tighten. The composition matters: a surplus driven by services (IT, finance, tourism) behaves differently from one driven by commodities.
In this snapshot, Singapore and Ireland rank very high partly because they are global hubs for trade, logistics, and cross-border services. By contrast, the United States shows the world’s largest deficit in absolute USD terms, which is closely linked to domestic demand and the role of the dollar in global finance.
FAQ
Is this “goods-only” trade balance?
Why do re-export hubs rank so high?
Should I compare countries only by USD amounts?
Can a deficit be “healthy”?
Why do rankings change year to year?
What year is used for this “2025 snapshot”?
Full Top-100 table (with USD / %GDP and exports/imports)
The table is pre-filled with the Top-100 list for the proxy year. If live enrichment succeeds, exports, imports, %GDP, and the scatter chart are populated from the same World Bank WDI series listed in Part 1.
| Rank | Country | Value |
|---|---|---|
| 1 | China | +385.58— |
| 2 | Singapore | +209.92— |
| 3 | Ireland | +189.18— |
| 4 | United Arab Emirates | +181.48— |
| 5 | Germany | +176.81— |
| 6 | Russia | +112.85— |
| 7 | Netherlands | +97.82— |
| 8 | Norway | +85.52— |
| 9 | Switzerland | +78.82— |
| 10 | Taiwan | +70.18— |
| 11 | Australia | +63.70— |
| 12 | Italy | +56.53— |
| 13 | Qatar | +47.77— |
| 14 | Denmark | +36.77— |
| 15 | Belgium | +35.20— |
| 16 | Algeria | +34.66— |
| 17 | Kuwait | +32.05— |
| 18 | Indonesia | +28.59— |
| 19 | Iraq | +26.67— |
| 20 | Sweden | +24.83— |
| 21 | Poland | +23.10— |
| 22 | Malaysia | +22.60— |
| 23 | Azerbaijan | +20.53— |
| 24 | Saudi Arabia | +19.91— |
| 25 | Austria | +19.49— |
| 26 | Czech Republic | +18.33— |
| 27 | Nigeria | +17.53— |
| 28 | Thailand | +15.28— |
| 29 | Brazil | +11.74— |
| 30 | Oman | +11.05— |
| 31 | Finland | +10.46— |
| 32 | Kazakhstan | +9.95— |
| 33 | Slovakia | +9.21— |
| 34 | South Africa | +8.51— |
| 35 | Argentina | +7.13— |
| 36 | Hungary | +7.13— |
| 37 | Bahrain | +6.74— |
| 38 | Slovenia | +6.35— |
| 39 | Bulgaria | +6.28— |
| 40 | Iran | +5.63— |
| 41 | Brunei | +5.24— |
| 42 | Angola | +5.09— |
| 43 | Tunisia | +5.02— |
| 44 | Lithuania | +4.60— |
| 45 | Bolivia | +4.35— |
| 46 | Jordan | +4.33— |
| 47 | Serbia | +4.17— |
| 48 | Croatia | +4.17— |
| 49 | Colombia | +4.15— |
| 50 | Canada | +4.04— |
| 51 | Latvia | +3.82— |
| 52 | Venezuela | +3.77— |
| 53 | Sri Lanka | +3.61— |
| 54 | North Macedonia | +3.61— |
| 55 | Egypt | +3.45— |
| 56 | Uganda | +3.39— |
| 57 | Malawi | +3.36— |
| 58 | Bangladesh | +3.31— |
| 59 | Kenya | +3.28— |
| 60 | Zambia | +3.21— |
| 61 | Tanzania | +3.12— |
| 62 | Peru | +3.05— |
| 63 | Portugal | +2.96— |
| 64 | Panama | +2.91— |
| 65 | Rwanda | +2.81— |
| 66 | Libya | +2.73— |
| 67 | Morocco | +2.56— |
| 68 | Cameroon | +2.54— |
| 69 | Belarus | +2.43— |
| 70 | Spain | +2.41— |
| 71 | Romania | +2.41— |
| 72 | Israel | +2.41— |
| 73 | Paraguay | +2.27— |
| 74 | Ecuador | +2.22— |
| 75 | Honduras | +2.18— |
| 76 | Uruguay | +2.17— |
| 77 | Georgia | +2.08— |
| 78 | Ghana | +2.06— |
| 79 | Cote d'Ivoire | +1.94— |
| 80 | Gabon | +1.90— |
| 81 | Myanmar | +1.89— |
| 82 | Mongolia | +1.83— |
| 83 | New Zealand | +1.76— |
| 84 | El Salvador | +1.74— |
| 85 | Luxembourg | +1.65— |
| 86 | Bosnia and Herzegovina | +1.56— |
| 87 | Madagascar | +1.52— |
| 88 | Mozambique | +1.47— |
| 89 | Guatemala | +1.34— |
| 90 | Benin | +1.31— |
| 91 | Cambodia | +1.31— |
| 92 | Mali | +1.30— |
| 93 | Togo | +1.25— |
| 94 | Congo (Brazzaville) | +1.17— |
| 95 | Papua New Guinea | +0.67— |
| 96 | Djibouti | +0.54— |
| 97 | Cape Verde | +0.11— |
| 98 | Bahamas | +0.10— |
| 99 | Sierra Leone | +0.04— |
| 100 | Zimbabwe | −2.69— |
| Rank | Country | Exports (USD bn) | Imports (USD bn) |
|---|---|---|---|
| 1 | China | — | — |
| 2 | Singapore | — | — |
| 3 | Ireland | — | — |
| 4 | United Arab Emirates | — | — |
| 5 | Germany | — | — |
| 6 | Russia | — | — |
| 7 | Netherlands | — | — |
| 8 | Norway | — | — |
| 9 | Switzerland | — | — |
| 10 | Taiwan | — | — |
| 11 | Australia | — | — |
| 12 | Italy | — | — |
| 13 | Qatar | — | — |
| 14 | Denmark | — | — |
| 15 | Belgium | — | — |
| 16 | Algeria | — | — |
| 17 | Kuwait | — | — |
| 18 | Indonesia | — | — |
| 19 | Iraq | — | — |
| 20 | Sweden | — | — |
| 21 | Poland | — | — |
| 22 | Malaysia | — | — |
| 23 | Azerbaijan | — | — |
| 24 | Saudi Arabia | — | — |
| 25 | Austria | — | — |
| 26 | Czech Republic | — | — |
| 27 | Nigeria | — | — |
| 28 | Thailand | — | — |
| 29 | Brazil | — | — |
| 30 | Oman | — | — |
| 31 | Finland | — | — |
| 32 | Kazakhstan | — | — |
| 33 | Slovakia | — | — |
| 34 | South Africa | — | — |
| 35 | Argentina | — | — |
| 36 | Hungary | — | — |
| 37 | Bahrain | — | — |
| 38 | Slovenia | — | — |
| 39 | Bulgaria | — | — |
| 40 | Iran | — | — |
| 41 | Brunei | — | — |
| 42 | Angola | — | — |
| 43 | Tunisia | — | — |
| 44 | Lithuania | — | — |
| 45 | Bolivia | — | — |
| 46 | Jordan | — | — |
| 47 | Serbia | — | — |
| 48 | Croatia | — | — |
| 49 | Colombia | — | — |
| 50 | Canada | — | — |
| 51 | Latvia | — | — |
| 52 | Venezuela | — | — |
| 53 | Sri Lanka | — | — |
| 54 | North Macedonia | — | — |
| 55 | Egypt | — | — |
| 56 | Uganda | — | — |
| 57 | Malawi | — | — |
| 58 | Bangladesh | — | — |
| 59 | Kenya | — | — |
| 60 | Zambia | — | — |
| 61 | Tanzania | — | — |
| 62 | Peru | — | — |
| 63 | Portugal | — | — |
| 64 | Panama | — | — |
| 65 | Rwanda | — | — |
| 66 | Libya | — | — |
| 67 | Morocco | — | — |
| 68 | Cameroon | — | — |
| 69 | Belarus | — | — |
| 70 | Spain | — | — |
| 71 | Romania | — | — |
| 72 | Israel | — | — |
| 73 | Paraguay | — | — |
| 74 | Ecuador | — | — |
| 75 | Honduras | — | — |
| 76 | Uruguay | — | — |
| 77 | Georgia | — | — |
| 78 | Ghana | — | — |
| 79 | Cote d'Ivoire | — | — |
| 80 | Gabon | — | — |
| 81 | Myanmar | — | — |
| 82 | Mongolia | — | — |
| 83 | New Zealand | — | — |
| 84 | El Salvador | — | — |
| 85 | Luxembourg | — | — |
| 86 | Bosnia and Herzegovina | — | — |
| 87 | Madagascar | — | — |
| 88 | Mozambique | — | — |
| 89 | Guatemala | — | — |
| 90 | Benin | — | — |
| 91 | Cambodia | — | — |
| 92 | Mali | — | — |
| 93 | Togo | — | — |
| 94 | Congo (Brazzaville) | — | — |
| 95 | Papua New Guinea | — | — |
| 96 | Djibouti | — | — |
| 97 | Cape Verde | — | — |
| 98 | Bahamas | — | — |
| 99 | Sierra Leone | — | — |
| 100 | Zimbabwe | — | — |
Scatter: trade balance vs current account (USD bn)
Points use the same proxy year as the table. The scatter helps separate “trade-driven” balances from broader external balances that include income flows and transfers.
Interpretation: what drives surpluses and deficits
A trade balance is not a “win/lose” score. It is an outcome of prices (terms of trade), domestic demand, capacity and competitiveness, services specialization, and exchange rates. That’s why a hub economy can show an outsized surplus, while a large consumer economy can run a persistent deficit.
Common surplus profiles
- Manufacturing exporters: deep supply chains, strong tradables productivity, and stable external demand.
- Commodity exporters: balances swing with oil/gas/metals prices and production volumes.
- Services-heavy hubs: transport/logistics, finance, IP-related services, tourism, and cross-border corporate structures can lift net exports beyond what goods-only data suggests.
Common deficit profiles
- Demand-led importers: strong consumption and investment pull in imports faster than export capacity grows.
- Fast-growing, capex-heavy economies: deficits can be normal if financed by stable long-term inflows and productive investment.
- Energy importers in price shocks: higher fuel bills widen deficits quickly when pass-through is limited.
How to use this ranking (practical lens)
For macro risk checks
- Compare trade balance % of GDP (Part 2) rather than only USD totals.
- Cross-check with the current account (scatter chart): income flows and transfers can materially change the external picture.
- Look for persistence: one-off commodity windfalls are not the same as structural competitiveness.
For business and strategy
- Large deficits often coincide with strong import demand — but also higher sensitivity to FX and financing conditions.
- Large surpluses can signal strong export sectors and logistics capacity, but may also reflect hub accounting effects.
- Use the ranking as a starting point; then drill down into product mix, partners, and services exposure.
Primary sources (with series identifiers)
These are the exact datasets referenced by the tables and the enrichment logic.