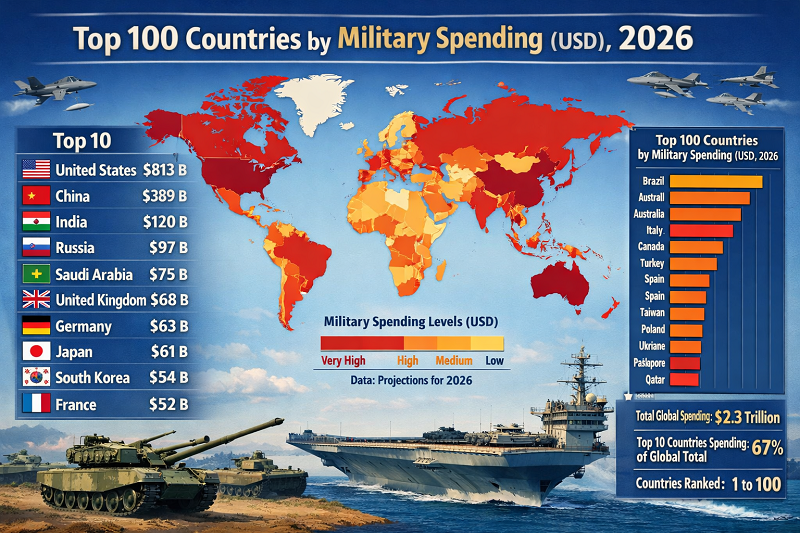
Top 100 Countries by Military Spending (USD), 2026
Military spending in 2026 is best read as a budget hierarchy, not a finished outturn table
A clean 2026 ranking needs one methodological choice up front: the year is still in progress, so there is no audited cross-country table of what governments have already spent in full-year 2026. The most honest current snapshot is a budget-based ranking built from announced or compiled 2026 defence budgets in current US dollars, then interpreted against the latest official military-expenditure series from SIPRI and the World Bank.
On that basis, the spending map is highly concentrated. In this Top 100 list, the United States alone accounts for about 29.2% of the total, the top three countries account for 47.4%, and the top 10 account for 67.5%. Europe places many countries in the ranking, but absolute firepower in budget terms is still dominated by a small number of very large states.
Top 10 countries by military spending budget in the 2026 snapshot
The top of the table mixes superpowers, large industrial democracies and security-stressed regional powers. The ranking is not, by itself, a proxy for combat effectiveness, but it is a strong signal of procurement room, sustainment capacity, training scale, research funding and the ability to absorb prolonged strategic competition.
United States
Still far ahead in absolute terms. The U.S. 2026 budget is larger than the next two countries combined, preserving unmatched room for procurement, research, global basing and force sustainment.
China
China remains the clear second spender. Its scale keeps pressure on Indo-Pacific balancing and gives Beijing broad capacity for naval, missile and aerospace modernisation.
Russia
Russia stays in the top three as war-driven mobilisation and rearmament continue to dominate fiscal priorities. Absolute size remains below the United States and China, but still large enough to reshape Europe’s security calculus.
Germany
Germany’s step-up confirms that Europe’s rearmament is no longer marginal. The country has moved into the global top tier as procurement and readiness spending accelerate.
India
India combines a very large defence budget with long-run modernisation goals tied to China, Pakistan and maritime security in the Indian Ocean.
United Kingdom
The U.K. remains one of the largest European military spenders, reflecting nuclear deterrence, expeditionary capability and sustained alliance commitments.
France
France stays in the top group through a mix of nuclear forces, aerospace strength and a broad-spectrum military posture across Europe, Africa and the Indo-Pacific.
Saudi Arabia
Saudi Arabia’s position reflects both regional threat perceptions and the cost of maintaining a technologically intensive force structure.
Japan
Japan’s high rank underlines how quickly East Asian security priorities have changed. Budget growth is increasingly tied to missiles, maritime security and counter-strike capacity.
Australia
Australia rounds out the top 10 as Indo-Pacific risk pushes Canberra toward a larger and more capital-intensive defence posture.
Table 1. Top 10 military spending budgets, 2026
| Rank | Country | Budget |
|---|---|---|
| 1 | United States | $831,500,000,000 |
| 2 | China | $303,000,000,000 |
| 3 | Russia | $212,638,272,000 |
| 4 | Germany | $127,400,090,000 |
| 5 | India | $109,000,000,000 |
| 6 | United Kingdom | $88,526,529,585 |
| 7 | France | $67,232,395,000 |
| 8 | Saudi Arabia | $63,988,055,520 |
| 9 | Japan | $58,000,000,000 |
| 10 | Australia | $57,350,000,000 |
Values are shown in current US dollars and rounded to the nearest dollar shown by the source list.
Chart 1. Top 20 countries by military spending budget
- United States — $831.5B
- China — $303.0B
- Russia — $212.6B
- Germany — $127.4B
- India — $109.0B
- United Kingdom — $88.5B
- France — $67.2B
- Saudi Arabia — $64.0B
- Japan — $58.0B
- Australia — $57.4B
Methodology
This page ranks countries by listed 2026 defence budgets in current US dollars. That choice is deliberate. As of 28 March 2026, no global dataset can show completed 2026 military expenditure because the year is still underway. The latest official cross-country military-expenditure series published through the World Bank and sourced from SIPRI run through 2024, which is why older “2026 spending” pages often end up mixing real outturns, partial-year claims and guesswork.
To avoid that problem, the ranking itself uses a 2026 budget snapshot. Official sources are then used for context, definitions and secondary interpretation: SIPRI for expenditure methodology, the World Bank for the public indicator layer, NATO for allied defence-spending ratios and IISS for the broader 2025 global defence-spending environment. Values are harmonised into current US dollars and lightly rounded for readability.
The main limitation is straightforward: budget is not the same thing as executed expenditure. Some countries include pensions, paramilitary items, supplemental war funding or procurement financing differently. Exchange-rate shifts can change the USD ranking even when local-currency appropriations barely move. Off-budget spending, emergency appropriations and wartime revisions can also make year-end reality diverge from the headline budget number. That is why this page should be read as a current capacity-and-priority ranking, not as an audited end-of-year spending ledger.
Insights and takeaways from the ranking
The first insight is concentration. The top three countries already account for 47.4% of the Top 100 total, which means the global military balance is still shaped above all by Washington, Beijing and Moscow. The United States remains in a category of its own, with a 2026 budget larger than the next two countries combined.
The second insight is that Europe’s story is one of breadth rather than singular scale. European countries together represent roughly 31.7% of the Top 100 total, close to the Americas at 33.6%, but that weight is spread across many budgets rather than concentrated in one or two dominant national spenders. Germany, the United Kingdom, France and Poland are the clearest signs of a structural rearmament cycle.
The third insight is the durability of the Indo-Pacific shift. Asia-Pacific countries account for about 24.8% of the Top 100 total, with China, India, Japan, Australia, South Korea and Taiwan all in the upper half of the ranking. This is not a one-country story: the region combines superpower competition, maritime security, missile defence and supply-chain resilience into a long multi-country spending cycle.
Finally, absolute ranking and strategic pressure are not the same thing. Ukraine sits outside the very top tier in raw dollars but still ranks high enough to show how wartime mobilisation can move a country rapidly up the table. Smaller NATO states such as Lithuania and Estonia look modest in raw dollars, yet their burden relative to GDP is among the highest in the alliance.
What this means for the reader
For a general reader, this ranking is useful because it shows where defence has become a first-order fiscal priority. Large budgets usually mean larger procurement pipelines, heavier demand for ammunition and systems integration, longer-term support for defence contractors and more pressure on public finances.
For investors and industry watchers, the table is a clue to where multi-year procurement programmes are likely to remain active. For policy observers, it helps separate countries that are merely talking about rearmament from countries that are actually putting large sums into their defence budgets. For ordinary taxpayers, it also highlights the trade-off question: defence has moved up the queue in many states, which means less room elsewhere unless growth or borrowing absorbs the difference.
FAQ
Why is this a 2026 budget ranking and not a 2026 actual-spending ranking?
Because full-year 2026 actual spending does not exist yet in audited cross-country form. A current-year page has to use budgets or appropriations as the nearest comparable snapshot.
Why do budget and military expenditure differ?
Budgets are plans or appropriations. Expenditure is what is ultimately executed. Supplementals, wartime revisions, exchange rates and accounting rules can all widen the gap.
Does the country with the biggest budget automatically have the strongest military?
No. Budget size matters enormously, but effectiveness also depends on doctrine, industrial depth, logistics, training, technology, geography, alliance support and wartime adaptation.
Why is the United States so far ahead?
Because it combines global commitments, a massive procurement base, nuclear forces, advanced research, worldwide basing and support costs that few other countries carry at comparable scale.
Why are some smaller European states rising quickly in defence discussions even if their budgets look small?
Because raw dollars and military burden are different stories. Several front-line NATO states spend a very high share of GDP even when their absolute budgets remain modest next to the largest powers.
Why are oil exporters so often high in the ranking?
Hydrocarbon revenue can support large defence outlays, especially in states facing regional threat pressure and buying capital-intensive air and missile-defence systems.
Full Top 100 military spending table, with filtering and budget-share view
The table below keeps all 100 rows in the HTML source. JavaScript only handles search, sorting, filters and the value toggle. By default, the interactive view narrows the list to the top 20 after the page loads, but if scripts are disabled the full table stays visible and readable.
Table 2. Top 100 countries by military spending, 2026
Top 100 total used for the share toggle: $2,842,974,863,038. This is a share of the Top 100 table total, not a share of total world military expenditure.
| Rank | Country | Value | Region |
|---|---|---|---|
| 1 | United States | $831,500,000,00029.25% | Americas |
| 2 | China | $303,000,000,00010.66% | Asia-Pacific |
| 3 | Russia | $212,638,272,0007.48% | Europe |
| 4 | Germany | $127,400,090,0004.48% | Europe |
| 5 | India | $109,000,000,0003.83% | Asia-Pacific |
| 6 | United Kingdom | $88,526,529,5853.11% | Europe |
| 7 | France | $67,232,395,0002.36% | Europe |
| 8 | Saudi Arabia | $63,988,055,5202.25% | MENA |
| 9 | Japan | $58,000,000,0002.04% | Asia-Pacific |
| 10 | Australia | $57,350,000,0002.02% | Asia-Pacific |
| 11 | Poland | $55,865,141,6001.97% | Europe |
| 12 | Turkiye | $51,400,000,0001.81% | Europe |
| 13 | Canada | $45,824,959,6201.61% | Americas |
| 14 | Ukraine | $45,000,000,0001.58% | Europe |
| 15 | South Korea | $44,800,000,0001.58% | Asia-Pacific |
| 16 | Spain | $39,000,676,3501.37% | Europe |
| 17 | Italy | $37,325,165,0001.31% | Europe |
| 18 | Israel | $34,600,000,0001.22% | MENA |
| 19 | Netherlands | $31,791,150,0001.12% | Europe |
| 20 | Angola | $31,200,000,0001.10% | Africa |
| 21 | Taiwan | $31,180,000,0001.10% | Asia-Pacific |
| 22 | Brazil | $26,400,000,0000.93% | Americas |
| 23 | Algeria | $25,000,000,0000.88% | MENA |
| 24 | United Arab Emirates | $23,480,000,0000.83% | MENA |
| 25 | Singapore | $18,000,000,0000.63% | Asia-Pacific |
| 26 | Morocco | $16,100,000,0000.57% | MENA |
| 27 | Sweden | $15,900,000,0000.56% | Europe |
| 28 | Colombia | $15,800,000,0000.56% | Americas |
| 29 | Belgium | $14,900,000,0000.52% | Europe |
| 30 | Denmark | $14,250,000,0000.50% | Europe |
| 31 | Qatar | $11,950,000,0000.42% | MENA |
| 32 | Norway | $11,189,483,2000.39% | Europe |
| 33 | Indonesia | $11,155,297,7160.39% | Asia-Pacific |
| 34 | Romania | $10,230,630,0000.36% | Europe |
| 35 | Vietnam | $10,200,000,0000.36% | Asia-Pacific |
| 36 | Iran | $9,230,000,0000.32% | MENA |
| 37 | Czechia | $9,174,000,0000.32% | Europe |
| 38 | Pakistan | $9,102,115,3500.32% | Asia-Pacific |
| 39 | Mexico | $9,100,000,0000.32% | Americas |
| 40 | Finland | $8,890,000,0000.31% | Europe |
| 41 | Switzerland | $8,372,658,4260.29% | Europe |
| 42 | Oman | $8,364,000,0000.29% | MENA |
| 43 | Greece | $8,242,150,0000.29% | Europe |
| 44 | Iraq | $8,000,000,0000.28% | MENA |
| 45 | Kuwait | $7,987,000,0000.28% | MENA |
| 46 | Chile | $6,800,000,0000.24% | Americas |
| 47 | Portugal | $6,760,000,0000.24% | Europe |
| 48 | Philippines | $6,571,641,0110.23% | Asia-Pacific |
| 49 | Uzbekistan | $6,210,000,0000.22% | Asia-Pacific |
| 50 | Austria | $6,103,900,8000.21% | Europe |
| 51 | Venezuela | $6,060,000,0000.21% | Americas |
| 52 | Thailand | $6,006,660,0000.21% | Asia-Pacific |
| 53 | Hungary | $5,887,250,0000.21% | Europe |
| 54 | Kazakhstan | $5,836,386,0000.21% | Asia-Pacific |
| 55 | Lithuania | $5,651,760,0000.20% | Europe |
| 56 | Egypt | $5,193,500,0000.18% | MENA |
| 57 | Malaysia | $5,100,000,0000.18% | Asia-Pacific |
| 58 | Azerbaijan | $5,100,000,0000.18% | Asia-Pacific |
| 59 | North Korea | $4,750,000,0000.17% | Asia-Pacific |
| 60 | Burkina Faso | $4,590,000,0000.16% | Africa |
| 61 | Nigeria | $3,900,000,0000.14% | Africa |
| 62 | Ethiopia | $3,720,968,9760.13% | Africa |
| 63 | Bangladesh | $3,340,000,0000.12% | Asia-Pacific |
| 64 | Cuba | $3,301,500,0000.12% | Americas |
| 65 | Ecuador | $2,963,400,0000.10% | Americas |
| 66 | Slovakia | $2,900,000,0000.10% | Europe |
| 67 | South Africa | $2,877,000,0000.10% | Africa |
| 68 | Myanmar | $2,815,031,3610.10% | Asia-Pacific |
| 69 | Serbia | $2,770,000,0000.10% | Europe |
| 70 | Croatia | $2,744,000,0000.10% | Europe |
| 71 | Jordan | $2,668,500,0000.09% | MENA |
| 72 | Peru | $2,552,000,0000.09% | Americas |
| 73 | Bulgaria | $2,485,350,0000.09% | Europe |
| 74 | New Zealand | $2,455,949,3320.09% | Asia-Pacific |
| 75 | Estonia | $2,375,000,0000.08% | Europe |
| 76 | Tunisia | $2,172,751,2500.08% | MENA |
| 77 | Zimbabwe | $1,976,800,0000.07% | Africa |
| 78 | Uruguay | $1,903,440,0000.07% | Americas |
| 79 | Slovenia | $1,782,000,0000.06% | Europe |
| 80 | Ireland | $1,754,400,5000.06% | Europe |
| 81 | Kenya | $1,651,803,0250.06% | Africa |
| 82 | Mongolia | $1,590,000,0000.06% | Asia-Pacific |
| 83 | Luxembourg | $1,530,685,0000.05% | Europe |
| 84 | Uganda | $1,510,000,0000.05% | Africa |
| 85 | Sri Lanka | $1,500,000,0000.05% | Asia-Pacific |
| 86 | Armenia | $1,480,000,0000.05% | Asia-Pacific |
| 87 | Tanzania | $1,476,113,3610.05% | Africa |
| 88 | Libya | $1,474,800,0000.05% | MENA |
| 89 | Turkmenistan | $1,463,000,0000.05% | Asia-Pacific |
| 90 | Nicaragua | $1,311,600,0000.05% | Americas |
| 91 | Kosovo | $1,177,450,0000.04% | Europe |
| 92 | Mali | $1,110,000,0000.04% | Africa |
| 93 | Panama | $1,069,750,0000.04% | Americas |
| 94 | El Salvador | $1,037,200,0000.04% | Americas |
| 95 | Belarus | $1,034,784,0000.04% | Europe |
| 96 | Bahrain | $997,015,5090.04% | MENA |
| 97 | Argentina | $993,919,7900.03% | Americas |
| 98 | Democratic Republic of the Congo | $960,000,0000.03% | Africa |
| 99 | Ghana | $954,423,7560.03% | Africa |
| 100 | Republic of the Congo | $933,360,0000.03% | Africa |
Source basis for this table: 2026 defence budgets compiled in current US dollars. This table reflects the current 2026 snapshot. It is meant for comparison, not for formal fiscal accounting.
Chart 2. Budget size versus military burden for selected economies
This scatter chart links the 2026 budget snapshot with the latest comparable burden ratios available from public sources. The horizontal axis shows the listed 2026 budget in billions of current US dollars. The vertical axis shows defence spending as a share of GDP, using NATO 2025 estimates for NATO members and the latest World Bank or SIPRI ratio available for selected non-NATO countries.
Visible fallback points: United States (831.5, 3.22), India (109.0, 2.3), Japan (58.0, 1.4), Poland (55.9, 4.48), Ukraine (45.0, 34.5).
The point of the chart is comparison, not perfect same-year accounting. It shows why large budgets and high burden ratios are related, but not identical, signals.
How to interpret the 2026 military spending ranking without overstating what it proves
The biggest lesson of this ranking is not simply that the world is spending more on defence. It is that rearmament has become geographically broad while remaining financially concentrated. The top three countries account for about 47.4% of the Top 100 total, and the top 10 account for about 67.5%. That makes absolute military spending one of the clearest examples of a global hierarchy where many states are moving up, but only a few set the scale of the system.
Europe’s weight in the table, about 31.7% of the Top 100 total, shows that the continent’s defence shift is real. The key caveat is fragmentation: Europe has many important budgets, but no single European spender can match the United States or China in raw scale. The Americas remain slightly ahead as a bloc at roughly 33.6%, driven overwhelmingly by the United States, while Asia-Pacific at about 24.8% confirms that the centre of long-run strategic competition is no longer purely Atlantic.
The NATO share, roughly 52.2% of the Top 100 total in this list, also matters. It shows that the alliance still commands enormous fiscal depth, even if that depth is distributed unevenly and translated into capability at different speeds. For non-NATO states, especially China, India, Saudi Arabia and several East Asian countries, the ranking shows that defence capacity is increasingly tied to industrial policy, technology and maritime security rather than to legacy force size alone.
Policy takeaways
A budget table is most useful when it is treated as a signal of state priority and industrial capacity. It is less useful when readers try to turn it into a shortcut for battlefield outcomes.
- For major powers, the ranking is a measure of how much room exists for procurement, munitions replenishment, R&D and force sustainment over multiple years.
- For Europe, the table shows that rearmament is broad-based, but the policy challenge is coordination, not just headline spending.
- For Indo-Pacific states, rising budgets point to a durable cycle built around maritime risk, missiles, air defence and supply-chain security.
- For lower-ranked countries, a small absolute budget does not mean strategic irrelevance. Border threats, alliance dependence and military burden can still be very high.
- For readers comparing countries, it is safer to read this ranking together with burden ratios, industrial output, force structure and alliance backing.
In practical terms, this means a country can rank lower in absolute dollars yet still face a much sharper defence trade-off than a richer, larger economy. Ukraine is the obvious example. Several Baltic and Eastern European countries show a similar pattern in burden terms. The United States, by contrast, is not just first because it spends the most. It is first because it can pair scale with industrial depth, research spending and a global logistics architecture that most countries do not possess.
Primary sources
SIPRI Military Expenditure Database
Official long-run military expenditure database. The current public series runs through 2024 and is the baseline source for definition and historical comparability.
https://www.sipri.org/databases/milex
World Bank — Military expenditure (current USD)
Public indicator layer built from SIPRI data, useful for quick cross-country lookup and metadata on the indicator.
https://data.worldbank.org/indicator/MS.MIL.XPND.CD
World Bank — Military expenditure (% of GDP)
Used alongside NATO tables for the burden comparison in the selected-economy scatter chart.
https://data.worldbank.org/indicator/MS.MIL.XPND.GD.ZS
NATO — Defence Expenditure of NATO Countries (2014–2025)
Official NATO table for allied defence spending levels and burden ratios, including 2025 estimates.
https://www.nato.int/content/dam/nato/webready/documents/finance/def-exp-2025-en.pdf
NATO — Secretary General’s Annual Report 2025
Context for the acceleration in European and Canadian defence investment during 2025.
https://www.nato.int/en/about-us/official-texts-and-resources/secretary-generals-annual-report/secretary-generals-annual-report-2025
IISS — Global defence spending, Military Balance 2026
Used for current macro context for the broader 2025 defence-spending environment.
https://www.iiss.org/online-analysis/military-balance/2026/02/global-defence-spending-continues-to-grow-amid-geopolitical-uncertainty/
Global Firepower — Defense Budget by Country (2026)
Current-year budget snapshot used for the Top 100 ranking itself. This is the working list for 2026 budgets, not an audited end-of-year expenditure dataset.
https://www.globalfirepower.com/defense-spending-budget.php