Top Countries by Home Ownership Rate (Latest Available Data)
Home ownership rate is a tenure metric, not an affordability score
Home ownership rate measures the share of households living in a dwelling they own, either outright or with a mortgage. That makes it a tenure-structure indicator, not a direct answer to whether buying is easy or cheap. A country can post very high ownership because of post-privatisation transfers, inheritance patterns, self-built housing, or a weak rental sector, even when younger households struggle in major cities. A rich country can also show a lower ownership rate if renting is secure, professionalised, and compatible with labour mobility. Read also: city-level housing affordability and housing price-to-income ratio in major cities.
This page uses the latest comparable OECD housing-tenure update as the core dataset and keeps the coverage honest: 39 countries, not an artificial global Top 100.
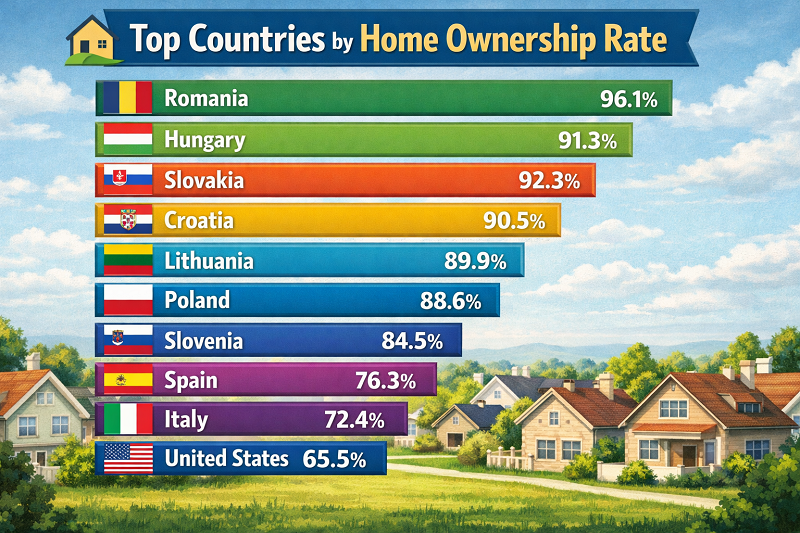
Ranking table: countries with the highest home ownership rates
Rank is based on the share of owner-occupied households, defined as outright owners plus owners with a mortgage. This table does not claim that the top-ranked markets are the most affordable, the highest-quality, or the easiest for first-time buyers. It only shows how national housing systems are distributed between ownership and non-ownership.
| Rank | Country | Home ownership rate |
|---|---|---|
| 1 | Slovakia | 93.5% |
| 2 | Romania | 92.8% |
| 3 | Croatia | 90.3% |
| 4 | Lithuania | 86.8% |
| 5 | Bulgaria | 85.2% |
| 6 | Poland | 84.7% |
| 7 | Japan | 84.0% |
| 8 | Latvia | 80.7% |
| 9 | Iceland | 78.4% |
| 10 | Italy | 75.2% |
| 11 | Estonia | 75.0% |
| 12 | Slovenia | 73.9% |
| 13 | Spain | 73.6% |
| 14 | Costa Rica | 73.3% |
| 15 | Norway | 72.3% |
| 16 | Portugal | 72.1% |
| 17 | Czechia | 71.8% |
| 18 | Mexico | 69.6% |
| 19 | Canada | 68.7% |
| 20 | United Kingdom | 68.4% |
| 21 | Ireland | 68.2% |
| 22 | Greece | 68.2% |
| 23 | Malta | 66.0% |
| 24 | Belgium | 65.8% |
| 25 | United States | 65.3% |
| 26 | New Zealand | 63.9% |
| 27 | Cyprus | 63.4% |
| 28 | Australia | 62.7% |
| 29 | Luxembourg | 62.3% |
| 30 | Finland | 61.0% |
| 31 | France | 58.6% |
| 32 | Sweden | 58.2% |
| 33 | Netherlands | 57.9% |
| 34 | Chile | 57.0% |
| 35 | Denmark | 52.2% |
| 36 | Austria | 47.9% |
| 37 | Germany | 41.0% |
| 38 | Switzerland | 38.2% |
| 39 | Colombia | 35.9% |
Coverage is limited to countries with comparable tenure splits in the latest OECD HM1.3 update. Several countries rely on earlier survey years, which is why the page is titled “latest available data” rather than “2025 ranking”.
Split by tenure type: outright owners, mortgage owners, and renter-heavy systems
A headline ownership rate can hide very different housing models. Some countries are dominated by outright ownership, often linked to historical privatisation or family transfers. Others are strongly mortgage-led, which usually points to deeper housing finance and a larger formal credit market. At the other end, some rich countries remain more renter-heavy because renting is better protected, better supplied, or simply more compatible with urban labour mobility.
Highest outright-owner shares
| Country | Outright owners |
|---|---|
| Romania | 91.7% |
| Croatia | 84.3% |
| Bulgaria | 84.0% |
| Lithuania | 74.6% |
| Poland | 74.1% |
| Slovakia | 70.3% |
| Latvia | 69.8% |
| Costa Rica | 66.4% |
Highest mortgage-owner shares
| Country | Owners with mortgage |
|---|---|
| Iceland | 59.2% |
| Norway | 52.5% |
| Netherlands | 47.0% |
| Sweden | 40.4% |
| United States | 39.3% |
| Denmark | 38.5% |
| Canada | 38.2% |
| Belgium | 33.8% |
Most renter-heavy housing systems
| Country | Renters |
|---|---|
| Switzerland | 61.2% |
| Germany | 55.4% |
| Denmark | 47.5% |
| Austria | 43.7% |
| Netherlands | 41.2% |
| Colombia | 40.7% |
| France | 39.2% |
| Sweden | 38.9% |
Chart: top and bottom countries do not reach home ownership in the same way
The chart below compares the six highest-ownership and six lowest-ownership countries in the comparable sample. It uses two bars per country: outright owners and owners with mortgage. The contrast matters. Romania or Bulgaria sit near the top mainly because they are outright-owner systems, while Iceland or Norway are high-ownership markets built far more through mortgage finance. At the bottom, Switzerland and Germany do not simply “fail” home ownership; they are organised around larger rental sectors.
| Country | Outright owners | Owners with mortgage |
|---|---|---|
| Slovakia | 70.3% | 23.2% |
| Romania | 91.7% | 1.1% |
| Croatia | 84.3% | 6.1% |
| Lithuania | 74.6% | 12.3% |
| Bulgaria | 84.0% | 1.2% |
| Poland | 74.1% | 10.7% |
| Chile | 44.3% | 12.8% |
| Denmark | 13.7% | 38.5% |
| Austria | 31.4% | 16.5% |
| Germany | 24.3% | 16.7% |
| Switzerland | 4.7% | 33.5% |
| Colombia | 31.1% | 4.9% |
If the chart does not render, the fallback table remains fully visible. The chart uses the same tenure data as the ranking and is shown only as a visual aid.
Interpretation: high ownership can coexist with weak rental markets, ageing stock, and lower mobility
The most important mistake readers make with this metric is to treat a high home ownership rate as a universal sign of housing success. It is not. In Central and Eastern Europe, very high ownership often reflects the large-scale transfer of formerly state-owned dwellings in the 1990s. That explains why several countries can sit above 80% or even 90% ownership without necessarily offering a liquid, modern, or affordable path into home purchase for today’s younger households.
Mortgage-heavy systems tell a different story. Countries such as Iceland, Norway, the Netherlands, Sweden, the United States and Denmark have a large share of households that own with debt rather than outright. This usually signals deeper mortgage markets, stronger collateral systems, and a larger formal role for banks and long-term housing finance. It does not automatically mean homes are cheaper. In fact, some of these markets are expensive, but they also provide institutional channels through which ownership is financed.
Low ownership is not automatically a weakness either. Germany and Switzerland are renter-heavy partly because renting is a more stable long-term tenure form, with stronger legal protections, more professional landlords, and greater compatibility with labour mobility. A lower ownership rate in that context can coexist with high incomes, better quality rental stock, and less social pressure to buy early.
A country can therefore rank high on ownership while still facing poor urban affordability, outdated housing stock, high overcrowding, or low geographic mobility. Ownership tells you who holds tenure, not whether the housing system is efficient or equitable.
What this means for readers
For households, relocators, and investors, the useful reading is comparative. If a country has high ownership but low mortgage use, entry may depend more on inheritance, family support, or historic asset transfer than on current wage-based affordability. If a country has lower ownership but strong mortgage participation and a large formal rental sector, households may face a different trade-off: higher recurring housing costs, but more flexibility and often a clearer legal framework for renting.
That is why this page should be read together with your affordability pages, not instead of them. The ownership ranking answers how households are housed. The affordability pages answer how hard it is to buy relative to income: Top 100 Cities by Housing Affordability (Price-to-Income Ratio) and Top 10 Countries by Housing Price-to-Income Ratio in Major Cities.
Methodology
This ranking is based on the latest comparable housing-tenure breakdown published in the OECD Affordable Housing Database, indicator HM1.3. The key unit of observation is the household, not the individual person. That matters: the page measures how households are housed, not how many adults personally own property, and not how large or small the homes are.
Home ownership rate on this page is defined as: outright owners + owners with mortgage. Renters combine private rent + subsidised rent. Some countries also have a residual “other/unknown” category, which is not used as the ranking variable.
- The comparable sample includes 39 countries with usable tenure splits in the latest OECD HM1.3 update.
- The ranking does not backfill weaker non-comparable sources just to reach an artificial “Top 100”.
- Values are shown to one decimal place for readability.
- Reference years are not identical across all countries. Within this sample, some observations are earlier than the core 2022 wave, including 2021 for Australia, New Zealand, Switzerland, the United Kingdom and the United States; 2020 for Norway; 2019 for Canada; and 2018 for Iceland.
- OECD explicitly warns about comparability issues. In some countries, subsidised rental housing may be classified under private rent due to data limitations, and co-operative housing is in most cases grouped under owner-occupancy.
- Changes over time can partly reflect reclassification, survey design, or source changes, not only genuine shifts in national tenure behaviour.
- The EU-wide 2024 figure from Eurostat is included only as contextual background and is not mixed into the country ranking because Eurostat’s headline tenure statistic is person-based rather than household-based.
FAQ
Is a high home ownership rate always a good sign?
No. It can reflect durable household wealth, but it can also reflect weak rental alternatives, historic privatisation, inherited housing, or limited mobility. A high ownership rate does not by itself prove that homes are affordable, modern, or evenly distributed across generations.
What is the difference between outright ownership and ownership with a mortgage?
Outright owners hold their home without an outstanding housing loan. Owners with mortgage still own the home, but finance it through debt. The mix matters because a country dominated by outright ownership often looks very different from a country where home ownership is built through broad mortgage access.
Why can a country have high ownership but poor affordability in cities?
Because national tenure structure and urban entry affordability are different questions. A country may have many older outright owners while first-time buyers in the capital face very high price-to-income ratios, tight supply, and expensive credit.
Why is renting more common in some wealthy countries?
In countries such as Switzerland or Germany, renting is more institutionalised and can be a stable long-term choice. Strong tenant rights, deeper rental supply, and better labour mobility can keep ownership below the levels seen in more ownership-centred systems.
Does home ownership rate measure housing quality?
No. It says nothing on its own about housing quality, energy efficiency, age of stock, overcrowding, repair needs, or location quality. A high ownership country can still have ageing dwellings or weak rental and renovation systems.
Why is this page based on “latest available data” instead of a strict 2025 ranking?
Because official comparable tenure data are patchier than macro indicators like GDP or debt. Using the latest comparable official wave is more honest than pretending there is a clean global 2025 dataset when there is not.