
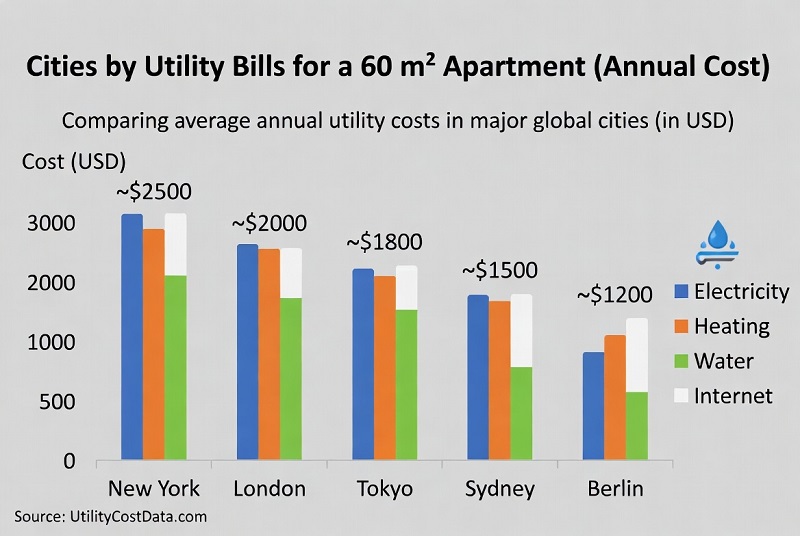
Top 100 Cities by Utility Bills for a
Updated: February 26, 2026 Utility bills are one of the least predictable “fixed” costs of living in a rented or
Updated: February 26, 2026 Utility bills are one of the least predictable “fixed” costs of living in a rented or

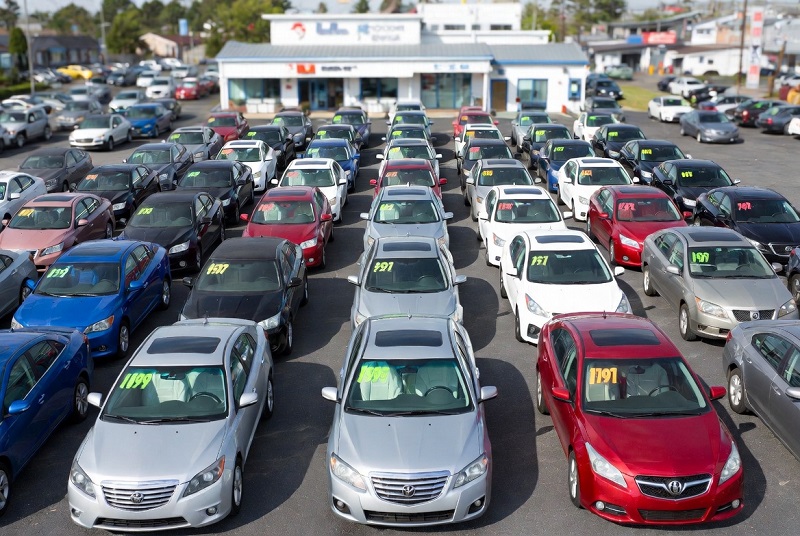
Global vehicle fleet age • safety • ownership cost Oldest car fleets: where “old vehicles” dominate — and why it
United States · Calendar year 2025 · Passenger cars & SUVs (fuel-focused) Top-selling brands by passenger car & SUV sales

All-in-one page — Part 1/3 Sales snapshot (unit sales) — by year, half-year, and region This section summarizes Mercedes-Benz unit
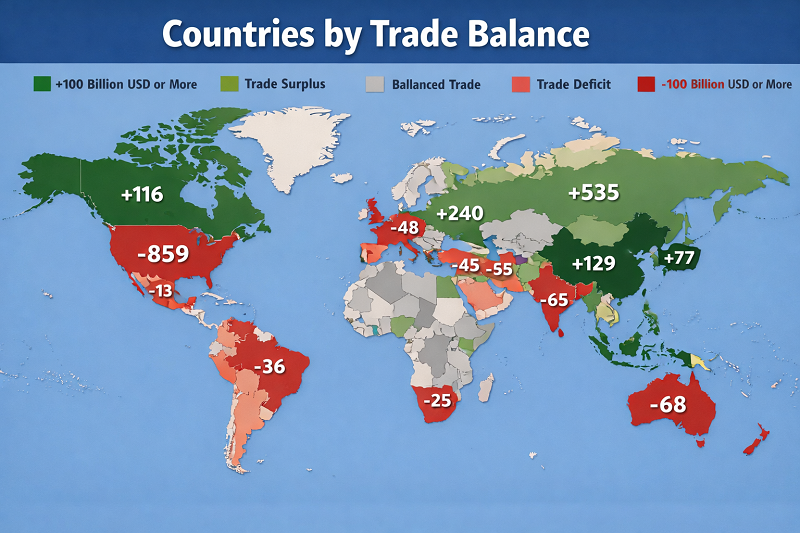
Metric: Trade balance (net exports), current USD Proxy year: 2023 (latest widely available) Extracted: February 16, 2026 Trade balance snapshot
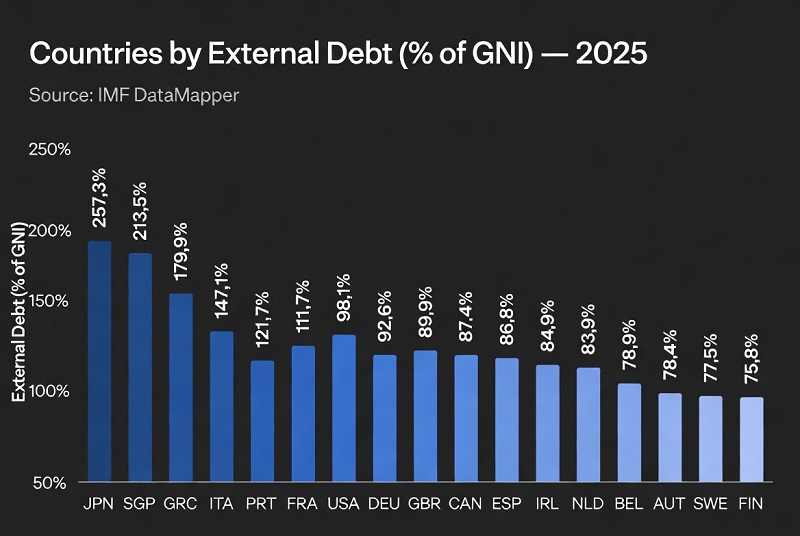
External debt snapshot (2025, using latest available year as proxy) What this ranking measures This ranking compares economies by external
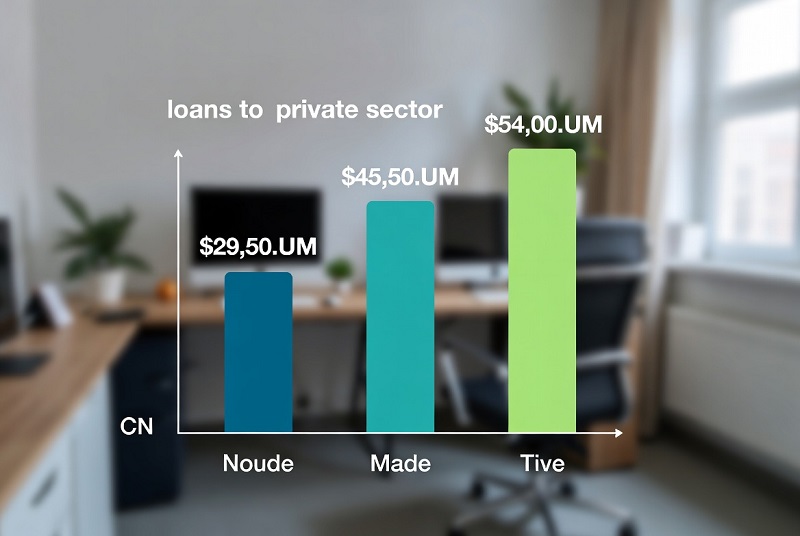
Private credit depth (bank lending to the private sector) This benchmark tracks how large bank credit to households and non-financial

Metric: Interest payments (% of revenue) Snapshot: latest available year (often 2022–2024) Coverage: government reporting varies by country When interest

What this ranking measures Inflation volatility is a practical way to describe how unpredictable price growth is. Instead of focusing
External sector · Balance of payments Countries by current account balance (% of GDP) — 2025 snapshot (latest full-year data
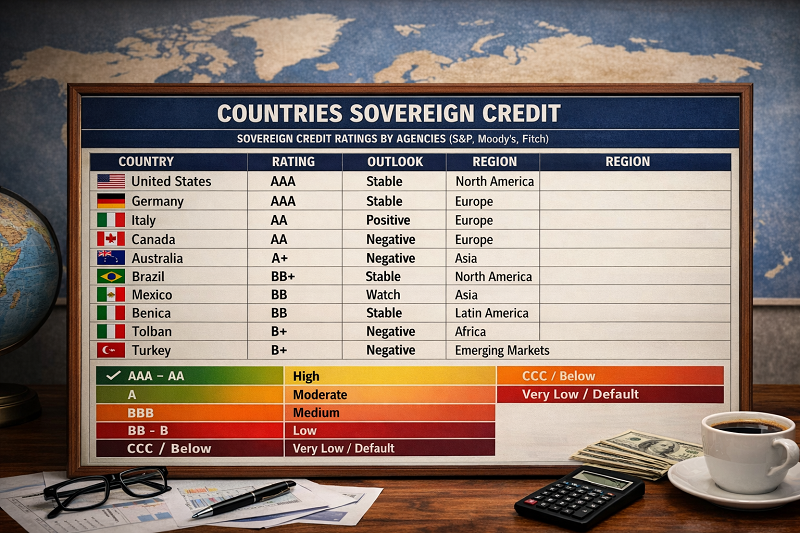
Snapshot date: February 15, 2026 Score: 0–100 (higher = stronger) Focus: long-term sovereign ratings (foreign-currency where available) What this ranking measures A sovereign

Finance · Macroeconomics · Reserve Assets Countries by Foreign Exchange Reserves — 2025 Ranking StatRanker Editorial March 26, 2026 Data:
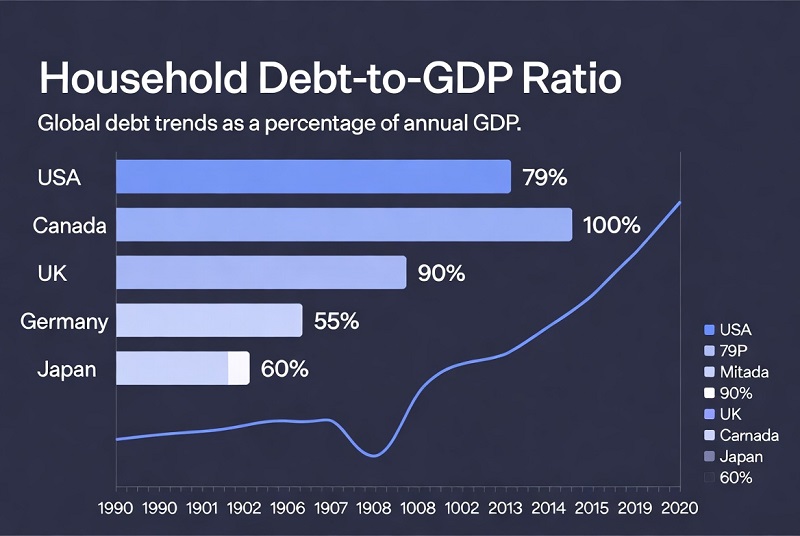
Metric: Household debt / GDP Unit: % of GDP Snapshot: 2025 (latest available quarter, BIS) Reference: Q2 2025 (end-of-quarter) What
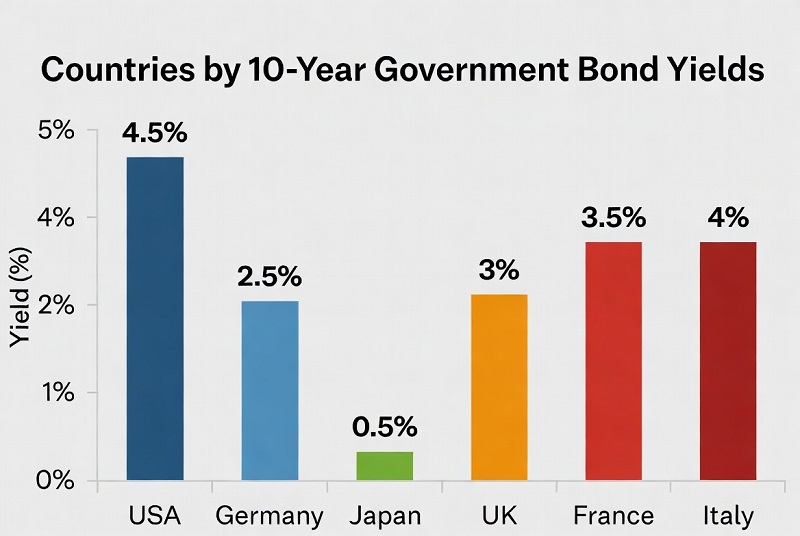
Sovereign yields · highest borrowing costs Countries by 10-year government bond yields (latest snapshot) A 10-year government bond yield is
Global FX · Depreciation vs USD · 2025–2026 Currency Depreciation vs USD (YoY): Worst Performing Currencies This ranking tracks year-over-year
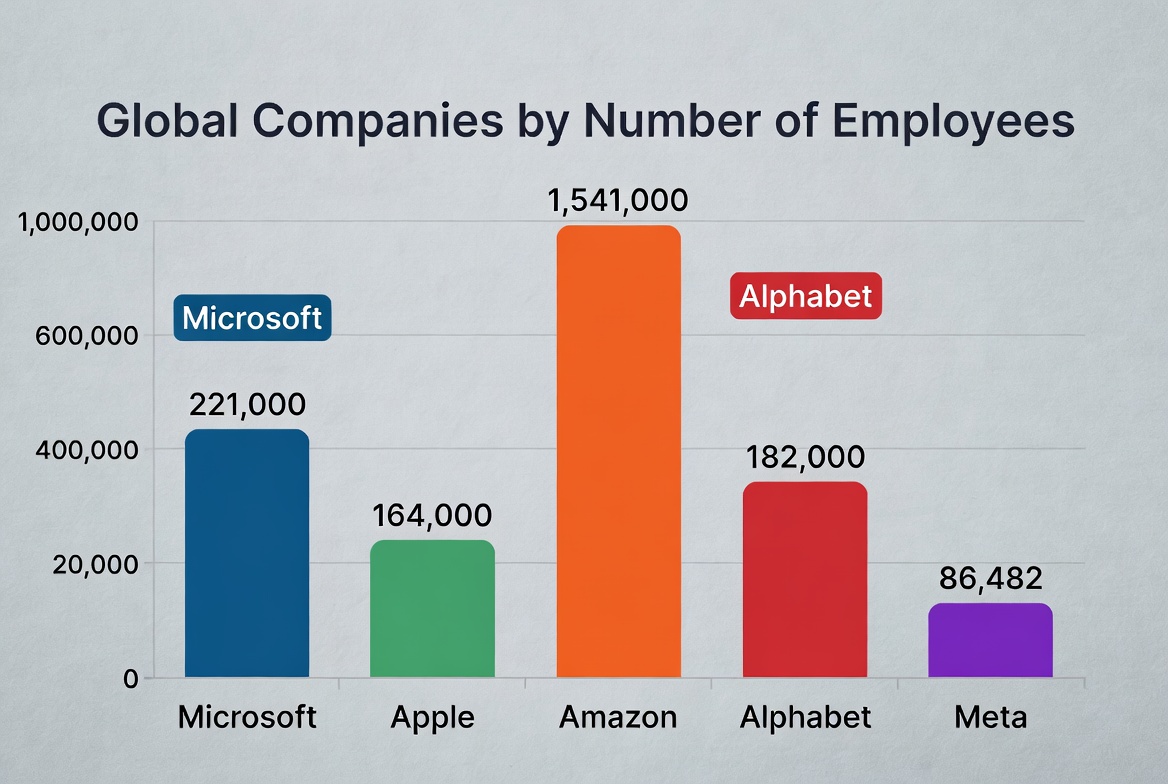
Largest employers • global public-company snapshot Employee headcount is a pure scale signal. It captures operating footprint, service capacity, and
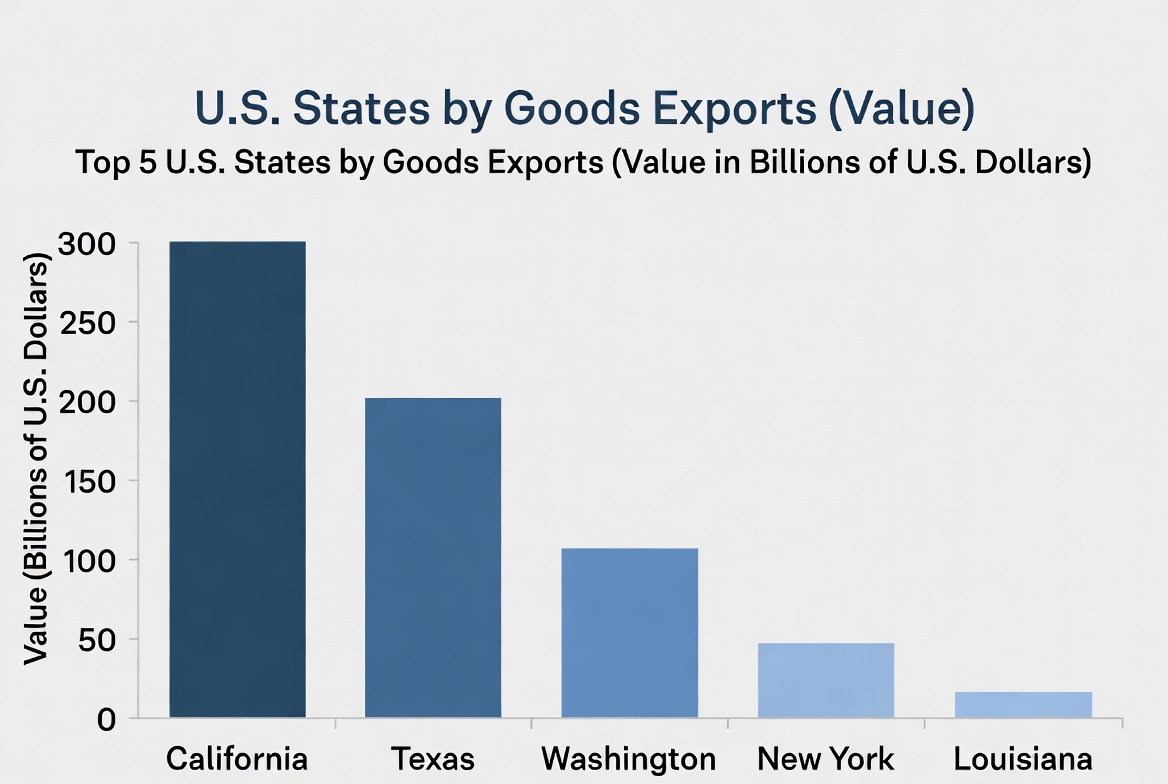
Ranking • State trade Metric: Goods exports (origin of movement) Latest full year in this snapshot: 2024 Units: USD billions (nominal) Updated: 2026-02-05 Where U.S. goods
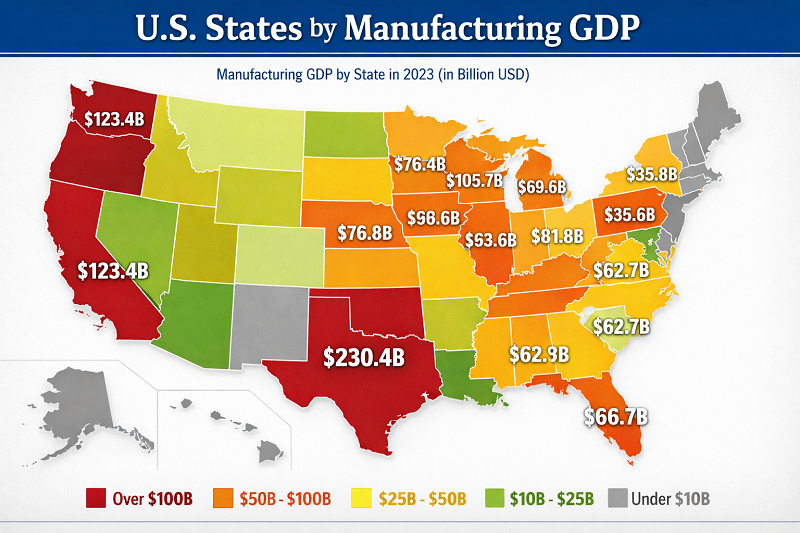
Ranking • Production focus Manufacturing GDP by state: where real output is concentrated (latest year: 2024) Metric: Manufacturing GDP (NAICS
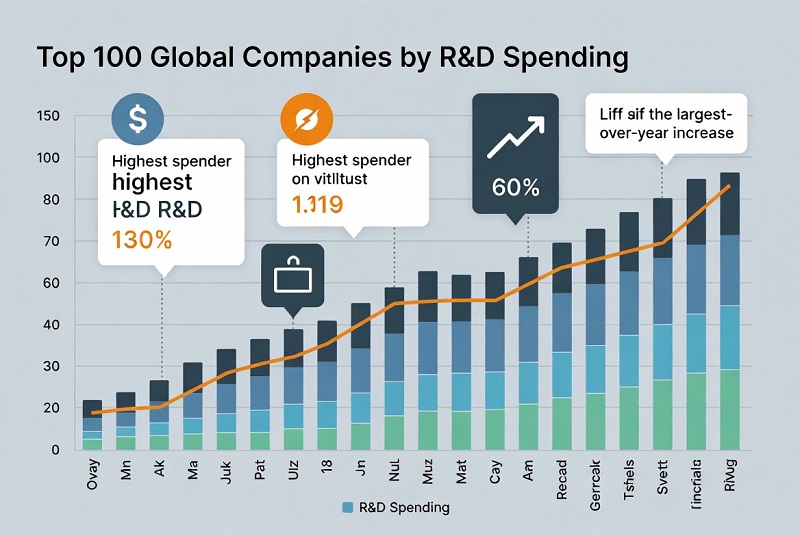
Corporate R&D investment: who spends the most (FY2024) This page ranks the largest corporate investors in research and development using
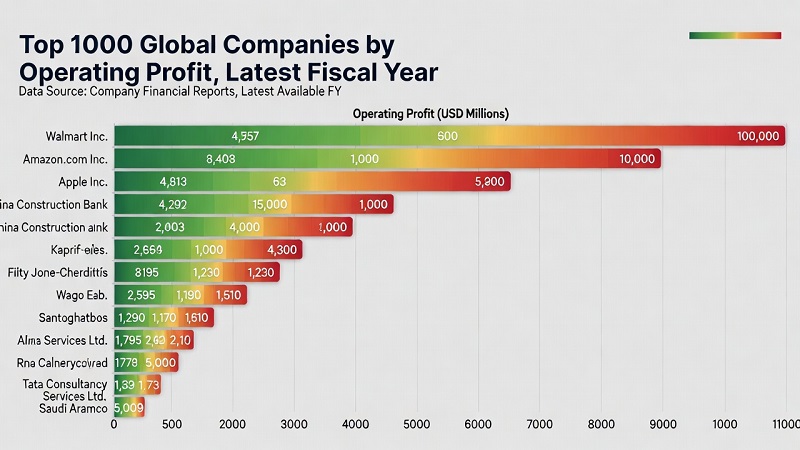
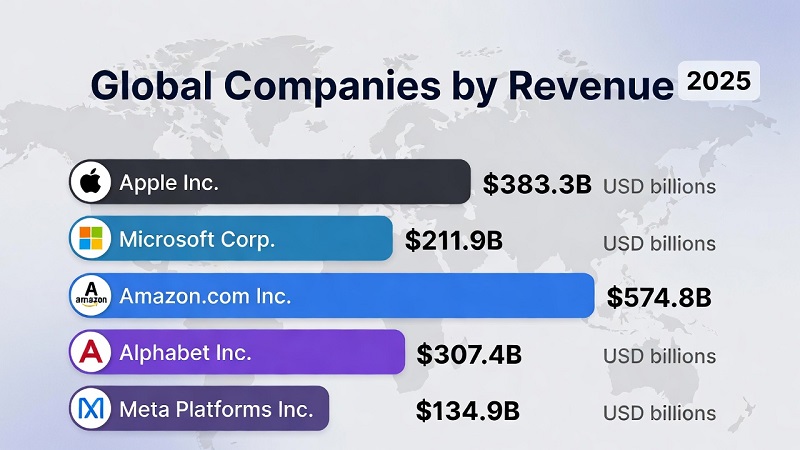
Most profitable companies • Operating profit (EBIT-style) • Latest FY in Scoreboard dataset • Updated: 2026-01-29 This ranking orders the
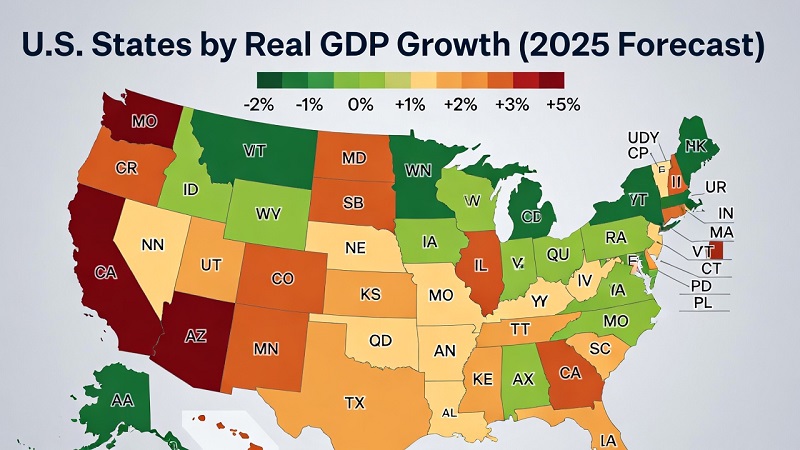
BEA • Real GDP (chained dollars) Quarterly Percent change at annual rate (SAAR) Revisions possible Last updated: January 28, 2026
Disclaimer. This page is for educational use only and is not investment, financial, legal, or tax advice. Markets are volatile,
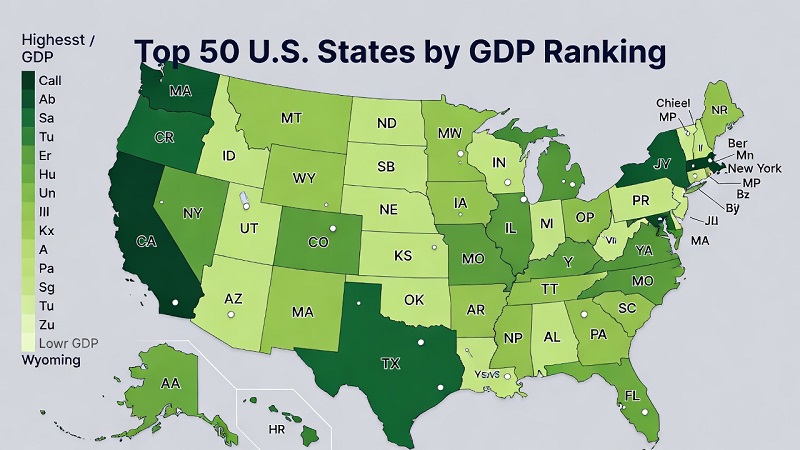
Economy · 2026 Update (2024 preliminary data) This ranking uses current-dollar (nominal) gross domestic product by state from the U.S.

Global auto market ranking • Country totals • Unit-based comparison New vehicle sales by market provide a consistent, unit-based view

Cities, Urban Life & Quality of Living Economy & Living Standards Reference: 2025 edition This ranking shows where renting is

Digital, Innovation & Knowledge Economy Indicator: Mobile data cost Unit: USD per 1GB (standardized) Year: 2025 Coverage: 200+ economies (ranked

Economy · Wages and incomes of the population Updated: January 18, 2026 Metric: median household income Scope: 50 states (excludes
