

Тop 10 Cashew-Producing Countries in 2025
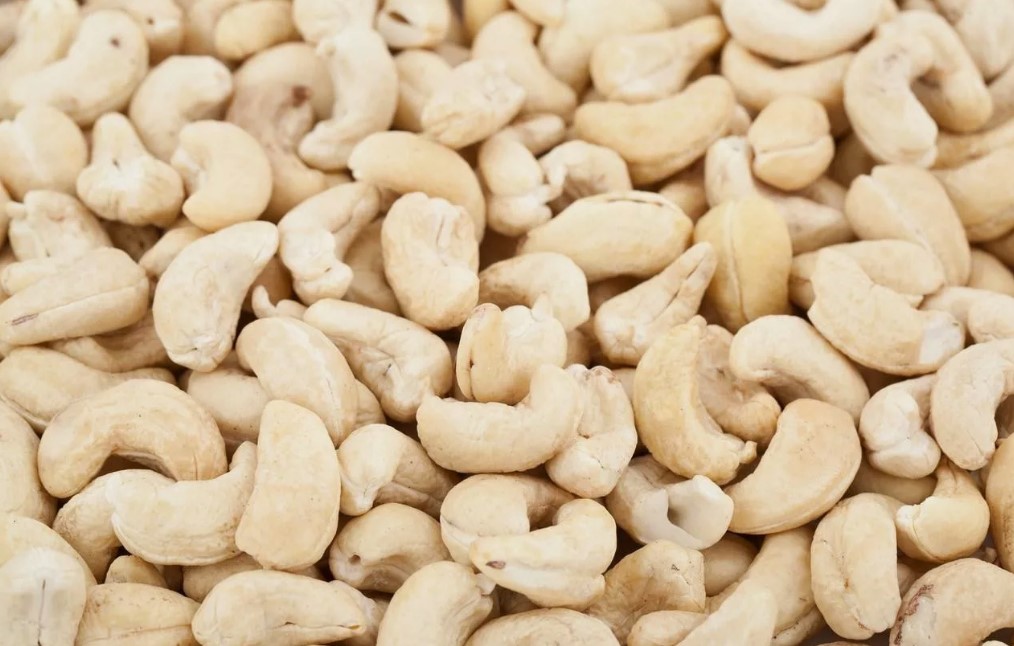
2025 Cashew Production Ranking at a Glance
Côte d’Ivoire ranks first among the world’s leading cashew-producing countries with 944,673 tonnes of cashew nuts in shell, followed by India with 794,910 tonnes and the United Republic of Tanzania with 528,262 tonnes. The ranking uses FAOSTAT production quantities and sorts countries from highest to lowest output.
FAOSTAT’s current crop-production dataset covers through 2024, so this 2025 ranking uses the latest year covered by that dataset rather than estimating 2025 production. The metric is harvested production of “Cashew nuts, in shell,” measured in tonnes.
Coverage: 10 countries. Primary numeric source: FAOSTAT. Direction: higher production ranks higher. Data-pack status: 10 official_value rows because all displayed quantities are directly published in the official FAOSTAT dataset; within those rows, FAOSTAT flags Ghana and Burkina Faso as imputed observations.
Côte d’Ivoire ranks first in the 2024 FAOSTAT production data used for this snapshot.
Indonesia closes the confirmed Top 10.
Exactly ten confirmed production rows are included.
Harvested cashew nuts in shell, not processed kernel output.
Used as the latest FAOSTAT year for this 2025 ranking snapshot.
Eight rows have no imputation flag in the verified table; Ghana and Burkina Faso carry FAOSTAT flag I.
What the Ranking Measures
FAOSTAT defines crop production as harvested production expressed in basic-product weight. For this ranking, that means tonnes of cashew nuts in shell rather than the weight of edible kernels after shelling and processing.
Production and processing should not be treated as the same indicator. Raw cashew nuts can cross borders before shelling, so a country can rank highly in harvested output without holding the same position in processed-kernel production or exports.
Six countries in the Top 10 are in Africa: Côte d’Ivoire, Tanzania, Ghana, Benin, Burkina Faso and Mozambique. India, Viet Nam and Indonesia represent Asia, while Brazil represents South America.
Top 10 Cashew-Producing Countries
Côte d’Ivoire and India occupy the top two positions, while Tanzania ranks third. The table below shows all ten countries before the methodology and supporting analysis.
Cashew nuts in shell production, 2024 FAOSTAT data used for the 2025 snapshot
| Rank | Entity | Production | Region / note |
|---|---|---|---|
| 1 | Côte d’Ivoire | 944,673 t | West Africa; FAOSTAT 2024. |
| 2 | India | 794,910 t | South Asia; FAOSTAT 2024. |
| 3 | United Republic of Tanzania | 528,262 t | East Africa; FAOSTAT 2024. |
| 4 | Viet Nam | 306,185 t | Southeast Asia; FAOSTAT 2024. |
| 5 | Ghana | 218,576 t | West Africa; FAOSTAT 2024. I · imputed by FAO |
| 6 | Benin | 212,624 t | West Africa; FAOSTAT 2024. |
| 7 | Brazil | 159,212 t | South America; FAOSTAT 2024. |
| 8 | Burkina Faso | 147,617 t | West Africa; FAOSTAT 2024. I · imputed by FAO |
| 9 | Mozambique | 142,250 t | East Africa; FAOSTAT 2024. |
| 10 | Indonesia | 141,305 t | Southeast Asia; FAOSTAT 2024. |
Rank is calculated from raw production tonnes in descending order. Ghana and Burkina Faso are retained because FAOSTAT publishes values for both countries, but their imputation flags are disclosed separately.
Chart: Top 10 Cashew Producers
The chart uses the same production values as the tables. Côte d’Ivoire is the reference maximum at 944,673 tonnes.
Methodology
The metric is FAOSTAT production of “Cashew nuts, in shell,” measured in tonnes. The 2024 values are sorted from highest to lowest to create the 2025 snapshot. No 2025 production estimate or projection is added.
Metric and unit
Harvested production of cashew nuts in shell, expressed in tonnes of basic-product weight.
Ranking direction
Descending. Countries with larger raw production quantities rank higher.
Year logic
The current FAOSTAT crop-production dataset covers through 2024. That year is used as the source year for this 2025 ranking snapshot.
Primary source
FAOSTAT is the controlling numeric source. Supporting sources are used to verify definitions, coverage and row-level presentation, not to replace FAOSTAT values.
Observation flags
FAO states that when neither official nor other source data are available, values may be imputed and flagged accordingly. Ghana and Burkina Faso carry the “I” flag in the verified 2024 table.
Missing values and conflicts
No missing value is replaced by a page-generated estimate, and conflicting figures are not averaged.
Status interpretation
The page uses official_value for values directly published in FAOSTAT. That status is separate from FAOSTAT’s own data-quality flags, so an official_value row can still be identified by FAO as imputed.
What is excluded
Harvested area, yield, kernel output, processing capacity, exports, prices and farm income are not part of the ranking.
FAO’s metadata states that production is harvested production and includes marketed quantities, quantities consumed directly on the farm, on-holding losses and wastage associated with harvested output. FAO also notes that production data can originate from surveys, administrative records and expert-based estimates, which affects comparability across countries.
The chart is a visual transformation only: each bar equals the country’s raw production value divided by the leader’s 944,673 tonnes. The ranking itself uses the unmodified source quantities.
Detailed Ranking and Source Notes
The detailed table keeps the same Top 10 values while adding source-year, region and data-quality notes.
Top 10 countries by FAOSTAT cashew nuts in shell production
| Rank | Entity | Production | Source / method note |
|---|---|---|---|
| 1 | Côte d’Ivoire | 944,673 t | West Africa; FAOSTAT source year 2024; 2025 snapshot; direct published production value. |
| 2 | India | 794,910 t | South Asia; FAOSTAT source year 2024; 2025 snapshot; direct published production value. |
| 3 | United Republic of Tanzania | 528,262 t | East Africa; FAOSTAT source year 2024; 2025 snapshot; direct published production value. |
| 4 | Viet Nam | 306,185 t | Southeast Asia; FAOSTAT source year 2024; 2025 snapshot; direct published production value. |
| 5 | Ghana | 218,576 t | West Africa; FAOSTAT source year 2024; 2025 snapshot; published value with source flag I. Imputed by FAO |
| 6 | Benin | 212,624 t | West Africa; FAOSTAT source year 2024; 2025 snapshot; direct published production value. |
| 7 | Brazil | 159,212 t | South America; FAOSTAT source year 2024; 2025 snapshot; direct published production value. |
| 8 | Burkina Faso | 147,617 t | West Africa; FAOSTAT source year 2024; 2025 snapshot; published value with source flag I. Imputed by FAO |
| 9 | Mozambique | 142,250 t | East Africa; FAOSTAT source year 2024; 2025 snapshot; direct published production value. |
| 10 | Indonesia | 141,305 t | Southeast Asia; FAOSTAT source year 2024; 2025 snapshot; direct published production value. |
All ten ranking values use the same metric, source year and unit. Ghana and Burkina Faso remain in the ranking but are explicitly separated from unflagged observations because their FAOSTAT values are imputed.
Insights From the Top 10
Key Insight
Côte d’Ivoire leads India by 149,763 tonnes, giving the two countries clearly separated first and second positions.
Notable Pattern
Tanzania’s 528,262 tonnes are 222,077 tonnes above Viet Nam, creating the largest adjacent gap outside the top two.
Regional Concentration
African countries occupy six of the ten positions: four in West Africa and two in East Africa.
Closest Cluster
Brazil, Burkina Faso, Mozambique and Indonesia are separated by only 17,907 tonnes from seventh to tenth place.
What the Ranking Means
The ranking measures agricultural production scale, not processing capacity or international trade. A high position means a country harvested a large quantity of cashew nuts in shell in the source year.
Raw nuts can be exported and processed elsewhere, so production rankings should not be substituted for rankings of shelled kernels, processing capacity or export value.
Data quality also matters when comparing close positions. Ghana and Burkina Faso are identifiable exceptions because FAOSTAT’s published figures are flagged as imputed rather than ordinary unflagged observations.
Download the Тop 10 Cashew-Producing Countries in 2025 dataset
Тop 10 Cashew-Producing Countries in 2025
10 ranked entries · Excel + CSV + methodology + sources + chart · Snapshot: 2025 snapshot based on 2024 production dataset; row source years preserved: 2024 · Version 1.0
No signup required. The archive includes machine-readable data, methodology and source documentation. Quick human verification is required before the ZIP is delivered.
Download Excel + CSV Data PackFAQ
Which country produces the most cashews?
Côte d’Ivoire ranks first in the source data with 944,673 tonnes of cashew nuts in shell in 2024.
Are these actual 2025 production figures?
No. The current FAOSTAT crop-production dataset covers through 2024. This is a 2025 ranking snapshot using those 2024 production values, not an estimate of 2025 output.
What exactly is being measured?
The metric is harvested production of cashew nuts in shell, expressed in tonnes of basic-product weight.
Are all ten observations reported in the same way?
No. All ten quantities are published in FAOSTAT, but Ghana and Burkina Faso carry FAOSTAT’s “I” flag, indicating that the observations are imputed by FAO.
Why are Ghana and Burkina Faso still included?
FAOSTAT publishes production quantities for both countries for 2024. They are included with the imputation status disclosed rather than silently removed or treated as ordinary unflagged observations.
Does this ranking measure edible cashew kernels?
No. It measures nuts in shell before processing. Shelled-kernel output is a different metric.
Is cashew production the same as cashew exports?
No. Production measures harvested output, while trade data measure cross-border flows. Raw nuts can be produced in one country and processed or re-exported through another.
How is the ranking calculated?
The 2024 production quantities are sorted from highest to lowest. No forecast, weighted score or additional ranking formula is applied.
Sources
FAO Data Catalog — Crop Production, Yield and Harvested Area
Official FAOSTAT dataset metadata. It defines production as harvested production in basic-product weight, gives production in tonnes, states time coverage through 2024 and explains FAO’s data-lineage and imputation practices.
Purpose: controlling source for metric, unit, coverage, methodology and data-quality rules.
https://data.fao.org/catalog/iso/d24a448b-3b62-4c09-8c1d-4a39bb599876
FAOSTAT — Crops and Livestock Products
Official FAOSTAT dissemination environment for crop and livestock production statistics, including cashew nuts in shell.
Purpose: primary official database environment for the country production values.
Commodity Origins — Cashews
Secondary FAOSTAT-based reproduction of the 2024 cashew table showing the same Top 10 values and the “I” markers attached to Ghana and Burkina Faso.
Purpose: independent row-level cross-check of ordering, quantities and visible imputation markers; not used to replace FAOSTAT as the numeric authority.
Our World in Data — Cashew Nut Production
FAO-based series identifying the metric as cashew-nut production in tonnes and providing an additional check on the FAOSTAT production series and latest-year coverage.
Purpose: secondary verification of series definition and temporal coverage.
Related rankings
Closely related StatRanker pages selected by topic. If no strong match exists, fewer links are shown instead of unrelated recommendations.
