

TOP 10 Countries by Irrigated Farmland Share (2025)
WATER · IRRIGATED FARMLAND SHARE 2025
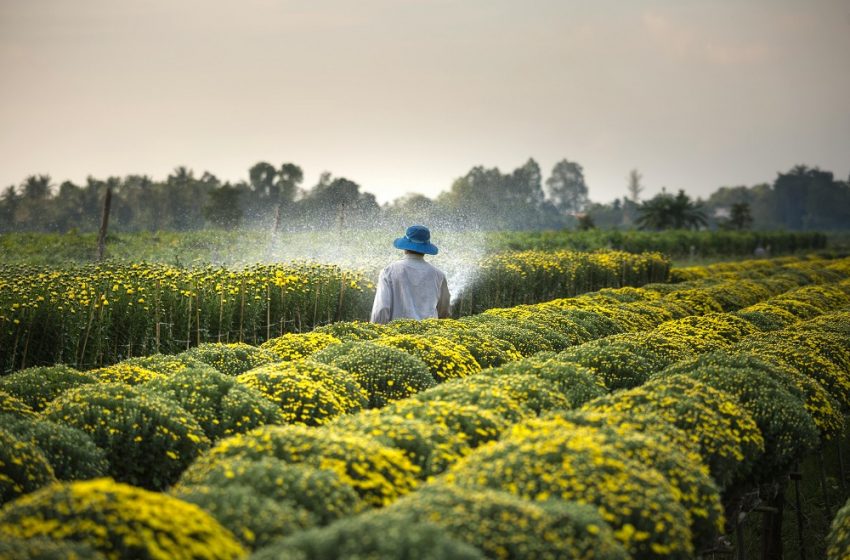
Irrigation turns uncertain rainfall into reliable harvests, but it also drives very high water withdrawals. Looking at the share of agricultural land which is irrigated reveals countries where farming is most dependent on managed water supplies, with direct implications for food security and water stress.
According to FAO and World Bank data, only a minority of the world’s farmland is irrigated, but it accounts for a large share of global crop value and around four-fifths of water withdrawals in many regions. Irrigated land ranges from just a few percent of cropped area in parts of Africa to more than 40 percent in South Asia, with countries such as India and China holding some of the largest irrigated areas worldwide.
This article builds a compact 2025 snapshot for StatRanker dashboards, showing where irrigation dominates farmland and how that connects to water-stress risks. Values are rounded and indicative, aligned with FAO/World Bank ranges rather than exact figures for any single year.
What “irrigated farmland share” actually measures
In FAO and World Bank statistics, agricultural irrigated land is the share of agricultural land purposely provided with water, including land irrigated by controlled flooding, sprinklers or drip systems. The underlying indicator (AG.LND.IRIG.AG.ZS) expresses irrigated area as a percentage of total agricultural land.
In this article we treat “irrigated farmland share” as:
- the percentage of agricultural land equipped for and used with irrigation,
- aggregated at country level, and
- based mainly on FAO/World Bank series processed by Our World in Data.
High irrigated shares usually imply:
- significant investments in canals, pumps and on-farm infrastructure,
- strong dependence of crop yields on water-allocation decisions and energy prices, and
- potential exposure to water stress if renewable water resources are limited.
However, the indicator is area-based. It does not directly capture how much water is used, how efficient irrigation systems are, or how equitably water is allocated between farms, cities and ecosystems.
How the 2025 irrigation-share ranking was built
The ranking below combines the latest available values of agricultural irrigated land (% of agricultural land) with qualitative information on water stress. Because FAOSTAT and World Development Indicators are updated with a lag, “2025” refers to the most recent data window (roughly 2018–2021) as disseminated in 2025.
- Use FAO/World Bank series on irrigated agricultural land share to identify countries with the highest percentage of farmland under irrigation.
- Exclude very small micro-states and territories where small absolute areas drive extreme percentages but have limited weight in global food and water-security debates.
- Add a qualitative water-stress level (medium, high, very high) based on global water-risk assessments and regional FAO/OECD outlooks.
All percentages are rounded and should be read as illustrative bands consistent with FAO / World Bank ranges and secondary compilers, not as an official league table. For precise country values, users should query the original datasets directly.
Top 10 countries by irrigated farmland share (2025 snapshot)
To stay readable on mobile, the table uses four columns and allows text wrapping instead of horizontal scrolling. It highlights countries where a very large part of agriculture depends on managed water, often in already water-stressed basins.
| Rank | Country | Irrigated farmland share (% of agricultural land) |
Indicative water-stress level |
|---|---|---|---|
| 1 | Pakistan | 70 | Very high stress in Indus basin; heavy dependence on surface canals and groundwater. |
| 2 | State of Palestine | 65 | Very high local stress; irrigation constrained by limited freshwater and political factors. |
| 3 | United Arab Emirates | 60 | Extreme aridity; irrigation almost entirely from desalinated water and fossil groundwater. |
| 4 | Saudi Arabia | 58 | Very high water stress; centre-pivot irrigation relies on non-renewable aquifers. |
| 5 | Egypt | 57 | High dependence on Nile flows; virtually all cropped land in the Nile Valley and Delta is irrigated. |
| 6 | Bangladesh | 56 | Seasonal monsoon flooding plus intensive dry-season irrigation; pockets of groundwater stress. |
| 7 | India | 52 | Large irrigated area concentrated in water-stressed basins of northwest and parts of the Indo-Gangetic Plain. |
| 8 | Israel | 49 | Highly efficient drip systems but structurally water-scarce; desalination and reuse are key. |
| 9 | Turkmenistan | 47 | Very high stress in Amu Darya basin; historic links to Aral Sea desiccation. |
| 10 | Uzbekistan | 46 | Large irrigated cotton and wheat sectors; high pressure on river flows and drainage systems. |
Percentages refer to irrigated agricultural land as a share of total agricultural land. Values are indicative, aligned with FAO / World Bank series and secondary compilers (e.g. country rankings showing Pakistan above 70% of agricultural land irrigated), but rounded for narrative use.
Reading the geography of irrigation dependence
The Top-10 list looks very different from rankings based on total irrigated area. Instead of China and the United States, the leaders are countries that combine arid climates, intensive irrigation and relatively modest populations. Their farming systems are tightly coupled to river flows, aquifers and large-scale water-management infrastructure.
Arid and semi-arid irrigation hubs
The Gulf countries, Israel and parts of North Africa illustrate an extreme model: natural rainfall is too low or too erratic to sustain intensive cropping, so irrigation becomes the default. In such systems, irrigated shares above 50 percent of agricultural land are common, but they are achieved only by drawing heavily on non-renewable groundwater, desalinated seawater or heavily regulated river flows.
From a food-security perspective, this allows high yields and year-round production of vegetables and fruits. From a water-security perspective, it pushes countries into chronic water stress, making them vulnerable to energy shocks, infrastructure failures and climate-driven shifts in regional hydrology.
Monsoon and delta irrigation systems
In India, Bangladesh, Pakistan and Egypt, the story is different. Rainfall and river flooding do supply large amounts of water, but population density, cropland pressure and the push for multiple harvests per year have led to very high irrigation dependence.
Canals, tubewells and pump sets have spread across the Indo-Gangetic Plain and delta systems, turning seasonal floodplains into intensively farmed landscapes. While this has underpinned major gains in cereal output since the Green Revolution, it has also contributed to declining groundwater tables and basin-level overextraction in several hotspots.
Irrigation, water withdrawals and stress
A small share of land, a large share of withdrawals
Globally, irrigated farmland represents only a fraction of total agricultural land, but it accounts for a very large share of water withdrawals — often around 70–80 percent of total withdrawals in low- and middle-income countries.
This asymmetry explains why the countries at the top of the irrigated-share ranking frequently appear in water-stress maps. Irrigation enables production, but it can also lock economies into water-intensive cropping patterns that are hard to change quickly.
From local efficiency to basin-level sustainability
In policy debates, much attention is paid to on-farm efficiency (for example, switching from flood irrigation to drip or sprinkler). While this can improve yields and equity, its effect on basin-level water stress depends on what happens to the “saved” water: is it left in rivers and aquifers, or used to expand irrigated area and cropping intensity?
For Top-10 irrigation countries, the key question is thus not just “how efficient are farms?” but “what is the cap on total consumptive use in each river basin, and how strictly is it enforced?”.
Chart: irrigated farmland share in the Top-10, 2025 snapshot
The bar chart summarises the ranking visually. All ten countries irrigate a very large share of their agricultural land, typically between about 45 percent and 70 percent. For comparison, the global average is in the single digits.
On mobile, the chart fills the container width and uses dark, high-contrast labels so values stay legible on small screens.
Values represent irrigated agricultural land as a percentage of total agricultural land, consistent with FAO / World Bank definitions. Use original FAOSTAT and WDI series for time-series analysis or precise country comparisons.
What high irrigation shares mean for farmers and planners
Stability of yields vs. fragility of water supplies
For farmers, irrigation reduces the risk of crop failure from erratic rainfall, supports multiple cropping seasons and allows a shift towards higher-value crops such as vegetables and fruits. In many Top-10 countries, the rise of irrigation has been closely linked to gains in cereal yields and rural incomes.
At the same time, the fragility of the underlying water supplies means that yield stability can mask rising long-term risks: salinisation, aquifer depletion, land subsidence and declining river flows, all of which feature prominently in FAO and UN water-risk assessments.
Equity and allocation conflicts
Where irrigation dominates agriculture, allocation decisions become politically sensitive. Rural communities, cities, industry and ecosystems all compete for the same finite resource. In basins without clear rules and robust monitoring, shortages tend to hit smallholders and downstream users first.
High irrigated shares are therefore a signal to look more closely at water-rights systems, pricing policies and conflict-resolution mechanisms, not just the number of hectares under canals or sprinklers.
Policy lessons for irrigation-intensive and import-dependent countries
1. Put basins, not individual schemes, at the centre
For irrigation-intensive economies, the main planning unit has to be the river basin or aquifer. Individual efficiency gains at scheme level are useful only if they translate into reduced consumptive use at basin level. That requires transparent allocation plans, caps on total withdrawals and real-time data on flows and groundwater levels.
2. Align cropping patterns with water realities
Several Top-10 countries still devote large irrigated areas to water-hungry crops such as rice, sugarcane or fodder in severely water-stressed basins. Gradual shifts towards less thirsty, higher-value crops, combined with targeted support for affected farmers, can reduce pressure without abrupt income losses.
3. Protect the most vulnerable users
Smallholder farmers at the tail end of canal systems, as well as rural communities relying on shallow wells, are often the first to feel the impact of over-abstraction and drought. Priority policies include maintaining minimum environmental flows, securing basic water rights and investing in climate-resilient infrastructure that reaches the poorest users.
4. For import-dependent countries: diversify risk
Countries that import a large share of their staple foods rely implicitly on the stability of irrigation systems in grain-exporting regions. Diversifying origins, ports and logistics corridors, combined with modest, well-governed grain reserves, reduces exposure to shocks in any single export basin.
How to interpret irrigated-farmland indicators correctly
Irrigated farmland share is a powerful but narrow metric. A few caveats are crucial when using it in dashboards or policy briefs:
- Time lag and revisions: FAO and World Bank series are updated periodically; a “2025” data point may summarise conditions from several years earlier, sometimes revised as new land-use statistics become available.
- Denominator choice: some series use total agricultural land, others focus on cropland or cultivated land. Comparisons must ensure like-for-like denominators.
- Area vs. volume: a hectare of rice under flood irrigation can consume far more water than a hectare of orchards under drip, even though both count equally in irrigated-area statistics.
- Link to water stress: high irrigated shares often, but not always, correlate with high water stress. Basins with abundant renewable resources can sustain large irrigated areas without approaching critical thresholds, while arid basins can hit limits even at modest irrigated shares.
For robust analysis, irrigated-area indicators should be combined with water-availability, withdrawal, groundwater and environmental-flow metrics, ideally in a transparent, open-data dashboard that can be updated as new FAO and World Bank releases come out.
Primary sources and further reading
The figures and interpretations in this article draw on open, regularly updated datasets and analytical reports on land use, irrigation and water stress. For detailed country values, users should consult:
- FAO — FAOSTAT land and irrigation statistics: global series on land use, agricultural irrigated land and cropland dynamics, including analytical briefs on land statistics and irrigation trends through 2023.
- World Bank / FAO — Agricultural irrigated land (% of total agricultural land): World Development Indicators series AG.LND.IRIG.AG.ZS, the standard source for cross-country data on irrigated farmland share.
- FAO AQUASTAT and drought-preparedness portal: technical notes on irrigated land by region, highlighting the wide range from about 4 percent of cropped area in Africa to over 40 percent in South Asia, and the central role of irrigation in global water withdrawals.
- OECD-FAO Agricultural Outlook & FAO Statistical Yearbook: assessments of medium-term agricultural prospects, water use in agriculture and emerging risks from climate change and resource degradation.
- Secondary rankings of irrigated-land share: compilations based on FAO/WDI data, including country lists where Pakistan, Palestine and others appear at the top of global rankings by irrigated share of agricultural land.
When using this ranking in StatRanker or similar tools, always document the reference years, indicator codes, denominators (agricultural land vs. cropland) and any exclusions of micro-states. This keeps comparisons transparent and makes it easier to refresh the chart when new FAO / World Bank data are released.


