

Top 10 Radish Production Countries in 2025: A Comprehensive Analysis
Radish production in 2025: where global supply is concentrated and why it matters
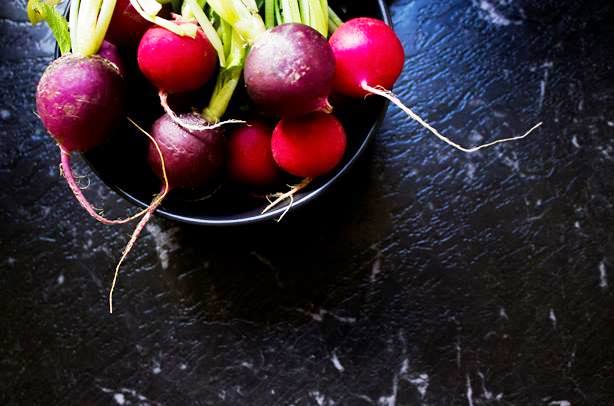
Radishes (Raphanus sativus) include both small, fast-turnover salad radishes and larger daikon-type roots. The crop’s short growing cycle (often measured in weeks rather than months) makes it a flexible option for intensive systems and for filling rotations. The 2025 landscape is shaped by the same forces affecting many vegetables: water and heat stress, rising input costs, greenhouse expansion in high-tech regions, and growing consumer demand for fresh, minimally processed produce.
Top 10 radish-producing countries in 2025 (projected)
Production is heavily Asia-centric: China, Japan, South Korea, and India collectively account for the vast majority of output in this Top 10 list. Europe’s presence is led by Germany, France, Italy, Spain, and the Netherlands (often linked to high-value fresh markets and controlled-environment production), while Canada appears as a smaller but steady contributor focused on domestic supply.
The global anchor of radish supply, supported by scale, intensive vegetable belts, and strong domestic demand across multiple varieties (including daikon-type roots).
High-volume, quality-focused daikon production for a large domestic market, supported by seed innovation and careful post-harvest handling.
Strong domestic pull from processed and fresh uses, with production management increasingly focused on weather volatility and field-to-market efficiency.
Output is supported by multiple agro-climatic zones and staggered planting, with opportunities in fresh markets and higher-quality grading for trade corridors.
European leader within this Top 10 list, with a strong retail pipeline and an emphasis on consistent sizing, freshness, and (in some segments) organic supply.
A stable fresh market where consumer preferences support frequent harvest cycles and consistent quality standards for small-root varieties.
Production includes multiple types (red, black, and specialty roots), with proximity to major European fresh markets shaping commercialization.
Supply benefits from irrigated horticultural regions and export channels for fresh produce, with efficiency improvements increasingly linked to water management.
A smaller producer by volume in this list, but strategically important as a high-tech cultivation and distribution hub for fresh vegetables across Europe.
A modest but steady producer, oriented toward freshness and local-market availability rather than global-scale exports.
Table 1. Top 10 countries by radish production (2025 projection)
Values are in tonnes. “Share of global” uses an approximate global total of 7.0 million tonnes, consistent with the summary estimate used in this article. For precise benchmarking, use the official international database series referenced in the sources section.
| Rank | Country | Production (t) | Share of global (≈) |
|---|---|---|---|
| 1 | China | 3,500,000 | 50.00% |
| 2 | Japan | 1,300,000 | 18.57% |
| 3 | South Korea | 800,000 | 11.43% |
| 4 | India | 600,000 | 8.57% |
| 5 | Germany | 200,000 | 2.86% |
| 6 | France | 150,000 | 2.14% |
| 7 | Italy | 120,000 | 1.71% |
| 8 | Spain | 100,000 | 1.43% |
| 9 | Netherlands | 80,000 | 1.14% |
| 10 | Canada | 15,000 | 0.21% |
Top 10 total: 6,865,000 t (≈98.1% of the 7.0M t global estimate used here). The concentration is a core feature of radish supply: the “center of gravity” is in East and South Asia, with Europe supplying high-value fresh markets and controlled-environment niches.
Chart 1. Production volumes for the Top 10 (2025 projection)
- China — 3,500,000 t
- Japan — 1,300,000 t
- South Korea — 800,000 t
- India — 600,000 t
- Germany — 200,000 t
- France — 150,000 t
- Italy — 120,000 t
- Spain — 100,000 t
- Netherlands — 80,000 t
- Canada — 15,000 t
Volumes are shown in tonnes. Values are projections used to describe the 2025 market structure and may be revised as new official agricultural statistics are released.
Methodology (how this 2025 ranking is constructed)
This page presents a 2025 snapshot using projected production volumes, anchored to the most recent internationally comparable crop-statistics time series and updated with the latest market context. The unit is physical output (tonnes). Where “global share” is shown, it uses an approximate global total of 7.0 million tonnes (the global estimate referenced in the overview), to keep shares interpretable in a single read. Numbers are formatted with thousand separators and rounded to support quick comparison.
Limits: (1) Country figures can be revised as reporting is updated; (2) definitions may differ across national statistical systems (especially where “radish” and “daikon-type” roots are reported under different product groupings); (3) weather shocks can shift annual volumes materially; (4) trade hubs may influence market availability without being top producers. For rigorous analysis, treat the ranking as a structured summary and validate against the source databases listed in Part 3.
Insights (what the 2025 production map reveals)
Three patterns stand out. First, radish supply is unusually concentrated: one country (China) accounts for about half of the global estimate used here, while the Top 4 account for close to 90%. Second, Europe’s footprint in this Top 10 is less about bulk volume and more about high-value fresh-market standards, short-haul logistics, and controlled-environment production where consistency and year-round availability matter. Third, climate and water management increasingly separate stable supply from volatile supply: radishes grow fast, but the system still relies on predictable irrigation, timing, and pest control to avoid abrupt yield losses.
What this means for readers
If you track food prices, retail availability, or supply risks, concentration matters: when output is dominated by a small set of countries, localized disruptions can affect broader market sentiment and trade flows. For growers and agribusiness operators, the competitive frontier is less about “who can grow radishes” and more about quality, consistency, and logistics: uniform sizing, shelf-life, cold chain reliability, and the ability to supply during off-peak periods. For consumers, the biggest differences show up as freshness, variety choice (salad vs daikon), and price volatility during weather shocks.
FAQ: radish production and the 2025 ranking
Scale is the main driver: large vegetable-growing regions, strong domestic demand, and the ability to run multiple planting windows. Radishes also fit well into intensive rotations, which reinforces volume in high-output systems.
In many market summaries they are discussed together because they are the same species with different varieties. In official statistics, reporting can differ: some systems separate product categories, others combine them. This is one reason production tables can vary across sources.
Not necessarily. Radishes are perishable and often consumed domestically. Export strength depends on proximity to markets, cold-chain capacity, packaging standards, and the ability to deliver consistent quality—factors that can favor logistics hubs even if their production volume is smaller.
Water timing, heat management, and pest pressure are the big three. Short cycles mean small mistakes can show up quickly. Controlled environments reduce risk, but they also raise energy and capex requirements.
Shares use the approximate global production estimate (≈7.0M tonnes) stated in this article. The goal is comparability within a single page. For official shares, use the full global dataset from the sources section and recompute shares using the exact global total for the same year and definition.
Weather extremes (drought/heat waves or excessive rainfall), water restrictions, and disease outbreaks can shift annual volumes. Policy changes that affect irrigation, labor availability, or greenhouse energy costs also matter—especially for fresh-market supply chains.
Interactive table: filter and compare Top 10 producers (2025 projection)
All rows are present in the HTML and remain visible without JavaScript. With JavaScript enabled, you can search, filter by region and income group, sort by volume, and switch the value display between tonnes and an approximate share of global production (based on the 7.0M tonnes total used on this page).
Table 2. Top producers (2025 projection)
Column count is kept compact for readability. Income group is available as a filter but not shown as a visible column.
| Rank | Country | Value | Region |
|---|---|---|---|
| 1 | China | 3,500,000 50.00% | Asia |
| 2 | Japan | 1,300,000 18.57% | Asia |
| 3 | South Korea | 800,000 11.43% | Asia |
| 4 | India | 600,000 8.57% | Asia |
| 5 | Germany | 200,000 2.86% | Europe |
| 6 | France | 150,000 2.14% | Europe |
| 7 | Italy | 120,000 1.71% | Europe |
| 8 | Spain | 100,000 1.43% | Europe |
| 9 | Netherlands | 80,000 1.14% | Europe |
| 10 | Canada | 15,000 0.21% | Americas |
Source note: 2025 values are projections used for analytical comparison. Shares are computed against the approximate global total shown above (7,000,000 t). Formatting: tonnes with thousand separators; shares with two decimals.
Interpretation: what the 2025 ranking suggests for markets and supply chains
The 2025 producer map is a clear example of concentration: most output sits in a handful of Asian economies, while Europe’s role in this Top 10 list is shaped by freshness standards, short-haul logistics, and the economics of controlled-environment production. That structure influences how quickly markets respond to shocks: when a large share of supply is produced in the same macro-region, weather and water stress can ripple through availability and pricing more visibly than in more diversified crops.
What to watch in 2025
- Climate volatility: heat spikes and rainfall swings can move planting windows and harvest timing, shifting weekly market supply.
- Water and irrigation constraints: efficiency investments (drip scheduling, soil moisture monitoring) increasingly determine stability.
- Greenhouse economics: energy and input costs can decide how competitive controlled-environment radish supply is versus field production.
- Quality & waste: post-harvest handling, packaging, and cold chain performance often matter as much as yield for commercial outcomes.
A practical takeaway: production volume explains where supply originates, but market influence also depends on logistics, storage, and the ability to deliver consistent grade. This is why smaller-volume hubs can still be strategically important for regional distribution.
Policy and industry takeaways
- Risk management: short-cycle crops benefit from rapid advisory systems (weather, pest alerts) and flexible planting calendars.
- Investment priorities: water efficiency, integrated pest management, and post-harvest infrastructure typically offer the largest stability gains.
- Trade readiness: export viability for radishes is mostly about standards, cold chain, and predictable delivery—not just raw volume.
- Consumer-side impact: quality and freshness improvements often come from supply chain upgrades rather than expanding acreage.
Sources (official and primary references)
For consistent cross-country comparisons, prefer international databases that harmonize definitions and metadata. National sources add detail on varieties, regions, and seasonal patterns.
-
FAO — FAOSTAT (Crops and livestock products): primary international repository for agricultural production time series and metadata.
https://www.fao.org/faostat/ -
Japan — Ministry of Agriculture, Forestry and Fisheries (MAFF): national production and horticulture statistics, including crop-specific reporting.
https://www.maff.go.jp/e/ -
South Korea — Statistics Korea (KOSIS): official statistical portal with agriculture series and regional breakdowns.
https://kosis.kr/eng/ -
India — Ministry of Agriculture & Farmers Welfare: official agriculture statistics, crop area/production reporting, and state-level context.
https://agricoop.gov.in/ -
European Union — Eurostat: harmonized agricultural statistics for EU member states (production and horticulture-related datasets).
https://ec.europa.eu/eurostat/ -
Canada — Statistics Canada: national agriculture datasets and market context for domestic production.
https://www.statcan.gc.ca/en/subjects-start/agriculture
Update note: This page uses projected 2025 volumes provided in the ranking text. For definitive figures, reconcile against the official series for the same year and definition once final releases are published.


