

Global Value Chains in 2026: Who Captures Value from Offshoring, Assembly and Outsourcing
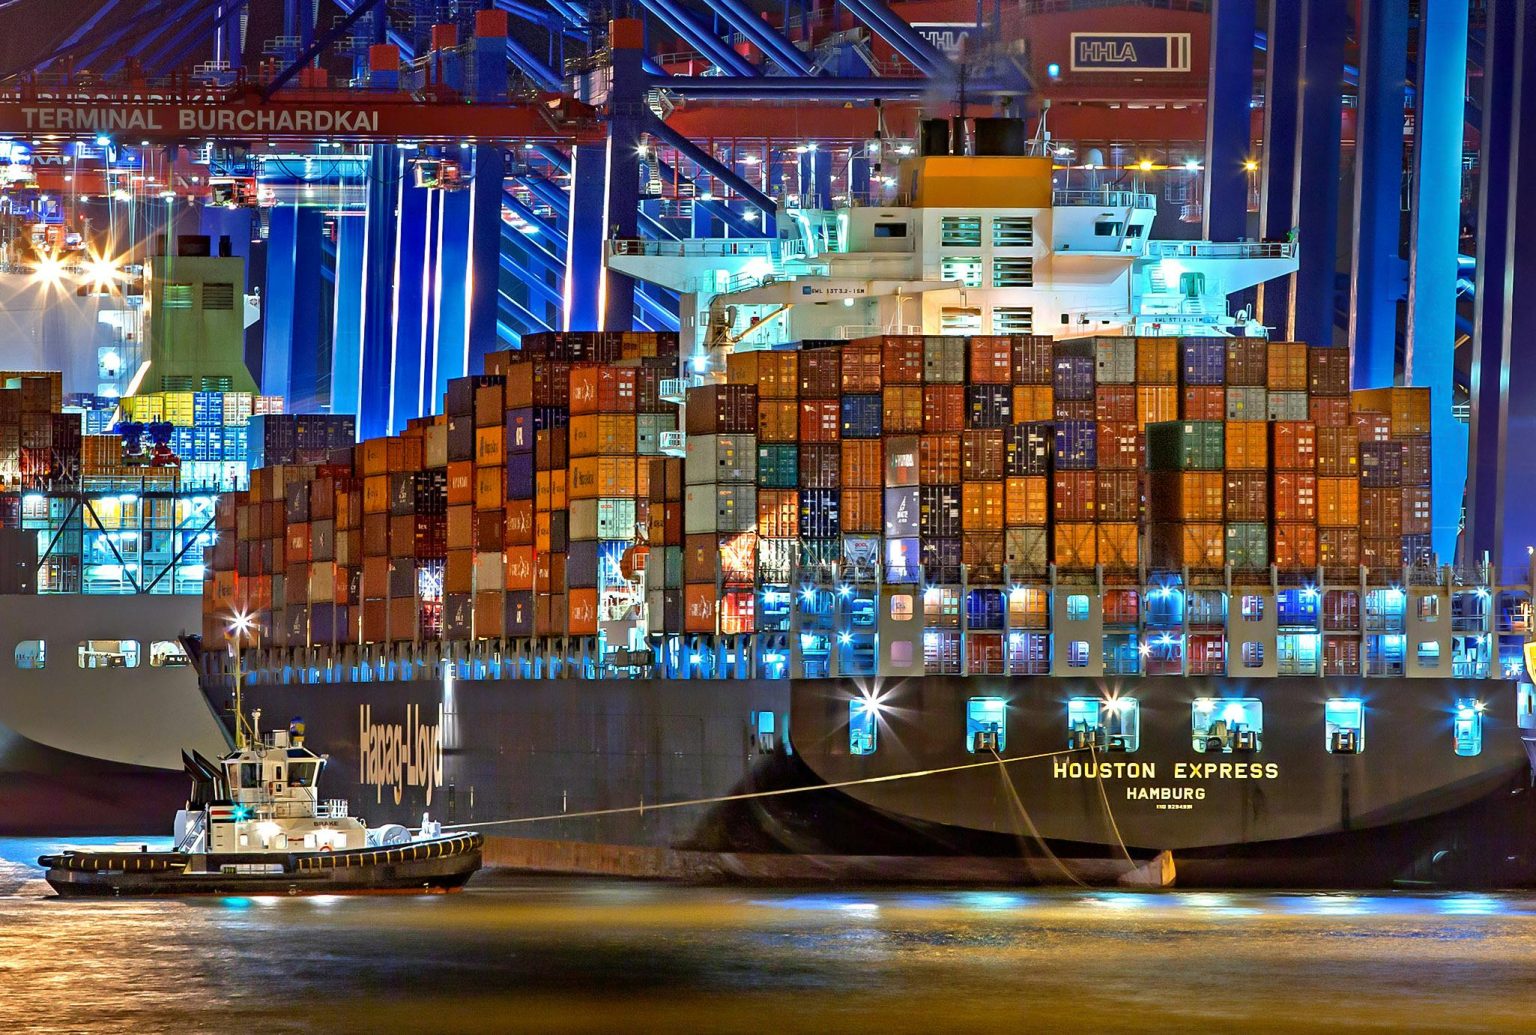
How Global Value Chains Create and Shift Economic Value
Global value chains are the production networks behind much of modern trade. A product may be designed in one country, use components from several others, be assembled somewhere else, and then be sold through global logistics, finance and retail systems. The important question is not only where the final export is shipped from, but where the economic value is actually created.
This 2026 snapshot explains how value is captured across global value-chain roles using public reference sources from the World Bank, OECD Trade in Value Added, the Global Value Chain Development Report and UNCTAD. It focuses on value-added trade, offshoring, outsourcing, assembly, producer services, supply-chain resilience and upgrading pathways.
The core finding is that countries and firms usually capture more value when they control scarce capabilities such as intellectual property, design, advanced components, software, standards, brands, logistics or customer access. Assembly and routine outsourcing can create jobs and export capacity, but long-term gains depend on upgrading into higher-skill and higher-margin functions.
The article explains where value is created inside production networks, not only where final exports are shipped from.
Design, software, standards, advanced components, finance, logistics and brand control tend to carry more bargaining power.
Assembly can scale jobs and exports, but value capture is weaker when imported inputs and buyer-owned designs dominate.
A source-based analytical snapshot built from public GVC, value-added trade and supply-chain research sources.
Overview: gross exports do not show the whole chain
Traditional trade statistics record gross exports and imports when goods and services cross borders. That is useful for measuring trade flows, but it can overstate the role of the final exporter when intermediate inputs cross borders several times before a product reaches the customer.
Trade-in-value-added analysis gives a clearer view by separating the domestic value created in one economy from the foreign inputs embedded in its exports. This matters because the country that performs final assembly is not always the country that captures the largest economic return.
A final assembler may report a large export value while much of the embedded value comes from imported components, foreign-owned intellectual property, software, machinery, industrial standards or brand control. Another economy may appear less visible in final assembly but capture more value through components, patents, engineering, finance or customer-facing services.
For that reason, global value chains should be read as task networks, not only as trade flows. The higher-value positions are usually linked to scarce knowledge, trusted quality, technical standards, logistics capacity, customer access and the ability to coordinate complex production systems.
Value Capture Map Across the Global Production Chain
The map below is a qualitative framework. It shows where bargaining power usually sits inside global value chains and why export volume alone can mislead readers about who benefits most.
Firms that control product architecture, patents, software, technical standards, brand trust or customer relationships can capture value even when production is offshore.
Specialized suppliers can hold strong bargaining power when their inputs are technically complex, hard to substitute or tied to long certification cycles.
Engineering, software, finance, insurance, compliance, logistics and data systems support the chain across borders and can add value at several stages.
Assembly can create jobs, investment and export capacity, but domestic value may stay limited when imported inputs and buyer-owned designs dominate.
Back-office processing, call centers and basic production can be entry points into global markets, but durable gains require a move into specialized services.
Commodity suppliers can benefit from global demand, but earnings are exposed to price cycles unless processing, logistics or downstream capability is added.
Framework Table: GVC Roles and Value-Capture Logic
This framework helps readers interpret how different roles inside a global value chain affect value capture. It is designed for analysis, not for assigning country ranks.
How value is commonly captured inside global value chains
| Stage | Role | Value capture | Source / method note |
|---|---|---|---|
| Upstream | Design, IP and standards | Usually high | Captures value through product architecture, patents, software, standards, brand ownership and buyer relationships. |
| Upstream | Advanced components | Usually high | Specialized suppliers benefit when components are technologically complex, certified, scarce or embedded in long-term production systems. |
| Services | Producer services | Medium to high | Engineering, software, finance, insurance, logistics, compliance and data systems can add value across multiple production stages. |
| Midstream | Contract manufacturing and assembly | Scale dependent | Can generate employment and exports, but domestic value can remain limited if imported inputs and buyer-controlled specifications dominate. |
| Downstream | Branding, retail and customer access | Usually high | Control over customers, distribution channels, after-sales service and brand trust can preserve value even when production is outsourced. |
| Services | Business-process outsourcing | Upgrade dependent | Routine BPO can be a first step; higher value comes from analytics, software, cybersecurity, engineering support and specialized professional services. |
| Risk-sensitive | Nearshoring and regional platforms | Depends on capability | Geopolitical risk and resilience planning can shift production, but durable gains require skilled suppliers, infrastructure and reliable regulation. |
| Risk-sensitive | Raw materials and commodity inputs | Price exposed | Commodity links may benefit from global demand, but value capture is volatile without processing, logistics, technology or downstream integration. |
The table is a qualitative framework compiled from open reference sources. It does not publish country scores, ranks, forecasts or synthetic 2026 values.
Methodology
This article uses a qualitative source-based framework rather than a country ranking. A reliable GVC ranking would require a confirmed row-level dataset with country values, units, years, sources and method notes. Because the supplied material does not contain that verified dataset, the article does not publish unsupported country totals or modeled 2026 estimates.
Metric logic
The key concept is value added: the economic value created by a country, firm or industry at a specific stage of production. This differs from gross export value.
Analytical scope
The article explains GVC roles, value capture, offshoring, outsourcing, assembly, producer services and supply-chain resilience. It does not calculate a Top N ranking.
Source hierarchy
Priority is given to international organizations and public statistical frameworks: World Bank, OECD TiVA, ADB/WTO/IDE-JETRO and UNCTAD.
Limits
The framework does not estimate country gains, domestic value-added shares, company margins, employment effects, future growth rates or 2026 forecasts.
The framework separates upstream knowledge functions, advanced inputs, production and assembly, producer services, downstream customer-facing functions and risk-sensitive supply-chain roles. A single economy can occupy several roles at once. For example, it can assemble imported components while also building stronger logistics, engineering, software or supplier capabilities.
The main limitation is that GVC participation is industry-specific. Electronics, automotive, apparel, pharmaceuticals, agribusiness, business services and energy supply chains have different upgrading paths, risks and margins. A single national label such as “assembly economy” or “services economy” is usually too broad.
Insights: Who Benefits Most from Global Value Chains
Key insight
The strongest benefits usually go to actors that control scarce capabilities: intellectual property, design, standards, brand trust, platform access, advanced inputs or specialized services.
Notable pattern
Assembly-led participation is valuable but incomplete. It creates export activity and jobs, yet higher value capture requires domestic suppliers, skilled labor, technology transfer and local service depth.
Regional shift
Geopolitical uncertainty, resilience planning and nearshoring are changing how companies structure supply chains, but relocation alone does not guarantee domestic value-added growth.
Interpretation risk
A country can look central in gross trade statistics while capturing limited value if it mainly performs low-margin assembly with imported components and foreign-owned designs.
What This Means for Policymakers, Firms and Readers
For policymakers, the main lesson is that joining a global value chain is not enough. The development gain comes from moving into tasks that create more domestic value: stronger suppliers, higher standards, engineering, software, logistics, certification, design and specialized services.
For companies, the key issue is bargaining power. Firms that perform replaceable low-margin tasks are exposed to cost pressure and relocation risk. Firms that provide trusted quality, proprietary knowledge, advanced components, delivery reliability or customer access are harder to replace.
For readers comparing countries, export volume should not be treated as proof of who benefits most. A better question is: what share of the value is domestic, who owns the technology and brand, how dependent the chain is on imported inputs, and whether local firms are upgrading over time.
FAQ
What is a global value chain?
A global value chain is a production network where different stages of making, moving, financing, marketing or servicing a product are performed across more than one country.
Why is value added different from gross exports?
Gross exports count the full value of a shipment. Value-added analysis separates the domestic contribution from imported inputs, making it more useful for understanding who actually captures economic value.
Who captures the most value in a global value chain?
Roles linked to intellectual property, software, advanced components, brand control, platforms, finance, logistics and specialized services usually have stronger value-capture potential than routine assembly alone.
Is offshoring the same as outsourcing?
No. Offshoring means moving an activity to another country. Outsourcing means contracting an external firm to perform the activity. A company can offshore without outsourcing, outsource domestically, or do both at the same time.
Why does assembly often capture less value?
Assembly often depends on imported inputs, foreign-owned designs, buyer specifications and externally controlled brands. It can still be valuable, but the highest margins are often elsewhere in the chain.
How can developing countries benefit more from GVCs?
They can increase benefits by upgrading suppliers, improving infrastructure, training skilled workers, meeting international standards, building domestic services and attracting investment that transfers capability rather than only low-cost work.
What changed in global value chains after recent trade shocks?
Companies and governments now pay more attention to resilience, supplier concentration, geopolitical exposure, transport disruption and regional production options. Cost remains important, but risk is now a larger part of supply-chain design.
Why is there no country ranking in this article?
A responsible ranking would require verified country-level values, years, units, sources and method notes for every row. This article explains the value-capture framework without inventing unsupported country values.
Which sources are best for a real GVC ranking?
OECD Trade in Value Added, inter-country input-output tables, World Bank research and specialized GVC datasets are more appropriate than ordinary export tables when the goal is to measure domestic and foreign value added.
What does this article not measure?
It does not measure country-level gains, domestic value-added shares, company profits, labor income, export rankings, employment effects, future growth rates or modeled 2026 forecasts.
Sources
World Bank — World Development Report 2020
Reference source for the development role of global value chains, upgrading, policy requirements and the distinction between GVC participation and durable gains.
OECD — Trade in Value Added
Methodological source for understanding trade in value added and why gross trade flows do not fully show where value is created.
Global Value Chain Development Report 2023
Reference source for resilience, sustainability, trade shocks, semiconductors, energy supply chains and policy issues around GVC restructuring.
https://www.adb.org/publications/global-value-chain-development-report-2023
UNCTAD — Key Statistics and Trends in International Trade 2025
Context source for current trade restructuring, geopolitical tension, trade-pattern shifts and uncertainty affecting global value chains.
https://unctad.org/publication/key-statistics-and-trends-international-trade-2025
