

Manufacturing Value Added per Worker by U.S. State: 2025 Ranking
Manufacturing Value Added per Worker by U.S. State: 2025 Ranking
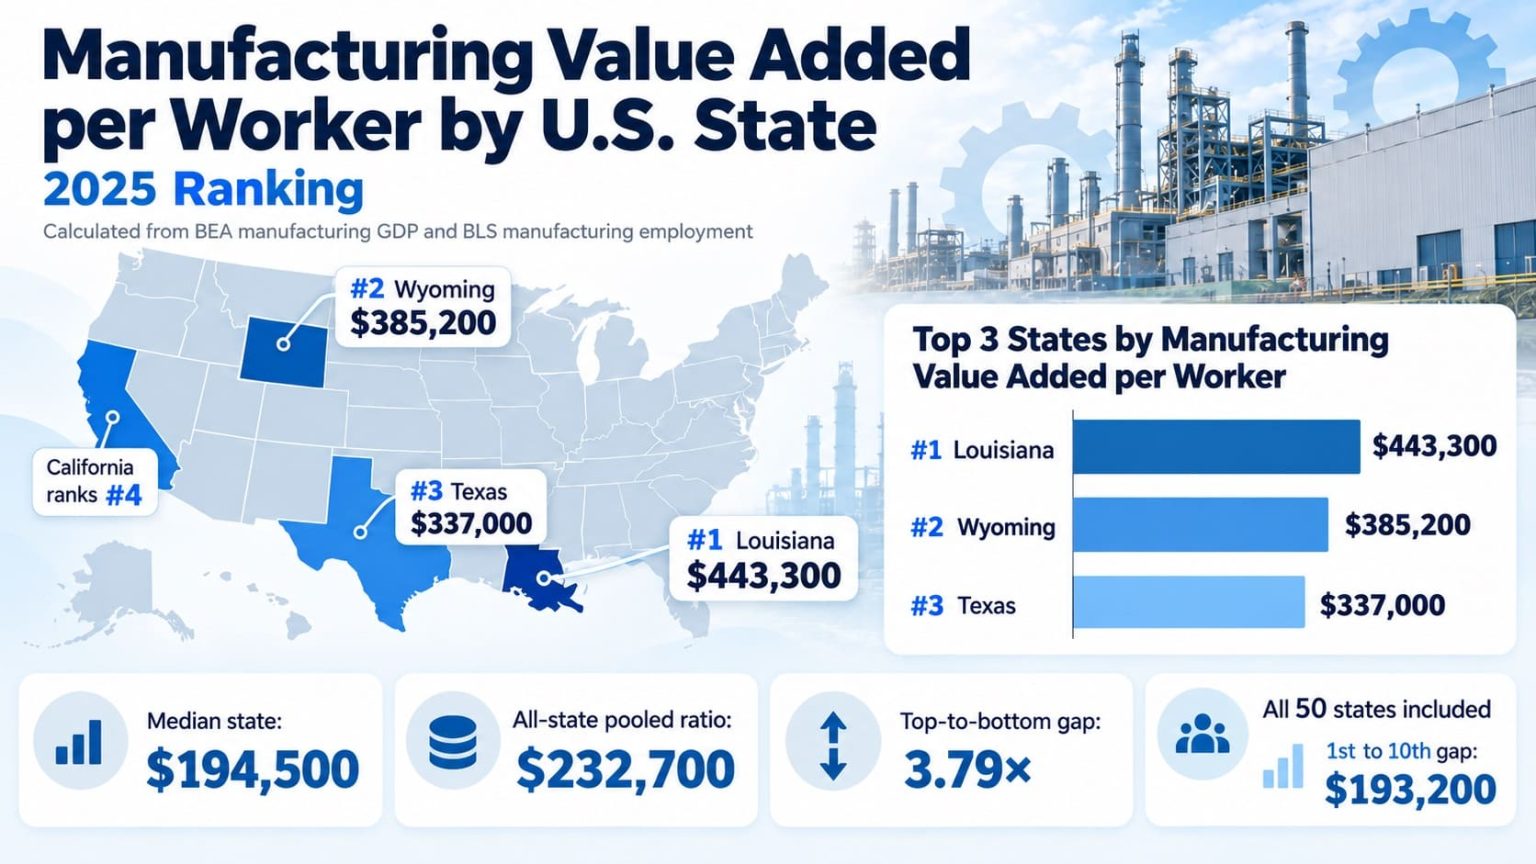
Louisiana ranks first at $443,300 in manufacturing value added per payroll job, followed by Wyoming ($385,200) and Texas ($337,000). This comparison divides each state's 2025 manufacturing GDP in current U.S. dollars by its 2025 annual-average manufacturing payroll employment.
The table is a compiled research dataset based on 2 independent publishing organizations (the U.S. Bureau of Economic Analysis and U.S. Bureau of Labor Statistics), with row-level source and method notes shown in the ranking table. The ranking covers all 50 states, from highest to lowest in nominal U.S. dollars per manufacturing payroll job. Every result is marked calculated_value: the ratios come from observed 2025 inputs rather than forecasts or modeled projections.
Source years: BEA 2025, BLS 2025. BEA release: September 30, 2026. Data checked October 29, 2026. Status counts: 50 calculated_value; 0 official_value for the derived ratio; 0 forecasts. Industry: NAICS 31–33, manufacturing.
Louisiana leads the 50 states in the 2025 comparison.
Alaska has the lowest ratio in the 2025 comparison.
All 50 states have matched 2025 BEA and BLS values; D.C. and territories excluded.
Calculated: $2.930 trillion in BEA manufacturing GDP ÷ 12.588 million BLS payroll jobs, 2025.
Overview: manufacturing scale is not the same as value added per job
Manufacturing value added measures the manufacturing industry's contribution to state GDP: gross output minus purchased intermediate inputs. It includes compensation, operating surplus and relevant production taxes, rather than just employee pay. The calculation on this page expresses that value per manufacturing payroll job, rather than the sector's total size.
California recorded $390.528 billion in manufacturing GDP in 2025, the largest state total, but ranks fourth at $320,200 per payroll job. Louisiana produced $62.325 billion (17th by total manufacturing GDP), yet ranks first at $443,300 per job. The two states show why manufacturing scale and value added relative to payroll employment are different comparisons.
This ratio is not an official BLS labor-productivity index: it is not adjusted for hours worked, inflation, regional prices or industry mix within manufacturing. It is not average wages or value captured by employees alone.
Top 10 states by manufacturing value added per payroll job
Louisiana's $443,300 per payroll job puts it $193,200 above tenth-place Indiana ($250,100). Wyoming ranks second despite having just $4.044 billion in manufacturing GDP, while California ranks fourth with the largest state total. Ranks use unrounded ratios; display values are rounded to the nearest $100.
2025 nominal value added per payroll job · derived from BEA SAGDP2 and BLS CES annual averages
| Rank | State | Value / job | Source / method note |
|---|---|---|---|
| 1 | Louisiana | $443,300 | South; calculated_value; 2025 BEA / 2025 BLS. |
| 2 | Wyoming | $385,200 | West; calculated_value; 2025 BEA / 2025 BLS. |
| 3 | Texas | $337,000 | South; calculated_value; 2025 BEA / 2025 BLS. |
| 4 | California | $320,200 | West; calculated_value; 2025 BEA / 2025 BLS. |
| 5 | Delaware | $316,800 | South; calculated_value; 2025 BEA / 2025 BLS. |
| 6 | Massachusetts | $300,000 | Northeast; calculated_value; 2025 BEA / 2025 BLS. |
| 7 | New Jersey | $299,200 | Northeast; calculated_value; 2025 BEA / 2025 BLS. |
| 8 | Maryland | $272,400 | South; calculated_value; 2025 BEA / 2025 BLS. |
| 9 | Connecticut | $263,100 | Northeast; calculated_value; 2025 BEA / 2025 BLS. |
| 10 | Indiana | $250,100 | Midwest; calculated_value; 2025 BEA / 2025 BLS. |
Chart: Top 20 manufacturing value-added ratios
Each bar shows the 2025 manufacturing GDP per payroll job, on a common scale where Louisiana equals 100%. Bar lengths use the same unrounded calculated figures as the main ranking.
Methodology: source-published inputs and independently calculated ratios
Numerator: manufacturing GDP
BEA annual GDP by state, table SAGDP2, line 12, NAICS 31–33. Official published values for 2025 are in millions of current U.S. dollars. All 50 state values are available; no missing values were filled.
Denominator: payroll employment
BLS State and Area Current Employment Statistics (CES), Table 1, 2025 annual-average all-employee manufacturing payroll jobs, in thousands. These are payroll job counts, not unique people or hours worked.
StatRanker formula
Current-dollar value added per payroll job = BEA manufacturing GDP ($ millions) × 1,000 ÷ BLS manufacturing employment (thousand jobs). Example: Louisiana: 62,325.2 × 1,000 ÷ 140.6 = $443,300 after display rounding.
Time, rank and precision
Both inputs describe calendar year 2025; 2026 denotes this publication snapshot, not a forecast. Ranks are sorted from unrounded ratios, high to low. Dollar labels are rounded to the nearest $100; raw table data attributes retain six decimals.
Coverage and regions
50 states; no District of Columbia, Puerto Rico or other territories. Region labels follow U.S. Census Northeast (9), Midwest (12), South (16) and West (13) groupings; regional labels are context, not additional numeric sources.
Status and revision policy
BEA and BLS publish the GDP and employment inputs, not the per-job ratios. StatRanker assigns calculated_value to all 50 results and recalculates affected rows if either agency revises its 2025 figures.
Source roles and conflicts. BEA is the numerator's numeric source; BLS is the denominator's independent numeric source. Invokely displays the BEA SAGDP2 extract, and FRED republishes BEA/BLS series for validation; those platforms do not create additional independent publishers. U.S. Census Bureau geography serves only as a methodology source. Values from alternative employment definitions, such as QCEW instead of CES, are not averaged with this dataset. California, Texas, Louisiana and Hawaii BEA values were cross-checked against separately served BEA/FRED or BEA-based state extracts.
Limitations and exclusions. The numerator includes labor compensation and returns to capital; the denominator counts payroll jobs, including part-time positions, but excludes self-employment and does not account for hours worked. All ratios use 2025 current-dollar GDP, without an adjustment for regional prices or inflation. BLS employment is published to the nearest 100 jobs, so closely ranked states can switch places when more precise figures or revised data become available. Small manufacturing workforces, such as those in Wyoming and Alaska, make this precision issue particularly relevant.
Main ranking: all 50 U.S. states
Search any state, filter by Census region or value status, sort results and switch between the highest 10, highest 20 or all 50 states. Every row includes both 2025 observed inputs so the calculated figure can be reproduced.
Manufacturing value added per payroll job, 2025 · 50 states · BEA + BLS compiled research dataset · 50 states shown
| Rank | State | Value / job | Source / method note |
|---|---|---|---|
| 1 | Louisiana | $443,300 | South; calculated_value; BEA 2025 $62,325.2m / BLS 2025 140.6k jobs (×1,000). |
| 2 | Wyoming | $385,200 | West; calculated_value; BEA 2025 $4,044.4m / BLS 2025 10.5k jobs (×1,000). |
| 3 | Texas | $337,000 | South; calculated_value; BEA 2025 $332,089.2m / BLS 2025 985.3k jobs (×1,000). |
| 4 | California | $320,200 | West; calculated_value; BEA 2025 $390,527.9m / BLS 2025 1,219.8k jobs (×1,000). |
| 5 | Delaware | $316,800 | South; calculated_value; BEA 2025 $8,457.4m / BLS 2025 26.7k jobs (×1,000). |
| 6 | Massachusetts | $300,000 | Northeast; calculated_value; BEA 2025 $67,984.9m / BLS 2025 226.6k jobs (×1,000). |
| 7 | New Jersey | $299,200 | Northeast; calculated_value; BEA 2025 $75,398.6m / BLS 2025 252.0k jobs (×1,000). |
| 8 | Maryland | $272,400 | South; calculated_value; BEA 2025 $30,158.7m / BLS 2025 110.7k jobs (×1,000). |
| 9 | Connecticut | $263,100 | Northeast; calculated_value; BEA 2025 $40,154.0m / BLS 2025 152.6k jobs (×1,000). |
| 10 | Indiana | $250,100 | Midwest; calculated_value; BEA 2025 $129,367.3m / BLS 2025 517.3k jobs (×1,000). |
| 11 | Virginia | $248,200 | South; calculated_value; BEA 2025 $58,864.8m / BLS 2025 237.2k jobs (×1,000). |
| 12 | Illinois | $246,700 | Midwest; calculated_value; BEA 2025 $140,264.2m / BLS 2025 568.5k jobs (×1,000). |
| 13 | North Dakota | $245,500 | Midwest; calculated_value; BEA 2025 $6,850.6m / BLS 2025 27.9k jobs (×1,000). |
| 14 | North Carolina | $242,800 | South; calculated_value; BEA 2025 $111,526.2m / BLS 2025 459.4k jobs (×1,000). |
| 15 | Washington | $230,300 | West; calculated_value; BEA 2025 $62,431.3m / BLS 2025 271.1k jobs (×1,000). |
| 16 | Arizona | $228,100 | West; calculated_value; BEA 2025 $44,048.4m / BLS 2025 193.1k jobs (×1,000). |
| 17 | Iowa | $211,100 | Midwest; calculated_value; BEA 2025 $45,661.9m / BLS 2025 216.3k jobs (×1,000). |
| 18 | New York | $209,600 | Northeast; calculated_value; BEA 2025 $84,760.4m / BLS 2025 404.3k jobs (×1,000). |
| 19 | Georgia | $205,800 | South; calculated_value; BEA 2025 $87,862.5m / BLS 2025 427.0k jobs (×1,000). |
| 20 | Florida | $204,700 | South; calculated_value; BEA 2025 $87,429.9m / BLS 2025 427.1k jobs (×1,000). |
| 21 | West Virginia | $204,600 | South; calculated_value; BEA 2025 $9,268.7m / BLS 2025 45.3k jobs (×1,000). |
| 22 | Kansas | $203,300 | Midwest; calculated_value; BEA 2025 $35,138.6m / BLS 2025 172.8k jobs (×1,000). |
| 23 | Colorado | $198,700 | West; calculated_value; BEA 2025 $29,074.4m / BLS 2025 146.3k jobs (×1,000). |
| 24 | Ohio | $196,000 | Midwest; calculated_value; BEA 2025 $132,782.8m / BLS 2025 677.4k jobs (×1,000). |
| 25 | Kentucky | $195,300 | South; calculated_value; BEA 2025 $49,307.9m / BLS 2025 252.5k jobs (×1,000). |
| 26 | Montana | $193,800 | West; calculated_value; BEA 2025 $4,070.2m / BLS 2025 21.0k jobs (×1,000). |
| 27 | Oregon | $193,600 | West; calculated_value; BEA 2025 $34,792.6m / BLS 2025 179.7k jobs (×1,000). |
| 28 | Michigan | $193,200 | Midwest; calculated_value; BEA 2025 $113,223.0m / BLS 2025 585.9k jobs (×1,000). |
| 29 | Utah | $192,800 | West; calculated_value; BEA 2025 $29,650.4m / BLS 2025 153.8k jobs (×1,000). |
| 30 | Pennsylvania | $192,800 | Northeast; calculated_value; BEA 2025 $107,217.7m / BLS 2025 556.2k jobs (×1,000). |
| 31 | Tennessee | $191,200 | South; calculated_value; BEA 2025 $68,030.5m / BLS 2025 355.8k jobs (×1,000). |
| 32 | Nebraska | $186,000 | Midwest; calculated_value; BEA 2025 $19,079.0m / BLS 2025 102.6k jobs (×1,000). |
| 33 | South Carolina | $185,600 | South; calculated_value; BEA 2025 $48,670.3m / BLS 2025 262.2k jobs (×1,000). |
| 34 | Minnesota | $184,200 | Midwest; calculated_value; BEA 2025 $58,003.1m / BLS 2025 314.9k jobs (×1,000). |
| 35 | Missouri | $181,400 | Midwest; calculated_value; BEA 2025 $50,887.2m / BLS 2025 280.5k jobs (×1,000). |
| 36 | Nevada | $181,000 | West; calculated_value; BEA 2025 $12,290.4m / BLS 2025 67.9k jobs (×1,000). |
| 37 | New Hampshire | $178,200 | Northeast; calculated_value; BEA 2025 $12,048.0m / BLS 2025 67.6k jobs (×1,000). |
| 38 | Idaho | $177,000 | West; calculated_value; BEA 2025 $13,311.3m / BLS 2025 75.2k jobs (×1,000). |
| 39 | Oklahoma | $176,700 | South; calculated_value; BEA 2025 $24,841.7m / BLS 2025 140.6k jobs (×1,000). |
| 40 | Alabama | $174,400 | South; calculated_value; BEA 2025 $49,534.1m / BLS 2025 284.0k jobs (×1,000). |
| 41 | Mississippi | $174,300 | South; calculated_value; BEA 2025 $24,198.4m / BLS 2025 138.8k jobs (×1,000). |
| 42 | Hawaii | $172,100 | West; calculated_value; BEA 2025 $2,237.4m / BLS 2025 13.0k jobs (×1,000). |
| 43 | Wisconsin | $168,400 | Midwest; calculated_value; BEA 2025 $77,166.7m / BLS 2025 458.2k jobs (×1,000). |
| 44 | Maine | $160,900 | Northeast; calculated_value; BEA 2025 $8,252.2m / BLS 2025 51.3k jobs (×1,000). |
| 45 | New Mexico | $159,200 | West; calculated_value; BEA 2025 $4,474.7m / BLS 2025 28.1k jobs (×1,000). |
| 46 | Arkansas | $157,700 | South; calculated_value; BEA 2025 $25,140.5m / BLS 2025 159.4k jobs (×1,000). |
| 47 | Rhode Island | $157,300 | Northeast; calculated_value; BEA 2025 $6,165.3m / BLS 2025 39.2k jobs (×1,000). |
| 48 | Vermont | $140,800 | Northeast; calculated_value; BEA 2025 $3,857.7m / BLS 2025 27.4k jobs (×1,000). |
| 49 | South Dakota | $121,300 | Midwest; calculated_value; BEA 2025 $5,361.8m / BLS 2025 44.2k jobs (×1,000). |
| 50 | Alaska | $117,000 | West; calculated_value; BEA 2025 $1,462.5m / BLS 2025 12.5k jobs (×1,000). |
Each row provides the BEA manufacturing GDP input (millions of dollars) and BLS annual-average manufacturing employment (thousands of jobs). Sorting uses the unrounded calculated ratio, even though the figures shown to readers are rounded to the nearest $100.
Four findings from the confirmed 2025 dataset
Key Insight: a wide top-to-bottom gap
Louisiana leads at $443,300 per payroll job, about $58,100 above second-place Wyoming. Its unrounded ratio is 3.79 times Alaska's $117,000, a difference of roughly $326,300 per job between the highest and lowest states.
Notable Pattern: weighted versus typical state
The 50-state pooled ratio is $232,700, compared with a median of $194,500 and an unweighted state average of $215,400. In this dataset, the pooled figure is 19.6% higher than the median. It divides total manufacturing GDP by total payroll jobs, so states with larger manufacturing workforces carry more weight than in the median.
Regional Concentration: South versus its coverage
The Census South holds 4 of the top 10 positions (40%), although its 16 states account for 32% of the full list. That is an 8-percentage-point difference. The remaining Top 10 places belong to the Northeast (3), West (2) and Midwest (1).
Outlier: Wyoming's scale reversal
Wyoming ranks 47th by total 2025 manufacturing GDP ($4,044.4 million), yet 2nd per payroll job at $385,200—a 45-place reversal. It has 10,500 manufacturing payroll jobs, compared with California's 1,219,800.
What the ranking means—and what it does not
Reading the results: the ranking compares manufacturing GDP with the number of manufacturing payroll jobs in each state. It does not rank the size of the manufacturing sector. California has the largest manufacturing GDP, while Louisiana leads per job—different measures of the same industry.
Using the ranking: a higher ratio does not establish that individual workers are more productive or better paid. BEA value added includes labor compensation and business operating surplus, while BLS counts full- and part-time payroll jobs rather than hours worked. Differences between states may reflect the industries they specialize in, investment in equipment, output prices or hours worked; the data do not isolate those effects.
Comparing years: a rise in current-dollar value added per job would not necessarily mean real productivity improved. That question needs a consistent historical series, price adjustments and ideally hours-worked data. Revisions to BEA or BLS inputs could also change the rankings.
Frequently asked questions
Which U.S. state has the highest manufacturing value added per worker?
Louisiana ranks first in this 2025 compiled calculation at $443,300 per payroll job, based on $62,325.2 million of BEA manufacturing GDP divided by 140.6 thousand BLS manufacturing jobs.
Why is California fourth even though it produces the most manufacturing GDP?
California leads total manufacturing GDP with $390,527.9 million but also has 1,219.8 thousand annual-average manufacturing payroll jobs. Its resulting ratio is $320,200/job, ranked fourth. Total output and value added per job answer different questions.
Is value added per worker an official BEA or BLS productivity figure?
No. BEA publishes industry GDP and BLS publishes payroll employment; StatRanker calculates their ratio. Official labor-productivity statistics may use different output measures and typically account for hours worked.
Are these forecasts for 2026?
No. This is a 2026 snapshot of 2025 observed data from both agencies, not a 2026 estimate. There are no modeled projections or growth assumptions in the table.
Does $443,300 per job mean the typical Louisiana manufacturing worker earns that much?
No. Value added comprises labor compensation, operating surplus and production taxes less subsidies. It is not average wages, salaries, employee productivity in physical units or disposable income.
Why use manufacturing payroll jobs rather than the resident workforce?
BLS CES measures jobs at establishments in manufacturing. Resident employment can include workers in unrelated industries and is not a matching industry denominator. CES excludes self-employed proprietors and can count a person with two establishment jobs twice, so it does not measure unique workers.
Are the dollar amounts inflation adjusted?
No. BEA SAGDP2 values here are 2025 current-dollar manufacturing GDP, and every ratio is nominal U.S. dollars per job. Cross-state price levels, output prices and inflation are not adjusted.
How are the median and pooled benchmark calculated?
The 50-state median is the middle of the 50 calculated ratios (the average of ranks 25 and 26 in ascending order), $194,500. The pooled benchmark divides all 50 states' manufacturing GDP ($2,929,746.9 million) by all 50 states' annual-average payroll jobs (12,588.3 thousand), giving $232,700/job. Neither is a published federal productivity statistic.
Sources and their roles
U.S. Bureau of Economic Analysis — state GDP
Numeric source (numerator). Annual 2025 manufacturing NAICS 31–33 current-dollar GDP, SAGDP2 line 12, U.S. dollars in millions; official values released September 30, 2026.
U.S. Bureau of Labor Statistics — state CES employment
Numeric source (denominator). 2025 annual-average manufacturing all-employees payroll jobs by state, Table 1, in thousands; a separate publishing organization from BEA.
BEA manufacturing GDP table — accessible display
Numeric access and validation mirror. Displays the 50 state BEA SAGDP2 2025 manufacturing numbers with source year and units. This is still BEA data, not a third independent numeric producer.
https://invokely.ai/rankings/gdp-by-industry-manufacturing/us-states
Federal Reserve Bank of St. Louis — FRED
Validation source. Independently served BEA manufacturing GDP state series and BLS CES annual series, used to cross-check selected 2025 values. FRED republication does not count as a separate primary publisher.
https://fred.stlouisfed.org/series/TXMANNGSP
BEA — value-added definition
Methodology source. Defines industry value added as gross output less intermediate inputs, including labor compensation, operating surplus and net production taxes. Not used for additional numeric rows.
BLS — CES employment concepts
Methodology source. Explains payroll job counting, exclusions, and distinctions from employed persons and labor productivity. Not a second denominator dataset.
U.S. Census Bureau — regions
Methodology source. Assigns states to Northeast, Midwest, South and West for regional filters and the top-ten distribution insight. No GDP or employment values were taken from this source.
https://www.census.gov/programs-surveys/economic-census/guidance-geographies/levels.html
