

SNAP Recipients per 1,000 Residents by State: FY2025 Ranking (June 2026 Data Edition)
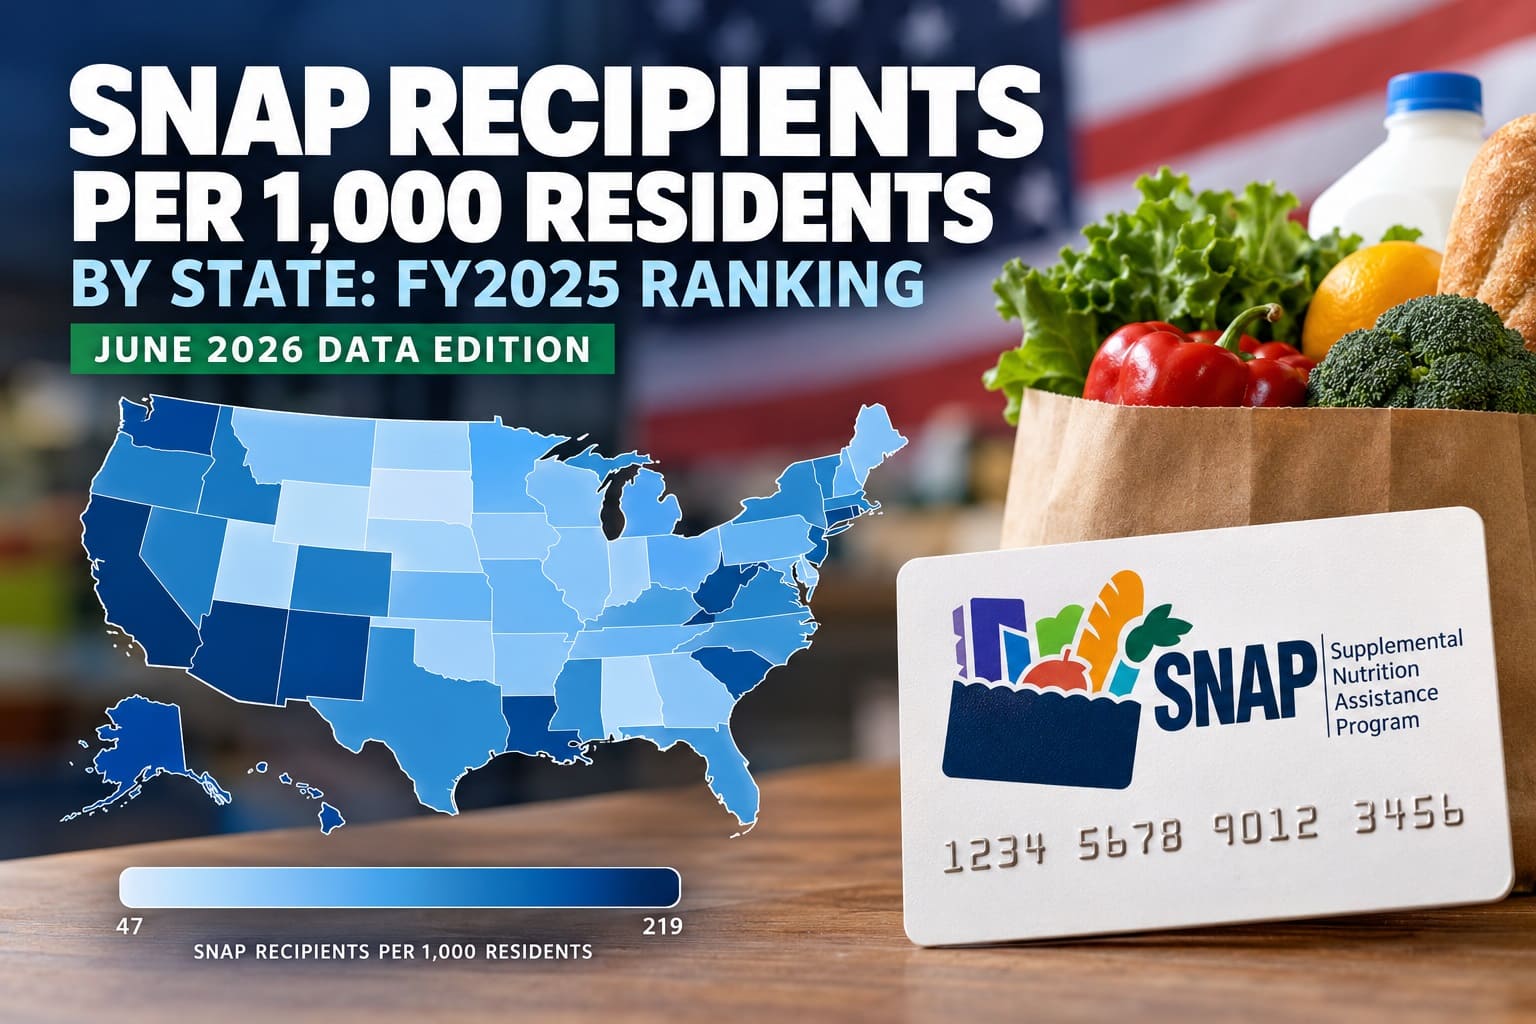
FY2025 SNAP Recipients per 1,000 Residents by State — June 18, 2026 Data Edition
New Mexico ranks first at 219.3 SNAP recipients per 1,000 residents and Wyoming last at 46.7 in this FY2025 June 18, 2026 data edition. Rates equal USDA average monthly FY2025 participants divided by Census July 1, 2025 resident population, multiplied by 1,000; higher values rank higher.
Historical data edition — June 18, 2026. USDA revised 2025 SNAP counts in September 2026, especially Georgia. All ranks, charts and comparisons on this page describe the earlier USDA/KFF source version, not the latest revised FY2025 figures.
This table covers all 50 states plus the District of Columbia (51 jurisdictions). All 51 ranking values have status calculated_value; no rate is a USDA-published official participation rate among eligible residents. The values are calculated from observed inputs, not an official forecast/projection.
The table is a historical compiled research dataset from two independent numeric publishers: USDA SNAP average-month participation (reproduced by KFF as of June 18, 2026) and U.S. Census Bureau Vintage 2025 population estimates. State rates are calculated from these observed inputs, not forecasts. All 51 calculations are specific to that older publication version. Access checked October 28, 2026; subsequent USDA revisions are identified but have not been incorporated.
466,081 average monthly SNAP participants; Census population 2,125,498.
27,489 average monthly participants; Census population 588,753.
50 states plus DC; Census July 2025 denominators; June 18, 2026 USDA-through-KFF numerator snapshot.
New Mexico exceeds Wyoming by 4.70 times on the unrounded calculated measure.
Overview: recipient counts versus population-adjusted rates
An average-month count measures program scale; the per-1,000 rate makes jurisdictions with very different populations easier to compare. California has the largest FY2025 average count (about 5.47 million), but is 15th by recipients per 1,000. New Mexico ranks first on the population-adjusted measure, with fewer than half a million average monthly recipients.
The unweighted median of the 51 June-version jurisdiction rates is 112.6 per 1,000. The state-and-DC monthly averages sum to approximately 42,319,515, but KFF's separately published U.S. FY2025 aggregate is 42,126,585. The approximately 192,930 difference is unresolved and is not treated as a validated nationwide benchmark, nor is it used as a denominator for any share.
FY2025 runs from October 1, 2024 through September 30, 2025. Changes from FY2024 in this study compare two rates: FY2024 average monthly recipients divided by July 2024 population, versus FY2025 recipients divided by July 2025 population. The denominator and reference year change together.
Where the population adjustment changes the ranking most
These are the three largest positive and three largest negative differences between rank by average monthly recipients and rank by recipients per 1,000 residents. A positive shift means a jurisdiction moves higher after adjusting for population; it does not mean SNAP participation increased over time. All ranks use the same 51 jurisdictions and June 18, 2026 participation edition.
| State / DC | Rank by count | Rank per 1,000 | Rank shift | Per 1,000 |
|---|---|---|---|---|
| District of Columbia | 42 | 2 | +40 | 203.1 |
| New Mexico | 29 | 1 | +28 | 219.3 |
| West Virginia | 33 | 7 | +26 | 154.5 |
| Virginia | 16 | 36 | -20 | 92.1 |
| New Jersey | 14 | 38 | -24 | 86.7 |
| Texas | 2 | 28 | -26 | 109.5 |
Method: count rank = descending FY2025 USDA average monthly recipients; rate rank = descending (recipients / July 2025 Census population × 1,000); rank shift = count rank − rate rank. All ranks are calculated from unrounded inputs and belong only to the June 18, 2026 source edition. The original source counts and denominators appear in the main ranking below.
In the same dated edition, the Northeast region has a population-weighted 131.9 recipients per 1,000, compared with 114.0 in the Midwest — a 17.9 per 1,000 difference. Each regional rate equals the sum of state average monthly participants divided by the sum of July 2025 state resident populations, multiplied by 1,000; this is not an official USDA regional rate.
Top 10 SNAP recipient rates — FY2025, June 18, 2026 data edition
This ranking is computed from USDA counts reproduced in the KFF June 18, 2026 snapshot and Census population. The positions are specific to this dated source edition; September 2026 USDA revisions are not included.
FY2025, KFF/USDA source dated June 18, 2026 · per 1,000 residents · descending (not the later USDA revision)
| Rank | State / DC | Per 1,000 | Source / method note |
|---|---|---|---|
| 1 | New Mexico | 219.3 | calculated_value; West. KFF June 18 2026 / USDA FY2025 466,080.75 / Census Jul 2025 2,125,498 × 1,000; FY2024 USDA 451,320.08 / Census Jul 2024 2,126,774 × 1,000; change +7.1 per 1,000. |
| 2 | District of Columbia | 203.1 | calculated_value; South. KFF June 18 2026 / USDA FY2025 140,906.92 / Census Jul 2025 693,645 × 1,000; FY2024 USDA 137,451.75 / Census Jul 2024 691,310 × 1,000; change +4.3 per 1,000. |
| 3 | Oregon | 180.4 | calculated_value; West. KFF June 18 2026 / USDA FY2025 770,894.50 / Census Jul 2025 4,273,586 × 1,000; FY2024 USDA 757,743.83 / Census Jul 2024 4,265,324 × 1,000; change +2.7 per 1,000. |
| 4 | Louisiana | 177.2 | calculated_value; South. KFF June 18 2026 / USDA FY2025 818,438.42 / Census Jul 2025 4,618,189 × 1,000; FY2024 USDA 847,132.50 / Census Jul 2024 4,614,878 × 1,000; change -6.3 per 1,000. |
| 5 | Oklahoma | 168.4 | calculated_value; South. KFF June 18 2026 / USDA FY2025 694,230.33 / Census Jul 2025 4,123,288 × 1,000; FY2024 USDA 686,807.75 / Census Jul 2024 4,097,758 × 1,000; change +0.8 per 1,000. |
| 6 | Georgia | 156.5 | calculated_value; South. KFF June 18 2026 / USDA FY2025 1,768,364.58 / Census Jul 2025 11,302,748 × 1,000; FY2024 USDA 1,413,939.67 / Census Jul 2024 11,204,208 × 1,000; change +30.3 per 1,000 in this June edition. Caution: USDA subsequently corrected 2025 Georgia participation; this is a superseded-source value, not a verified post-revision rate. |
| 7 | West Virginia | 154.5 | calculated_value; South. KFF June 18 2026 / USDA FY2025 272,842.67 / Census Jul 2025 1,766,147 × 1,000; FY2024 USDA 277,429.08 / Census Jul 2024 1,767,402 × 1,000; change -2.5 per 1,000. |
| 8 | Massachusetts | 152.0 | calculated_value; Northeast. KFF June 18 2026 / USDA FY2025 1,087,752.25 / Census Jul 2025 7,154,084 × 1,000; FY2024 USDA 1,113,677.83 / Census Jul 2024 7,138,560 × 1,000; change -4.0 per 1,000. |
| 9 | Nevada | 151.0 | calculated_value; West. KFF June 18 2026 / USDA FY2025 495,769.33 / Census Jul 2025 3,282,188 × 1,000; FY2024 USDA 505,461.50 / Census Jul 2024 3,253,543 × 1,000; change -4.3 per 1,000. |
| 10 | Pennsylvania | 150.4 | calculated_value; Northeast. KFF June 18 2026 / USDA FY2025 1,964,591.25 / Census Jul 2025 13,059,432 × 1,000; FY2024 USDA 2,000,018.00 / Census Jul 2024 13,045,848 × 1,000; change -2.9 per 1,000. |
Rank is derived from the unrounded FY2025 ratio; FY2024 changes are per 1,000 residents, not percent growth.
Chart: Top 20 SNAP recipient rates in the June 2026 data edition
Each bar uses the same June 18, 2026 source-version inputs and unrounded calculated ratio as the ranking table. It depicts the June source edition rather than the later USDA revision.
Unit: recipients per 1,000 residents, displayed to one decimal. Georgia at #6 is included as a June-version historical value that was subsequently subject to USDA revision. The chart does not display official eligible-person SNAP participation rates.
Methodology and source hierarchy
Metric and direction
Higher average-month SNAP recipients per 1,000 total residents rank higher. FY2025 ratio = (USDA FY2025 average monthly people ÷ Census July 1, 2025 residents) × 1,000. Ranks use unrounded ratios; visible rates are rounded to one decimal.
FY2024 comparison
FY2024 ratio = (USDA FY2024 average monthly people ÷ Census July 1, 2024 residents) × 1,000. Change = unrounded FY2025 ratio − unrounded FY2024 ratio, reported in people per 1,000. This is a difference in rates, not growth in unique recipients.
Published inputs and calculated outputs
USDA FNA (formerly FNS) publishes state-level average monthly SNAP participation; Census PEP Vintage 2025 publishes resident population for both July 2024 and July 2025. Every 2025 rate and every FY2024 rate comparison is calculated_value; no modeled_projection or official_forecast is included.
Coverage and exclusions
All 50 states and DC have matched numerator and denominator values. Puerto Rico and other territories are excluded because the coverage is explicitly states plus DC. There are no missing or mixed-year rows in the June 2026 KFF source edition. Later USDA revisions are intentionally outside this frozen comparison. Census Regions (Northeast, Midwest, South, West) define geographic filters; DC is included in the South.
Snapshot and source provenance
FY2025 means October 2024–September 2025; July 2025 population is a point-in-time denominator. The numerator is frozen to the KFF June 18, 2026 capture; FRAC documents substantial USDA corrections in September 2026. Access checked October 28, 2026. These numbers document the cited earlier publication version.
Source hierarchy and limitations
Source of observed participants: USDA Food and Nutrition Administration, extracted from the KFF June 18, 2026 republication. Source of observed population: Census Bureau Vintage 2025, cross-checked through FRED. FRAC is a revision-notice validation source, not a replacement numeric source. USDA ERS is a context and extremes check, not independent of USDA. Government source priority takes precedence over KFF whenever values conflict.
Ranking lens and outlier sensitivity: The comparison table ranks the same 51 June-version participant counts both directly and after dividing by each jurisdiction's July 2025 population. Rank shift = count rank − rate rank. The District of Columbia has the largest absolute shift (40 ranks). Georgia remains included only as a documented June 2026 source-version observation, not an updated FY2025 result: its June-edition rank #6 and +30.3 rate change were not validated after the September 2026 USDA revisions. No revised Georgia figure is inferred.
Reconciliation: summed June-release averages for 50 states plus DC are about 42,319,515; the separately published KFF U.S. figure is 42,126,585. Their 192,930-person difference is not explained by the available row data. No national benchmark is calculated from these conflicting universes, and they are not averaged. This difference is retained as a data-quality limitation of the documented June source edition.
Interpretation limits: the denominator is the entire resident population, not the SNAP-eligible population. This is not the USDA's official participation rate among eligible people, an annual count of unique recipients, a household share, a poverty rate, a food insecurity rate, a benefit-dollar measure or a measure of program effectiveness. No causal explanation is inferred from observed rate changes.
Main ranking: 50 states and DC, FY2025 — June 18, 2026 edition
Search and filter the 51 rows verified against the June 18, 2026 KFF source edition (not against the September USDA revisions). Each note identifies its region, both USDA participant inputs and both Census population denominators. Status for every displayed rate: calculated_value.
51 of 51 rows shown
June 18, 2026 data edition · FY2025 average monthly SNAP recipients / July 2025 resident population × 1,000
| Rank | State / DC | Per 1,000 | Source / method note |
|---|---|---|---|
| 1 | New Mexico | 219.3 | calculated_value; West. KFF June 18 2026 / USDA FY2025 466,080.75 / Census Jul 2025 2,125,498 × 1,000; FY2024 USDA 451,320.08 / Census Jul 2024 2,126,774 × 1,000; change +7.1 per 1,000. |
| 2 | District of Columbia | 203.1 | calculated_value; South. KFF June 18 2026 / USDA FY2025 140,906.92 / Census Jul 2025 693,645 × 1,000; FY2024 USDA 137,451.75 / Census Jul 2024 691,310 × 1,000; change +4.3 per 1,000. |
| 3 | Oregon | 180.4 | calculated_value; West. KFF June 18 2026 / USDA FY2025 770,894.50 / Census Jul 2025 4,273,586 × 1,000; FY2024 USDA 757,743.83 / Census Jul 2024 4,265,324 × 1,000; change +2.7 per 1,000. |
| 4 | Louisiana | 177.2 | calculated_value; South. KFF June 18 2026 / USDA FY2025 818,438.42 / Census Jul 2025 4,618,189 × 1,000; FY2024 USDA 847,132.50 / Census Jul 2024 4,614,878 × 1,000; change -6.3 per 1,000. |
| 5 | Oklahoma | 168.4 | calculated_value; South. KFF June 18 2026 / USDA FY2025 694,230.33 / Census Jul 2025 4,123,288 × 1,000; FY2024 USDA 686,807.75 / Census Jul 2024 4,097,758 × 1,000; change +0.8 per 1,000. |
| 6 | Georgia | 156.5 | calculated_value; South. KFF June 18 2026 / USDA FY2025 1,768,364.58 / Census Jul 2025 11,302,748 × 1,000; FY2024 USDA 1,413,939.67 / Census Jul 2024 11,204,208 × 1,000; change +30.3 per 1,000 in this June edition. Caution: USDA subsequently corrected 2025 Georgia participation; this is a superseded-source value, not a verified post-revision rate. |
| 7 | West Virginia | 154.5 | calculated_value; South. KFF June 18 2026 / USDA FY2025 272,842.67 / Census Jul 2025 1,766,147 × 1,000; FY2024 USDA 277,429.08 / Census Jul 2024 1,767,402 × 1,000; change -2.5 per 1,000. |
| 8 | Massachusetts | 152.0 | calculated_value; Northeast. KFF June 18 2026 / USDA FY2025 1,087,752.25 / Census Jul 2025 7,154,084 × 1,000; FY2024 USDA 1,113,677.83 / Census Jul 2024 7,138,560 × 1,000; change -4.0 per 1,000. |
| 9 | Nevada | 151.0 | calculated_value; West. KFF June 18 2026 / USDA FY2025 495,769.33 / Census Jul 2025 3,282,188 × 1,000; FY2024 USDA 505,461.50 / Census Jul 2024 3,253,543 × 1,000; change -4.3 per 1,000. |
| 10 | Pennsylvania | 150.4 | calculated_value; Northeast. KFF June 18 2026 / USDA FY2025 1,964,591.25 / Census Jul 2025 13,059,432 × 1,000; FY2024 USDA 2,000,018.00 / Census Jul 2024 13,045,848 × 1,000; change -2.9 per 1,000. |
| 11 | Illinois | 149.1 | calculated_value; Midwest. KFF June 18 2026 / USDA FY2025 1,895,979.33 / Census Jul 2025 12,719,141 × 1,000; FY2024 USDA 1,935,645.08 / Census Jul 2024 12,703,033 × 1,000; change -3.3 per 1,000. |
| 12 | New York | 147.9 | calculated_value; Northeast. KFF June 18 2026 / USDA FY2025 2,958,255.00 / Census Jul 2025 20,002,427 × 1,000; FY2024 USDA 2,926,213.33 / Census Jul 2024 20,001,419 × 1,000; change +1.6 per 1,000. |
| 13 | Michigan | 147.1 | calculated_value; Midwest. KFF June 18 2026 / USDA FY2025 1,490,109.67 / Census Jul 2025 10,127,884 × 1,000; FY2024 USDA 1,474,426.92 / Census Jul 2024 10,099,962 × 1,000; change +1.1 per 1,000. |
| 14 | Alabama | 142.5 | calculated_value; South. KFF June 18 2026 / USDA FY2025 740,270.50 / Census Jul 2025 5,193,088 × 1,000; FY2024 USDA 752,160.75 / Census Jul 2024 5,163,055 × 1,000; change -3.1 per 1,000. |
| 15 | California | 139.1 | calculated_value; West. KFF June 18 2026 / USDA FY2025 5,474,022.50 / Census Jul 2025 39,355,309 × 1,000; FY2024 USDA 5,379,574.67 / Census Jul 2024 39,364,774 × 1,000; change +2.4 per 1,000. |
| 16 | Kentucky | 129.3 | calculated_value; South. KFF June 18 2026 / USDA FY2025 595,471.50 / Census Jul 2025 4,606,864 × 1,000; FY2024 USDA 599,909.83 / Census Jul 2024 4,584,046 × 1,000; change -1.6 per 1,000. |
| 17 | Rhode Island | 128.9 | calculated_value; Northeast. KFF June 18 2026 / USDA FY2025 143,670.00 / Census Jul 2025 1,114,521 × 1,000; FY2024 USDA 144,270.50 / Census Jul 2024 1,110,415 × 1,000; change -1.0 per 1,000. |
| 18 | North Carolina | 128.6 | calculated_value; South. KFF June 18 2026 / USDA FY2025 1,439,834.67 / Census Jul 2025 11,197,968 × 1,000; FY2024 USDA 1,415,606.75 / Census Jul 2024 11,052,061 × 1,000; change +0.5 per 1,000. |
| 19 | Florida | 128.1 | calculated_value; South. KFF June 18 2026 / USDA FY2025 3,006,145.00 / Census Jul 2025 23,462,518 × 1,000; FY2024 USDA 2,965,369.27 / Census Jul 2024 23,265,838 × 1,000; change +0.7 per 1,000. |
| 20 | Mississippi | 123.0 | calculated_value; South. KFF June 18 2026 / USDA FY2025 363,308.75 / Census Jul 2025 2,954,160 × 1,000; FY2024 USDA 384,804.50 / Census Jul 2024 2,950,172 × 1,000; change -7.5 per 1,000. |
| 21 | Ohio | 120.7 | calculated_value; Midwest. KFF June 18 2026 / USDA FY2025 1,436,238.75 / Census Jul 2025 11,900,510 × 1,000; FY2024 USDA 1,386,865.17 / Census Jul 2024 11,860,621 × 1,000; change +3.8 per 1,000. |
| 22 | Maine | 117.6 | calculated_value; Northeast. KFF June 18 2026 / USDA FY2025 166,320.83 / Census Jul 2025 1,414,874 × 1,000; FY2024 USDA 172,232.08 / Census Jul 2024 1,408,438 × 1,000; change -4.7 per 1,000. |
| 23 | Arizona | 116.7 | calculated_value; West. KFF June 18 2026 / USDA FY2025 889,562.92 / Census Jul 2025 7,623,818 × 1,000; FY2024 USDA 923,399.67 / Census Jul 2024 7,556,424 × 1,000; change -5.5 per 1,000. |
| 24 | Wisconsin | 116.0 | calculated_value; Midwest. KFF June 18 2026 / USDA FY2025 693,081.75 / Census Jul 2025 5,972,787 × 1,000; FY2024 USDA 705,421.42 / Census Jul 2024 5,957,168 × 1,000; change -2.4 per 1,000. |
| 25 | Washington | 112.9 | calculated_value; West. KFF June 18 2026 / USDA FY2025 902,995.67 / Census Jul 2025 8,001,020 × 1,000; FY2024 USDA 888,316.17 / Census Jul 2024 7,927,958 × 1,000; change +0.8 per 1,000. |
| 26 | Hawaii | 112.6 | calculated_value; West. KFF June 18 2026 / USDA FY2025 161,311.92 / Census Jul 2025 1,432,820 × 1,000; FY2024 USDA 161,609.08 / Census Jul 2024 1,434,952 × 1,000; change -0.04 per 1,000. |
| 27 | Delaware | 112.1 | calculated_value; South. KFF June 18 2026 / USDA FY2025 118,828.00 / Census Jul 2025 1,059,952 × 1,000; FY2024 USDA 118,186.08 / Census Jul 2024 1,050,123 × 1,000; change -0.4 per 1,000. |
| 28 | Texas | 109.5 | calculated_value; South. KFF June 18 2026 / USDA FY2025 3,472,443.08 / Census Jul 2025 31,709,821 × 1,000; FY2024 USDA 3,193,008.58 / Census Jul 2024 31,318,578 × 1,000; change +7.6 per 1,000. |
| 29 | Maryland | 107.8 | calculated_value; South. KFF June 18 2026 / USDA FY2025 675,134.17 / Census Jul 2025 6,265,347 × 1,000; FY2024 USDA 694,023.33 / Census Jul 2024 6,245,314 × 1,000; change -3.4 per 1,000. |
| 30 | South Carolina | 106.2 | calculated_value; South. KFF June 18 2026 / USDA FY2025 591,353.92 / Census Jul 2025 5,570,274 × 1,000; FY2024 USDA 581,592.92 / Census Jul 2024 5,490,316 × 1,000; change +0.2 per 1,000. |
| 31 | Missouri | 105.6 | calculated_value; Midwest. KFF June 18 2026 / USDA FY2025 662,381.75 / Census Jul 2025 6,270,541 × 1,000; FY2024 USDA 656,117.83 / Census Jul 2024 6,243,544 × 1,000; change +0.5 per 1,000. |
| 32 | Colorado | 101.9 | calculated_value; West. KFF June 18 2026 / USDA FY2025 612,659.42 / Census Jul 2025 6,012,561 × 1,000; FY2024 USDA 584,469.50 / Census Jul 2024 5,988,502 × 1,000; change +4.3 per 1,000. |
| 33 | Vermont | 100.5 | calculated_value; Northeast. KFF June 18 2026 / USDA FY2025 64,801.67 / Census Jul 2025 644,663 × 1,000; FY2024 USDA 66,493.25 / Census Jul 2024 646,521 × 1,000; change -2.3 per 1,000. |
| 34 | Connecticut | 100.1 | calculated_value; Northeast. KFF June 18 2026 / USDA FY2025 369,294.58 / Census Jul 2025 3,688,496 × 1,000; FY2024 USDA 391,204.33 / Census Jul 2024 3,674,449 × 1,000; change -6.3 per 1,000. |
| 35 | Tennessee | 95.2 | calculated_value; South. KFF June 18 2026 / USDA FY2025 696,070.50 / Census Jul 2025 7,315,076 × 1,000; FY2024 USDA 711,945.75 / Census Jul 2024 7,251,291 × 1,000; change -3.0 per 1,000. |
| 36 | Virginia | 92.1 | calculated_value; South. KFF June 18 2026 / USDA FY2025 817,733.33 / Census Jul 2025 8,880,107 × 1,000; FY2024 USDA 827,773.92 / Census Jul 2024 8,819,642 × 1,000; change -1.8 per 1,000. |
| 37 | Alaska | 87.6 | calculated_value; West. KFF June 18 2026 / USDA FY2025 64,610.42 / Census Jul 2025 737,270 × 1,000; FY2024 USDA 68,261.25 / Census Jul 2024 736,537 × 1,000; change -5.0 per 1,000. |
| 38 | New Jersey | 86.7 | calculated_value; Northeast. KFF June 18 2026 / USDA FY2025 827,628.25 / Census Jul 2025 9,548,215 × 1,000; FY2024 USDA 827,227.08 / Census Jul 2024 9,506,354 × 1,000; change -0.3 per 1,000. |
| 39 | Indiana | 84.9 | calculated_value; Midwest. KFF June 18 2026 / USDA FY2025 591,860.08 / Census Jul 2025 6,973,333 × 1,000; FY2024 USDA 610,689.17 / Census Jul 2024 6,934,754 × 1,000; change -3.2 per 1,000. |
| 40 | Iowa | 81.7 | calculated_value; Midwest. KFF June 18 2026 / USDA FY2025 264,522.58 / Census Jul 2025 3,238,387 × 1,000; FY2024 USDA 259,322.83 / Census Jul 2024 3,230,454 × 1,000; change +1.4 per 1,000. |
| 41 | South Dakota | 80.4 | calculated_value; Midwest. KFF June 18 2026 / USDA FY2025 75,175.92 / Census Jul 2025 935,094 × 1,000; FY2024 USDA 75,082.42 / Census Jul 2024 927,110 × 1,000; change -0.6 per 1,000. |
| 42 | Minnesota | 77.6 | calculated_value; Midwest. KFF June 18 2026 / USDA FY2025 452,645.00 / Census Jul 2025 5,830,405 × 1,000; FY2024 USDA 453,859.67 / Census Jul 2024 5,797,405 × 1,000; change -0.7 per 1,000. |
| 43 | Arkansas | 77.2 | calculated_value; South. KFF June 18 2026 / USDA FY2025 240,377.92 / Census Jul 2025 3,114,791 × 1,000; FY2024 USDA 240,122.08 / Census Jul 2024 3,096,080 × 1,000; change -0.4 per 1,000. |
| 44 | Nebraska | 74.6 | calculated_value; Midwest. KFF June 18 2026 / USDA FY2025 150,587.25 / Census Jul 2025 2,018,006 × 1,000; FY2024 USDA 155,034.42 / Census Jul 2024 2,005,591 × 1,000; change -2.7 per 1,000. |
| 45 | Montana | 69.7 | calculated_value; West. KFF June 18 2026 / USDA FY2025 79,828.08 / Census Jul 2025 1,144,694 × 1,000; FY2024 USDA 81,494.83 / Census Jul 2024 1,137,557 × 1,000; change -1.9 per 1,000. |
| 46 | North Dakota | 69.1 | calculated_value; Midwest. KFF June 18 2026 / USDA FY2025 55,259.50 / Census Jul 2025 799,358 × 1,000; FY2024 USDA 48,693.75 / Census Jul 2024 793,387 × 1,000; change +7.8 per 1,000. |
| 47 | Idaho | 65.6 | calculated_value; West. KFF June 18 2026 / USDA FY2025 133,123.00 / Census Jul 2025 2,029,733 × 1,000; FY2024 USDA 130,853.33 / Census Jul 2024 2,000,872 × 1,000; change +0.2 per 1,000. |
| 48 | Kansas | 62.9 | calculated_value; Midwest. KFF June 18 2026 / USDA FY2025 187,181.17 / Census Jul 2025 2,977,220 × 1,000; FY2024 USDA 187,042.50 / Census Jul 2024 2,965,252 × 1,000; change -0.2 per 1,000. |
| 49 | New Hampshire | 53.6 | calculated_value; Northeast. KFF June 18 2026 / USDA FY2025 75,856.83 / Census Jul 2025 1,415,342 × 1,000; FY2024 USDA 76,908.58 / Census Jul 2024 1,408,518 × 1,000; change -1.0 per 1,000. |
| 50 | Utah | 49.8 | calculated_value; West. KFF June 18 2026 / USDA FY2025 176,220.08 / Census Jul 2025 3,538,904 × 1,000; FY2024 USDA 169,281.33 / Census Jul 2024 3,502,983 × 1,000; change +1.5 per 1,000. |
| 51 | Wyoming | 46.7 | calculated_value; West. KFF June 18 2026 / USDA FY2025 27,489.00 / Census Jul 2025 588,753 × 1,000; FY2024 USDA 29,030.58 / Census Jul 2024 586,722 × 1,000; change -2.8 per 1,000. |
All 51 rows are calculated_value. Source names and absolute source URLs are provided in the Sources section below. Search/filter/sort controls change only the display, never the published rank or underlying numbers.
Four findings from the June 18, 2026 FY2025 source edition
Key Insight
New Mexico ranks #1 (219.3 per 1,000), while Wyoming is #51 (46.7). Their gap is 172.6 per 1,000, a 4.70× difference based on the unrounded calculated rates.
Notable Pattern
California is #1 by count (5,474,023) but #15 by rate (139.1); Texas is #2 by count (3,472,443) but #28 by rate (109.5). Population adjustment changes their positions by 14 and 26 places, respectively.
Regional Concentration
The Census South contains 10 of the Top 20 (50.0%) by per-1,000 rate, versus 17 of all 51 jurisdictions (33.3%) covered by the table. These are counts of jurisdictions within the selected ranking, not shares of U.S. recipients or population.
Outlier
The District of Columbia ranks only #42 by average monthly recipients (140,907) but #2 by recipients per 1,000 (203.1), a 40-place upward rank shift. This is the largest count-to-rate shift among the 51 jurisdictions in the dated source edition.
How to interpret this versioned SNAP ranking
A higher position means a greater number of average monthly SNAP participants relative to all residents, not necessarily greater hardship or more effective enrollment. States differ in eligibility rules within federal boundaries, income composition, administration and resident demographics; this descriptive table does not estimate each factor's contribution.
Use the per-1,000 rate for population-adjusted comparisons, the underlying participant counts for program scale, and the FY2024 comparison only to describe the observed change. The labels calculated_value distinguish these ratios from source-published counts and from USDA's separate estimate of participation among eligible people.
The July population denominator approximates a full fiscal year. Additionally, the June 18, 2026 KFF-derived numerator snapshot predates September 2026 USDA revisions. The table must therefore be interpreted as a historical June 2026 publication-version comparison rather than the latest available FY2025 revision.
FAQ: FY2025 SNAP rates in the June 2026 data edition
Which state had the highest rate in the June 2026 FY2025 source edition?
New Mexico ranks first at 219.3 per 1,000 residents. The figure is derived from 466,080.75 average monthly SNAP recipients and a July 2025 Census population of 2,125,498. DC is included separately and ranks second at 203.1.
Which state had the lowest rate in this FY2025 source edition?
Wyoming ranks last among the 51 jurisdictions at 46.7 per 1,000: 27,489 average monthly participants divided by 588,753 residents times 1,000.
Is 219.3 per 1,000 the official USDA eligibility-based participation rate?
No. This is a share of the entire resident population. A USDA participation rate among people eligible for SNAP uses a different, estimated eligible-person denominator.
Does FY2025 mean calendar year 2025?
No. Federal FY2025 runs October 1, 2024 to September 30, 2025. The denominator is the Census population estimate for July 1, 2025, not an average of 12 monthly population observations.
How is the FY2024 to FY2025 change calculated?
Calculate FY2024's average monthly recipients divided by July 2024 Census population times 1,000. Subtract that value from the same calculation for FY2025 with July 2025 population. The result is a change in recipients per 1,000, not a percentage growth rate.
Does the ranking show everyone who received SNAP at any time during FY2025?
No. The numerator is the monthly average over the fiscal year. Someone counted in multiple months is represented in those monthly totals, not counted as a distinct annual recipient.
Why does California lead by recipient count but not by recipients per 1,000?
California has about 5.47 million average monthly participants and 39.36 million residents, yielding 139.1 per 1,000 and rank #15. Its large total reflects its large population; New Mexico ranks first by the normalized metric.
Are these rates official projections, and can they change?
No. All 51 are calculated_value results from observed FY2025/FY2024 program counts and Census Vintage 2025 population estimates. They are not forecasts. USDA data and future Census vintages may be revised; the source snapshot is identified in the methodology.
Does the June 18, 2026 SNAP data edition include later USDA revisions?
No. The underlying KFF state participation values are explicitly dated June 18, 2026. FRAC reported September 2026 USDA revisions affecting 2025 values, especially Georgia. The ranks here therefore describe the June 18, 2026 source version, not the later revised USDA dataset.
Sources and verification
USDA Food and Nutrition Administration — SNAP Data Tables
numeric_source · participation numerator
Authoritative original publisher of the participation series. The figures on this page are frozen to its June 18, 2026 data edition as reproduced by KFF, rather than its later revised series.
https://www.fna.usda.gov/pd/supplemental-nutrition-assistance-program-snap
U.S. Census Bureau — Vintage 2025 State Population Estimates
numeric_source · 2024 and 2025 denominators
Official POPESTIMATE2024 and POPESTIMATE2025, July 1 resident population, from one consistent Census vintage.
KFF State Health Facts — Average Monthly SNAP Participation
numeric_source · versioned secondary extraction of USDA numerators
The precise 51-state FY2024 and FY2025 numeric counts used on this page come from KFF state rows carrying the June 18, 2026 USDA data date. This version predates the later USDA corrections; KFF is not an independent third numeric publisher.
https://www.kff.org/state-health-policy-data/state-indicator/avg-monthly-participation/
USDA Economic Research Service — FY2025 SNAP State Rates
validation_source · USDA FY2025 extremes, August 2026
Separate USDA publication of state-rate range: New Mexico approximately 21.9% and Wyoming approximately 4.7%; 42.1 million average monthly participants nationwide.
Federal Reserve Bank of St. Louis (FRED) — State Population 2025 Release Table
validation_source · Census population cross-check
State-level 2024 and 2025 population values in thousands, matching Census Vintage 2025 denominators. This is a republication of Census data, not a third independent numeric source.
https://fred.stlouisfed.org/release/tables?eid=259194&rid=118
U.S. Census Bureau — Geographic Terms and Definitions
methodology_source · regions
Defines Northeast, Midwest, South and West regions and their state membership, including the District of Columbia in the South.
https://www.census.gov/programs-surveys/popest/about/glossary/geo-terms.html
Food Research & Action Center — USDA SNAP Data Revisions
validation_source · dated revision disclosure
Documents the September 2026 retroactive changes to monthly participation in 2025, including the reported Georgia corrections. Confirms the June 2026 KFF snapshot is not current.
https://frac.org/snap-participation-data-january-2025-present/revisions
