

Which Countries Hold the Most U.S. Treasury Debt? August 2026 Ranking
Which Countries Hold the Most U.S. Treasury Debt? August 2026 Ranking
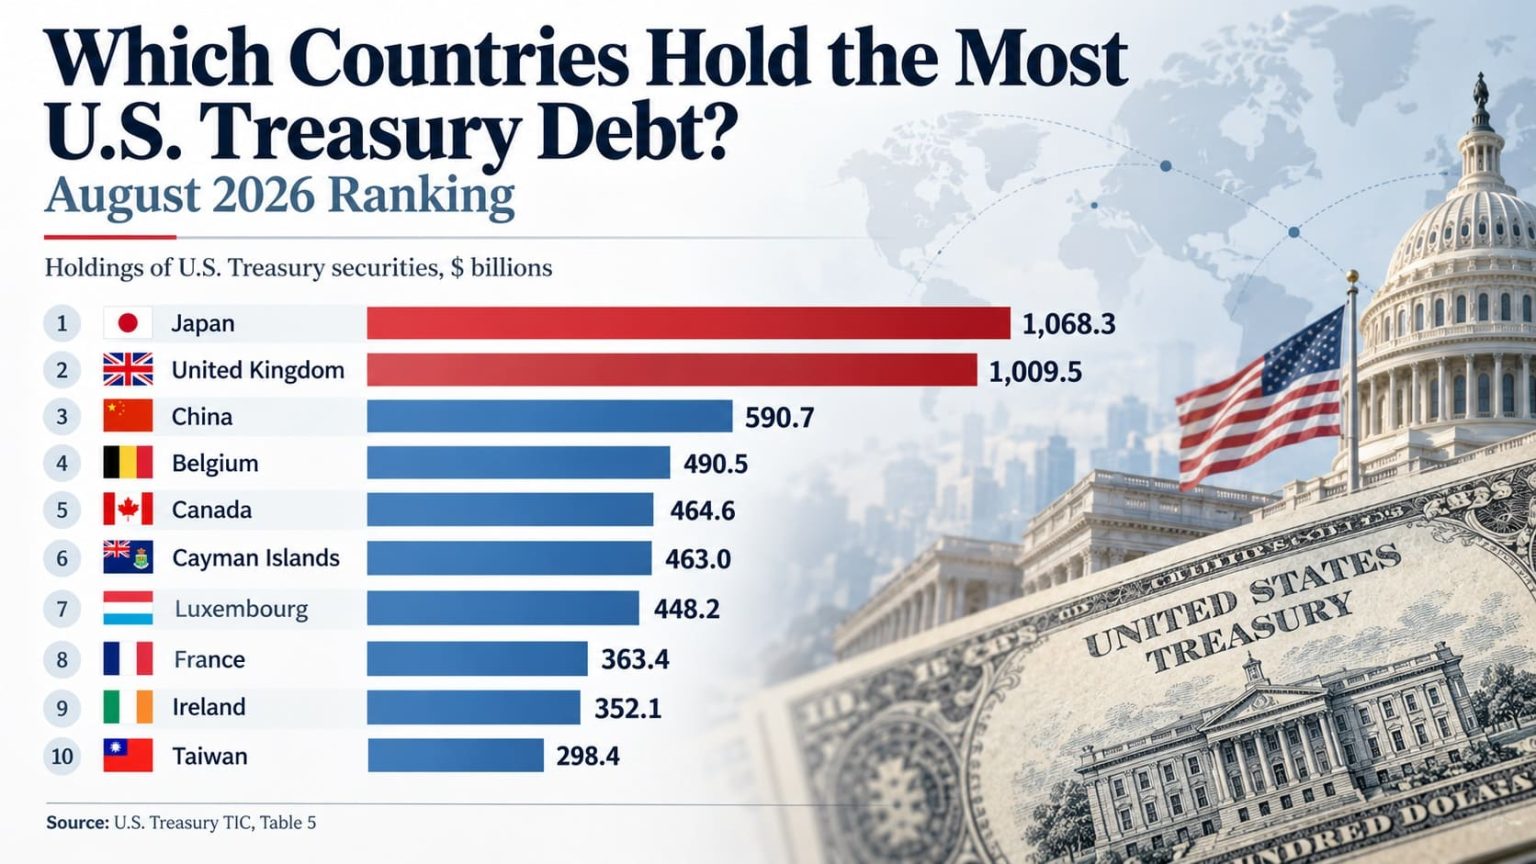
Japan held the largest reported foreign position in U.S. Treasury securities at the end of August 2026: $1,068.3 billion. The United Kingdom followed with $1,009.5 billion and mainland China with $590.7 billion. These are holdings, not purchases made during August.
This descending ranking uses the U.S. Department of the Treasury's official Treasury International Capital (TIC) Table 5: estimated foreign-resident holdings of Treasury bills, notes and bonds, measured in nominal U.S. dollars, billions, at August 31, 2026. Coverage: 20 individually named countries and jurisdictions (not 20 sovereign states); 20 official_value rows, zero calculated holding rows and zero forecasts. Published October 16, 2026; retrieved October 25, 2026.
Important distinction: Treasury's country labels often reflect the location of custodians and intermediaries. The ranking is not a verified list of the governments that ultimately own these securities, and it does not cover every holder of U.S. federal debt.
Japan; official TIC holdings at end-August 2026.
Bermuda; smallest within the 20 listed jurisdictions, not worldwide.
Treasury-published grand total, including the All Other category.
20 named rows in US$ billions; all official_value; one official numeric publisher, August 2026.
Overview: the August 2026 Treasury-holder landscape
The Treasury's monthly data identify $9,331.7 billion in total foreign holdings, compared with $9,249.1 billion in August 2025. The change is +$82.6 billion (+0.9%), calculated from the two source-published month-end stocks. This is not a count of net Treasury purchases.
The 20 named jurisdictions sum to $7,479.3 billion, or 80.1% of the published foreign total. The Treasury groups other holders into All Other: $1,852.3 billion, which is deliberately not ranked as a country. The reported grand total differs by $0.1 billion from the sum of rounded components.
Among the 20 individually listed holdings, the arithmetic mean is $374.0 billion while the median is $292.1 billion. The difference shows why the top-ranked jurisdictions should not be treated as typical of the whole named list. Neither statistic describes the unlisted jurisdictions within All Other.
Top 10 foreign holders of U.S. Treasury securities
The United Kingdom's reported position exceeded $1 trillion and came within $58.8 billion of Japan's. Mainland China remained third at $590.7 billion, followed by Belgium and Canada. The figures are from the same August 2026 observation and unit.
Top 10: Treasury holdings, end-August 2026 (US$ billions)
| Rank | Country / jurisdiction | Holdings | Region / note |
|---|---|---|---|
| 1 | Japan | $1,068.3B | East Asia; U.S. Treasury TIC Table 5; Aug 2026; official_value. |
| 2 | United Kingdom | $1,009.5B | Europe; U.S. Treasury TIC Table 5; Aug 2026; official_value. |
| 3 | China, Mainland | $590.7B | East Asia; U.S. Treasury TIC Table 5; Aug 2026; official_value. |
| 4 | Belgium | $490.5B | Europe; U.S. Treasury TIC Table 5; Aug 2026; official_value. |
| 5 | Canada | $464.6B | North America; U.S. Treasury TIC Table 5; Aug 2026; official_value. |
| 6 | Cayman Islands | $463.0B | Caribbean & North Atlantic; U.S. Treasury TIC Table 5; Aug 2026; official_value. |
| 7 | Luxembourg | $448.2B | Europe; U.S. Treasury TIC Table 5; Aug 2026; official_value. |
| 8 | France | $363.4B | Europe; U.S. Treasury TIC Table 5; Aug 2026; official_value. |
| 9 | Ireland | $352.1B | Europe; U.S. Treasury TIC Table 5; Aug 2026; official_value. |
| 10 | Taiwan | $298.4B | East Asia; U.S. Treasury TIC Table 5; Aug 2026; official_value. |
Ranking follows the official source-published values, descending; all holdings are shown to the source's $0.1 billion precision. Regions are editorial geographic filter labels, not a Treasury classification.
Chart: Top 20 reported Treasury holders in August 2026
The bars compare reported country or jurisdiction positions on the same scale. Japan is set to 100% bar width; each other bar is its holding divided by $1,068.3 billion. Bar length is not a percentage of all foreign holdings.
Methodology and checks
Metric and direction
End-of-month estimated foreign holdings of marketable and nonmarketable U.S. Treasury bills, notes and bonds, in nominal US$ billions. Greater reported value ranks higher. Holdings are a stock, not a transaction flow.
Snapshot and coverage
All 20 named rows use August 2026, with the same historical Treasury table supplying August 2025 comparisons. No data from other reporting years were substituted. All Other is an aggregate, excluded from ranks and the chart.
Source hierarchy and statuses
One numeric publisher: U.S. Treasury TIC Table 5 (official_value for all 20 named positions). Treasury's October 16 release validates timing and limitations, but is not independent numeric sourcing. Federal Reserve commentary supplies context only, not August 2026 rows.
Inclusion, exclusions and limits
Include the 20 countries and jurisdictions individually published in the August column. Do not invent additional countries from All Other, treat territory names as sovereign states, infer final beneficial ownership, or combine this holdings series with the U.S. gross debt series.
StatRanker-calculated comparisons, not source-published forecasts: 12-month dollar change = August 2026 published holding minus August 2025 published holding. The change in percent = dollar change divided by August 2025 holding, multiplied by 100. For example, the United Kingdom: ($1,009.5B − $901.3B) = +$108.2B, or +12.0%. Both historical inputs are source-published observed values; no projection or modeled assumption is used.
Concentration formula: top-three share = ($1,068.3B + $1,009.5B + $590.7B) / $9,331.7B × 100 = 28.6%. Named-20 share = sum of the 20 published holdings ($7,479.3B) / $9,331.7B × 100 = 80.1%. The denominator is total foreign Treasury holdings in the same official table, not total U.S. federal debt.
Mean and median: arithmetic mean = sum of 20 named balances / 20 = $374.0B after rounding; median = ($298.4B + $285.8B) / 2 = $292.1B. The published source gives all values to one decimal place; small differences of $0.1B when reconciling totals can result from rounding.
Country attribution and revisions: TIC primarily uses custodial reporting. A security credited to a UK, Belgian or Cayman Islands custodian may have a different beneficial owner. A change between two month-end positions can reflect transactions, valuation, custody arrangements and later statistical revisions; the source does not establish causation. Each row is marked official_value because its August balance is source-published; the 12-month difference in its note is a separate calculated comparison.
Main ranking: 20 named countries and jurisdictions
Search a jurisdiction, filter by geographic region or publication status, sort by holdings or name, or select Top 10, Top 20 or All. The rank remains the official August 2026 descending order, even when the display is sorted differently.
Showing 20 of 20 named jurisdictions.
August 2026 TIC Table 5 values, ranked highest to lowest (US$ billions)
| Rank | Country / jurisdiction | Holdings | Region / source note |
|---|---|---|---|
| 1 | Japan | $1,068.3B | East Asia; official_value; U.S. Treasury TIC Table 5; Aug 2026. 12-month change: −$115.6B (calculated: Aug 2026 minus Aug 2025 $1,183.9B). |
| 2 | United Kingdom | $1,009.5B | Europe; official_value; U.S. Treasury TIC Table 5; Aug 2026. 12-month change: +$108.2B (calculated: Aug 2026 minus Aug 2025 $901.3B). |
| 3 | China, Mainland | $590.7B | East Asia; official_value; U.S. Treasury TIC Table 5; Aug 2026. 12-month change: −$109.0B (calculated: Aug 2026 minus Aug 2025 $699.7B). |
| 4 | Belgium | $490.5B | Europe; official_value; U.S. Treasury TIC Table 5; Aug 2026. 12-month change: +$39.4B (calculated: Aug 2026 minus Aug 2025 $451.1B). |
| 5 | Canada | $464.6B | North America; official_value; U.S. Treasury TIC Table 5; Aug 2026. 12-month change: +$20.6B (calculated: Aug 2026 minus Aug 2025 $444.0B). |
| 6 | Cayman Islands | $463.0B | Caribbean & North Atlantic; official_value; U.S. Treasury TIC Table 5; Aug 2026. 12-month change: +$52.5B (calculated: Aug 2026 minus Aug 2025 $410.5B). |
| 7 | Luxembourg | $448.2B | Europe; official_value; U.S. Treasury TIC Table 5; Aug 2026. 12-month change: +$37.4B (calculated: Aug 2026 minus Aug 2025 $410.8B). |
| 8 | France | $363.4B | Europe; official_value; U.S. Treasury TIC Table 5; Aug 2026. 12-month change: −$25.7B (calculated: Aug 2026 minus Aug 2025 $389.1B). |
| 9 | Ireland | $352.1B | Europe; official_value; U.S. Treasury TIC Table 5; Aug 2026. 12-month change: +$12.1B (calculated: Aug 2026 minus Aug 2025 $340.0B). |
| 10 | Taiwan | $298.4B | East Asia; official_value; U.S. Treasury TIC Table 5; Aug 2026. 12-month change: −$15.0B (calculated: Aug 2026 minus Aug 2025 $313.4B). |
| 11 | Switzerland | $285.8B | Europe; official_value; U.S. Treasury TIC Table 5; Aug 2026. 12-month change: −$17.2B (calculated: Aug 2026 minus Aug 2025 $303.0B). |
| 12 | Singapore | $277.9B | Southeast Asia; official_value; U.S. Treasury TIC Table 5; Aug 2026. 12-month change: +$16.9B (calculated: Aug 2026 minus Aug 2025 $261.0B). |
| 13 | Hong Kong | $261.5B | East Asia; official_value; U.S. Treasury TIC Table 5; Aug 2026. 12-month change: +$9.6B (calculated: Aug 2026 minus Aug 2025 $251.9B). |
| 14 | India | $219.7B | South Asia; official_value; U.S. Treasury TIC Table 5; Aug 2026. 12-month change: +$0.3B (calculated: Aug 2026 minus Aug 2025 $219.4B). |
| 15 | Norway | $214.0B | Europe; official_value; U.S. Treasury TIC Table 5; Aug 2026. 12-month change: −$0.9B (calculated: Aug 2026 minus Aug 2025 $214.9B). |
| 16 | Brazil | $168.4B | South America; official_value; U.S. Treasury TIC Table 5; Aug 2026. 12-month change: −$16.2B (calculated: Aug 2026 minus Aug 2025 $184.6B). |
| 17 | Saudi Arabia | $141.2B | Middle East; official_value; U.S. Treasury TIC Table 5; Aug 2026. 12-month change: +$8.2B (calculated: Aug 2026 minus Aug 2025 $133.0B). |
| 18 | Korea, South | $134.2B | East Asia; official_value; U.S. Treasury TIC Table 5; Aug 2026. 12-month change: −$1.6B (calculated: Aug 2026 minus Aug 2025 $135.8B). |
| 19 | United Arab Emirates | $116.1B | Middle East; official_value; U.S. Treasury TIC Table 5; Aug 2026. 12-month change: +$7.4B (calculated: Aug 2026 minus Aug 2025 $108.7B). |
| 20 | Bermuda | $111.8B | Caribbean & North Atlantic; official_value; U.S. Treasury TIC Table 5; Aug 2026. 12-month change: +$12.9B (calculated: Aug 2026 minus Aug 2025 $98.9B). |
Each row's holdings are official_value for August 2026. Its 12-month change is independently calculated from the August 2025 observation shown in the same Treasury table. Source and month are supplied in each row; external URLs appear only in Sources.
Four findings from the August 2026 data
Key insight: three holders, 28.6%
Japan (#1, $1,068.3B), the UK (#2, $1,009.5B) and mainland China (#3, $590.7B) together hold $2,668.5B in the reported TIC locations. That equals 28.6% of the $9,331.7B foreign total, not 28.6% of all U.S. federal debt.
Notable pattern: a narrowing lead
Japan's lead over the UK fell from $282.6B in August 2025 to $58.8B in August 2026, a $223.8B narrowing. Over the same comparison, Japan's reported holdings fell $115.6B while the UK's rose $108.2B.
Regional concentration: Europe in the Top 10
Five of the Top 10 published jurisdictions are geographically European: UK, Belgium, Luxembourg, France and Ireland. Together they account for $2,663.7B, or 48.0% of the Top 10's $5,548.7B; this is a geographic grouping of custody-based locations.
Outlier: Cayman Islands near Canada
The Cayman Islands rank #6 at $463.0B, just $1.6B below Canada's $464.6B at #5. The Cayman Islands' published balance rose $52.5B from August 2025, but this is not evidence that its government owns $463.0B.
What this ranking does—and does not—mean
The TIC figures describe foreign-resident positions in U.S. Treasuries, attributed according to reporting and custody arrangements. They help locate large cross-border securities positions, but not identify the ultimate investor behind each location. An institution in a financial center can hold securities for customers in several other economies.
Moreover, the Treasury reports a separate $3,755.6B foreign-official subset in August 2026, equal to 40.2% of the $9,331.7B foreign total. That aggregate includes official institutions but cannot be assigned to the individual country rows by simple subtraction. Do not read every jurisdiction's balance as its central bank's holdings.
Finally, end-of-month holdings should not be equated with August net buying, the U.S. budget deficit, interest owed, Treasury yields, foreign ownership of all American assets, or a country's willingness to lend in the future. Those questions require different datasets and definitions.
Frequently asked questions
Which foreign country had the largest reported U.S. Treasury holdings in August 2026?
Japan ranked first at $1,068.3 billion, ahead of the United Kingdom ($1,009.5 billion) and mainland China ($590.7 billion). These are TIC-reported country or custody locations, not necessarily final beneficial owners.
Are these official August 2026 values or 2026 forecasts?
The holdings are official values published by the U.S. Treasury for August 31, 2026, released October 16, 2026. There are no projected or modeled holding rows.
Does China hold more U.S. Treasury securities than the United Kingdom?
No. Mainland China's listed August 2026 balance was $590.7B, compared with $1,009.5B for the United Kingdom, a $418.8B difference in the reported TIC locations. This does not establish ultimate ownership by either government.
Why are the Cayman Islands and Bermuda included?
Treasury's source groups foreign holdings by countries and jurisdictions, including non-sovereign financial centers. The Cayman Islands appear at #6 ($463.0B) and Bermuda at #20 ($111.8B). Their inclusion is not a claim that they are independent countries.
Why are there only 20 ranked entries instead of a Top 50?
The official Major Foreign Holders Table 5 individually publishes 20 names for August 2026 and combines the rest into All Other ($1,852.3B). All Other has no single country identity, so it is excluded from the ranked list.
Are these balances all held by foreign governments or central banks?
No. The $9,331.7B grand total covers foreign-resident holdings. Treasury separately reports $3,755.6B held by foreign official institutions, or 40.2% of the foreign total. The country-level table does not reliably identify every security's final beneficial owner.
How are the 12-month changes calculated?
For each jurisdiction, subtract its source-published August 2025 value from its August 2026 value. For mainland China, $590.7B − $699.7B = −$109.0B (about −15.6%). These are calculated changes between observed stocks, not official purchase-flow data or forecasts.
Why might reported holdings change without an equivalent purchase or sale?
The two monthly observations can reflect market valuation, custody location, reporting and revision effects alongside transactions. Treasury warns that custodial records do not always identify ultimate ownership. Separate TIC flow datasets are required to study purchases and sales.
Can the numbers be interpreted as shares of total U.S. national debt?
No. The article's concentration percentages use the $9,331.7B foreign-holdings denominator from TIC Table 5. Total federal debt and debt held by the public are different measures and are not used as denominators here.
Sources and their roles
U.S. Treasury: Major Foreign Holders, Table 5
All August 2026 and August 2025 country-level inputs; foreign grand total, foreign-official subset, All Other category and custody caveats. This is the sole numeric publisher for the ranking.
https://ticdata.treasury.gov/Publish/slt_table5.htmlU.S. Treasury: August 2026 TIC release
Validates the October 16, 2026 publication date and explains why custody-based country attribution is imperfect. It is not a second independent numeric source.
https://home.treasury.gov/news/press-releases/sb0662/U.S. Treasury: Securities (B) and TIC reporting
Defines Major Foreign Holders Table 5 and its source framework, and identifies related monthly holdings and transaction/valuation files. Not an additional numeric publisher.
https://home.treasury.gov/data/treasury-international-capital-tic-system-home-page/tic-forms-instructions/securities-b-portfolio-holdings-of-us-and-foreign-securitiesFederal Reserve Bank of St. Louis: FRED Blog
Provides independent institutional discussion of TIC country holdings and their use for cross-border analysis, published June 15, 2026. Not used for August 2026 numerical rows.
https://fred.stlouisfed.org/blog/2026/06/who-holds-us-treasury-securities-overseas/