

Homeownership Rate by U.S. State: 2025 Ranking of All 50 States
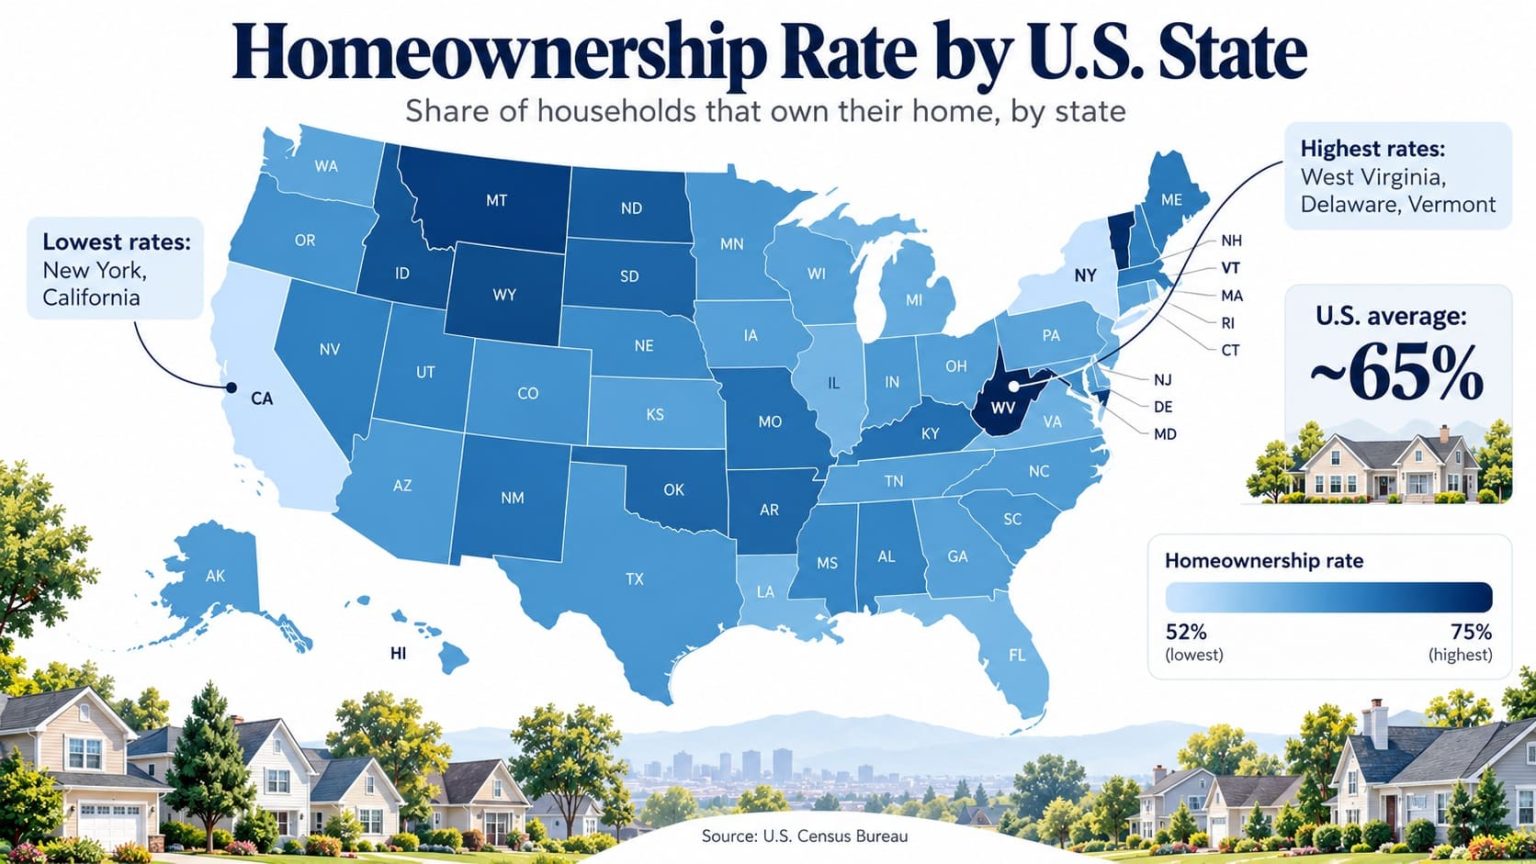
Which U.S. States Had the Highest Homeownership Rates in 2025?
West Virginia ranked first at 78.1%, followed by Delaware (75.5%) and Vermont (75.3%). New York ranked last among the 50 states at 52.2%. The U.S. homeownership rate was 65.2% in the same annual Census series.
This ranking measures the percentage of occupied housing units lived in by their owner, not the share of residents who own real estate. The values are official, survey-based estimates from the U.S. Census Bureau's Current Population Survey/Housing Vacancy Survey (CPS/HVS), annual 2025, Table 15. Higher rates rank higher. Unit: percent (%); values are published to one decimal place.
Data scope: 50 U.S. states, 2025; 50 officially published Census estimates, with no modeled or forecast state rates. District of Columbia is excluded from the state ranking and shown only as context. Retrieved: October 13, 2026. The 2025 annual survey omits October 2025, a documented limitation discussed below.
West Virginia · rank 1
New York · rank 50
Census CPS/HVS · 2025, not a state average
U.S. Census Bureau · official 2025 estimates
Overview: Homeownership in the United States
The homeownership rate is the share of occupied homes occupied by their owners. A mortgaged home counts as owner-occupied when its owner lives there. Vacant homes do not enter the denominator. This makes the rate a measure of housing tenure rather than the number of homeowners or properties.
The 50-state ranking spans 25.9 percentage points, from West Virginia at 78.1% to New York at 52.2%. The median state is at 68.3%; 35 states are above the separately calculated, household-weighted national rate of 65.2%, while 15 are below it. These comparisons use reported point estimates and do not establish statistically significant differences.
For year-over-year context, the Census national annual rate was 65.6% in 2024 and 65.2% in 2025, a descriptive decrease of 0.4 percentage points. Unlike 2024, the 2025 annual CPS/HVS estimates omit one survey month, so small changes require particular caution.
Top 10 States by Homeownership Rate in 2025
West Virginia leads Delaware by 2.6 percentage points. The Top 10 includes five Southern states, three Northeastern states, one Midwestern state and one Western state under the Census Bureau's four-region classification.
Official annual CPS/HVS rates · 2025 · percent of occupied housing units
| Rank | State | Rate | Region / source note |
|---|---|---|---|
| 1 | West Virginia | 78.1% | South · 2025 Census CPS/HVS Table 15 (official estimate). |
| 2 | Delaware | 75.5% | South · 2025 Census CPS/HVS Table 15 (official estimate). |
| 3 | Vermont | 75.3% | Northeast · 2025 Census CPS/HVS Table 15 (official estimate). |
| 4 | Mississippi | 74.9% | South · 2025 Census CPS/HVS Table 15 (official estimate). |
| 5 | Maine | 74.7% | Northeast · 2025 Census CPS/HVS Table 15 (official estimate). |
| 6 | Michigan | 74.0% | Midwest · 2025 Census CPS/HVS Table 15 (official estimate). |
| 7 | Wyoming | 73.7% | West · 2025 Census CPS/HVS Table 15 (official estimate). |
| 8 | New Hampshire | 73.3% | Northeast · 2025 Census CPS/HVS Table 15 (official estimate). |
| 9 | South Carolina | 73.0% | South · 2025 Census CPS/HVS Table 15 (official estimate). |
| 10 | Kentucky | 72.4% | South · 2025 Census CPS/HVS Table 15 (official estimate). |
Chart: Top 20 Homeownership Rates
Bars show the published 2025 percentages on a common 0%–100% scale. The chart does not rebase each rate to the top state, which would visually exaggerate small percentage-point differences.
Virginia closes the Top 20 at 69.6%, 8.5 percentage points below West Virginia's 78.1%.
Methodology and Data Quality
Metric and denominator
Homeownership rate (%) = owner-occupied housing units ÷ all occupied housing units × 100. The denominator includes owner- and renter-occupied households but excludes vacant homes. The published rates, rather than independently reconstructed household counts, are ranked here.
Period and source status
All 50 entries use 2025 annual U.S. Census Bureau CPS/HVS Table 15 rates. Each state rate is an official, survey-based Census estimate, not a forecast or a StatRanker calculation. No 2024 ACS figures, ZIP codes, municipalities or quarterly rates are mixed into the state ranking.
2025 survey coverage
The Census Bureau did not collect October 2025 CPS/HVS observations due to a lapse in federal funding. Its 2025 annual estimates therefore use 11 months, January–September and November–December, and the Bureau warns of increased uncertainty. Margins of error are published separately in Table B-3. The Census Bureau also began phasing in an updated CPS sample in April 2025; this is disclosed in its Source and Accuracy documentation.
Ranking and ties
Descending order from the Census-published one-decimal percentages. Equal published rates share a competition rank: Idaho, Missouri and Utah are all rank 25 at 68.3%, followed by rank 28. Sorting alphabetically changes display order only, not the published-rate rank. The Census publishes rates to one decimal place; unreported digits are not used to break ties.
Geographic scope
Exactly the 50 states; District of Columbia is a separate federal district and is excluded. Regions are the four Census regions: Northeast (9), Midwest (12), South (16) and West (13). State regions are provided in every row.
Source roles and checks
Numeric: U.S. Census Bureau CPS/HVS, 2025 Table 15 (one publishing organization). Validation: Federal Reserve Bank of St. Louis FRED series and StatsAmerica. Methodology: Census definitions and source/accuracy documentation. No values from unrelated surveys are blended or averaged.
Original calculations
Top–bottom gap = 78.1 − 52.2 = 25.9 pp. Median = average of positions 25 and 26 in the sorted 50-state set = (68.3 + 68.3) ÷ 2 = 68.3%. Unweighted mean = 3,396.5 percentage points across 50 states ÷ 50 = 67.93%. State-count shares use 50 states as denominator.
Rounding and limits
Census rates are reported to 0.1 percentage point. Derived differences use those displayed inputs; pp means percentage points, not relative percent change. Regional or state averages of these rates are not the Census national rate. Rankings do not measure affordability, property values, mortgage debt, individual ownership or differences within states.
Inclusion: a named U.S. state with a published 2025 annual CPS/HVS homeownership rate. Exclusions: District of Columbia, territories, unoccupied housing, ACS multiyear owner-occupancy rates, other reporting years and projections. All 50 state rates come from the same 2025 Census survey, without combining different reporting years or survey methods. Source URLs are listed in Sources.
Full 2025 Homeownership Ranking: All 50 States
Search for a state, filter by Census region or value status, or sort existing entries. The Top 10 and Top 20 controls refer to original ranking positions even when a different sort is selected.
2025 Census CPS/HVS Table 15 · annual rates · official published estimates, shown to one decimal place
| Rank | State | Rate | Region / source note |
|---|---|---|---|
| 1 | West Virginia | 78.1% | South · 2025 Census CPS/HVS Table 15 (official estimate). |
| 2 | Delaware | 75.5% | South · 2025 Census CPS/HVS Table 15 (official estimate). |
| 3 | Vermont | 75.3% | Northeast · 2025 Census CPS/HVS Table 15 (official estimate). |
| 4 | Mississippi | 74.9% | South · 2025 Census CPS/HVS Table 15 (official estimate). |
| 5 | Maine | 74.7% | Northeast · 2025 Census CPS/HVS Table 15 (official estimate). |
| 6 | Michigan | 74.0% | Midwest · 2025 Census CPS/HVS Table 15 (official estimate). |
| 7 | Wyoming | 73.7% | West · 2025 Census CPS/HVS Table 15 (official estimate). |
| 8 | New Hampshire | 73.3% | Northeast · 2025 Census CPS/HVS Table 15 (official estimate). |
| 9 | South Carolina | 73.0% | South · 2025 Census CPS/HVS Table 15 (official estimate). |
| 10 | Kentucky | 72.4% | South · 2025 Census CPS/HVS Table 15 (official estimate). |
| 11 | Indiana | 71.4% | Midwest · 2025 Census CPS/HVS Table 15 (official estimate). |
| 12 | Alabama | 71.3% | South · 2025 Census CPS/HVS Table 15 (official estimate). |
| 13 | Minnesota | 71.2% | Midwest · 2025 Census CPS/HVS Table 15 (official estimate). |
| 14 | New Mexico | 71.0% | West · 2025 Census CPS/HVS Table 15 (official estimate). |
| 15 | Montana | 70.7% | West · 2025 Census CPS/HVS Table 15 (official estimate). |
| 16 | Ohio | 70.3% | Midwest · 2025 Census CPS/HVS Table 15 (official estimate). |
| 17 | Iowa | 70.2% | Midwest · 2025 Census CPS/HVS Table 15 (official estimate). |
| 18 | Pennsylvania | 70.1% | Northeast · 2025 Census CPS/HVS Table 15 (official estimate). |
| 19 | Arizona | 69.7% | West · 2025 Census CPS/HVS Table 15 (official estimate). |
| 20 | Virginia | 69.6% | South · 2025 Census CPS/HVS Table 15 (official estimate). |
| 21 | Tennessee | 69.5% | South · 2025 Census CPS/HVS Table 15 (official estimate). |
| 22 | Louisiana | 69.3% | South · 2025 Census CPS/HVS Table 15 (official estimate). |
| 23 | Arkansas | 68.9% | South · 2025 Census CPS/HVS Table 15 (official estimate). |
| 24 | Maryland | 68.8% | South · 2025 Census CPS/HVS Table 15 (official estimate). |
| 25 (tie) | Idaho | 68.3% | West · 2025 Census CPS/HVS Table 15 (official estimate). |
| 25 (tie) | Missouri | 68.3% | Midwest · 2025 Census CPS/HVS Table 15 (official estimate). |
| 25 (tie) | Utah | 68.3% | West · 2025 Census CPS/HVS Table 15 (official estimate). |
| 28 | South Dakota | 68.1% | Midwest · 2025 Census CPS/HVS Table 15 (official estimate). |
| 29 | Wisconsin | 67.7% | Midwest · 2025 Census CPS/HVS Table 15 (official estimate). |
| 30 | Kansas | 67.5% | Midwest · 2025 Census CPS/HVS Table 15 (official estimate). |
| 31 | Nebraska | 67.2% | Midwest · 2025 Census CPS/HVS Table 15 (official estimate). |
| 32 | Connecticut | 66.6% | Northeast · 2025 Census CPS/HVS Table 15 (official estimate). |
| 33 | Illinois | 66.3% | Midwest · 2025 Census CPS/HVS Table 15 (official estimate). |
| 34 | Florida | 66.2% | South · 2025 Census CPS/HVS Table 15 (official estimate). |
| 35 | Alaska | 65.3% | West · 2025 Census CPS/HVS Table 15 (official estimate). |
| 36 | Rhode Island | 65.1% | Northeast · 2025 Census CPS/HVS Table 15 (official estimate). |
| 37 | North Dakota | 64.9% | Midwest · 2025 Census CPS/HVS Table 15 (official estimate). |
| 38 | North Carolina | 64.5% | South · 2025 Census CPS/HVS Table 15 (official estimate). |
| 39 | Oregon | 64.1% | West · 2025 Census CPS/HVS Table 15 (official estimate). |
| 40 | Georgia | 63.9% | South · 2025 Census CPS/HVS Table 15 (official estimate). |
| 41 | Oklahoma | 63.8% | South · 2025 Census CPS/HVS Table 15 (official estimate). |
| 42 | New Jersey | 63.7% | Northeast · 2025 Census CPS/HVS Table 15 (official estimate). |
| 43 | Texas | 63.6% | South · 2025 Census CPS/HVS Table 15 (official estimate). |
| 44 | Washington | 63.4% | West · 2025 Census CPS/HVS Table 15 (official estimate). |
| 45 | Colorado | 62.9% | West · 2025 Census CPS/HVS Table 15 (official estimate). |
| 46 | Massachusetts | 62.4% | Northeast · 2025 Census CPS/HVS Table 15 (official estimate). |
| 47 | Hawaii | 60.9% | West · 2025 Census CPS/HVS Table 15 (official estimate). |
| 48 | Nevada | 59.1% | West · 2025 Census CPS/HVS Table 15 (official estimate). |
| 49 | California | 55.3% | West · 2025 Census CPS/HVS Table 15 (official estimate). |
| 50 | New York | 52.2% | Northeast · 2025 Census CPS/HVS Table 15 (official estimate). |
Ties use competition ranking from the published one-decimal rate. U.S. (65.2%) and Washington, D.C. (40.3%) are reference values, not additional ranked states. All rows use 2025 official published estimates.
Four Findings From the 2025 State Data
Key Insight: 25.9-Point State Gap
West Virginia (rank 1, 78.1%) exceeds New York (rank 50, 52.2%) by 25.9 percentage points. Relative to the national 65.2% benchmark, the two states are +12.9 and −13.0 points, respectively.
Notable Pattern: Most States Exceed the U.S. Rate
35 of 50 states (70%) are above 65.2%; the remaining 15 (30%) are below. The unweighted state median is 68.3%, or 3.1 points above the national rate. The national measure is not the unweighted average of state rates.
Regional Concentration in the Top 10
Of the 10 highest rates, 5 states are in the Census South, 3 in the Northeast, 1 in the Midwest and 1 in the West. In the full 50-state set, the South has 16 states; this is a count of states, not a share of households.
Outlier: D.C. Sits Below Every State
Washington, D.C. has a separately reported 40.3% 2025 homeownership rate, 11.9 percentage points below New York's 52.2%, the lowest of the 50 states. D.C. is deliberately unranked here because it is not a state.
What This Ranking Can—and Cannot—Tell You
A state's position describes the proportion of occupied homes that are owner-occupied in the CPS/HVS survey. It does not tell you whether buying a home is affordable there, how many households own multiple properties, how much owners paid, or whether a renter could qualify for a mortgage.
The percentages are survey estimates. Close ranks (for example, 68.3% versus 68.1%) can be within sampling uncertainty; a rank alone is not evidence of a meaningful statistical separation. Census publishes margins of error separately, and the 2025 missing survey month increases the need for care. The figures also cannot explain causes such as prices, urbanization or demographics without separate research.
For comparisons over time, use the same CPS/HVS annual series and distinguish a percentage-point difference from a statistically significant change. Do not substitute a five-year ACS rate, a quarterly snapshot, or a rate computed from all housing units without clearly changing the metric.
FAQ: State Homeownership Rates in 2025
Which state had the highest homeownership rate in 2025?
West Virginia ranked first at 78.1% in the Census CPS/HVS annual 2025 estimates, followed by Delaware at 75.5% and Vermont at 75.3%.
Which state had the lowest homeownership rate?
New York was last among the 50 states at 52.2%. California was next-lowest at 55.3%, a difference of 3.1 percentage points.
What was the U.S. homeownership rate in 2025?
The officially published national annual rate was 65.2%, compared with 65.6% in 2024. It is weighted by occupied households and should not be confused with the 67.93% unweighted average of 50 state rates.
How is a homeownership rate calculated?
Owner-occupied housing units divided by all occupied housing units, multiplied by 100. An owner living in a home with a mortgage counts; a vacant home does not enter the denominator. All state rates here are Census-published values, not recomputed from household counts.
Does Washington, D.C. appear in the ranking?
No. This page ranks 50 states only. The District of Columbia's separately published 2025 rate is 40.3%; it is included as context, not as rank 51.
Was the annual 2025 survey based on all 12 months?
No. Census documents that October 2025 CPS/HVS data were not collected. Annual 2025 estimates use 11 months, and the Bureau advises users to consider the margins of error.
Why do Idaho, Missouri and Utah share rank 25?
Each has a published 2025 value of 68.3%. With no additional official precision assumed, they share rank 25 and the next published-value rank is 28.
Are these official values or calculated projections?
All 50 state rates are official annual Census survey estimates for 2025. StatRanker calculates only rank order, gaps, counts, an unweighted mean and the median from those published rates. No 2026 estimate, forecast or modeled projection is used.
Is this the same as the ACS owner-occupied housing unit rate?
No. This page uses the Census CPS/HVS annual homeownership series for a uniform 2025 comparison. American Community Survey housing-tenure estimates use a different survey design and release series; the two should not be silently combined.
Sources and Verification
U.S. Census Bureau — 2025 Annual Table 15
Official homeownership rates for all states; exclusive numeric source for the 50 ranking values and their 2025 year labels.
https://www.census.gov/housing/hvs/files/annual25/ann25t_15.xlsx
U.S. Census Bureau — 2025 Source and Accuracy
Survey design, margins-of-error warnings and Census confirmation that October 2025 was omitted from the annual series.
https://www.census.gov/housing/hvs/files/annual25/ann25src.pdf
U.S. Census Bureau — 2025 Definitions
Homeownership, owner occupancy and geographic-region classifications. Methodological support, not an additional numeric publisher.
https://www.census.gov/housing/hvs/files/annual25/ann25def.pdf
Federal Reserve Bank of St. Louis — FRED
Census-sourced annual homeownership series used to cross-check the U.S. rate and selected state values and their 2024–2025 periods; not treated as independent numeric measurements.
StatsAmerica — States in Profile
Independent republication of the Census 2025 state rates used to check statewide coverage and edge/tie values. The underlying numeric publisher remains the Census Bureau.
https://www.statsamerica.org/sip/rank_list.aspx?rank_label=hou20
U.S. Census Bureau — 2025 Table B-3 (Margins of Error)
Published uncertainty measures for annual state vacancy and homeownership rate estimates; supports cautions about closely ranked states, not an additional source of ranking values.
https://www.census.gov/housing/hvs/files/annual25/ann25t_b3.xlsx
U.S. Census Bureau — Annual HVS Statistics Index
Publication index identifying 2025 Table 15 and separate Table B-3 margins of error. Same Census organization, not an additional source count.
