

Crypto Adoption by Country 2026: Chainalysis Top 20 Ranking
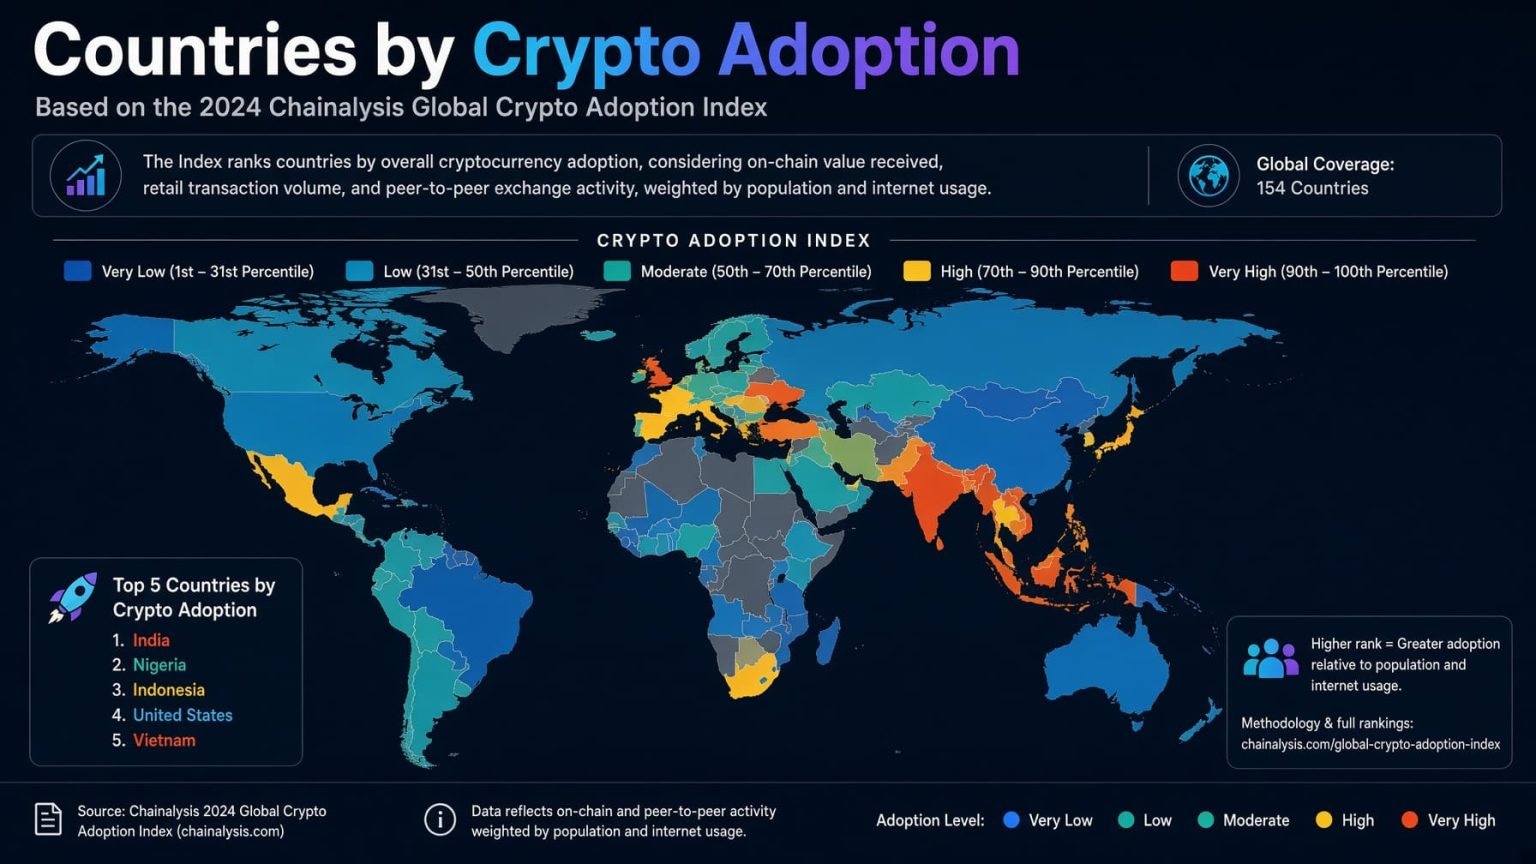
2026 Global Crypto Adoption Index: Verified Top 20 Countries
Brazil ranks first in the 2026 Chainalysis Global Crypto Adoption Index, followed by the United States and Nigeria. The index measures grassroots crypto adoption across four dimensions: service inflows, domestic peer-to-peer transfers, cross-border transfers and on-chain balances.
The index covers the 12 months from July 1, 2025 through June 30, 2026. Chainalysis ranks 117 countries with sufficient data, but its publicly tabulated release provides reproducible overall and component ranks for the Top 20. StatRanker therefore publishes those 20 verified positions rather than inferring ranks that are not present in the public table.
Metric: Chainalysis Global Crypto Adoption Index overall rank. Source type: single-source official index with independent cross-source validation. Coverage on this page: 20 publicly tabulated countries out of 117 ranked. Unit: ordinal rank position. Lower rank is better. Status: 20 official_value rows. Data retrieved October 4, 2026.
Brazil ranks in the Top 4 in all four Chainalysis components: #3 flows, #4 balances, #3 P2P and #2 cross-border.
Türkiye is the twentieth and final country in the publicly tabulated Chainalysis 2026 Top 20.
Chainalysis ranks 117 countries; this page includes all 20 positions published in its reproducible public table.
Chainalysis overall index rank; July 2025–June 2026 period; 20 rows classified as official_value.
How to read the 2026 crypto adoption ranking
This index is not a ranking of countries by the number of cryptocurrency owners or by raw exchange trading volume. Chainalysis combines four different dimensions of activity so that the final rank reflects breadth of adoption rather than strength in only one channel.
Brazil illustrates that design. It ranks #3 in total service flows, #4 in balances, #3 in domestic P2P activity and #2 in cross-border flows. It does not lead any individual component, but its consistently strong positions produce the #1 overall rank.
Other countries reach the top through very different profiles. The United States ranks #1 in service flows and #1 in balances but only #20 in domestic P2P. Nigeria ranks #18 in total flows and #18 in balances while ranking #1 in both P2P and cross-border flows.
Historical comparisons also require caution. The 2026 index uses a substantially redesigned methodology, so movements from the 2025 ranking describe changes in published rank but cannot be treated as a pure year-over-year growth measure.
Top 10 countries for crypto adoption in 2026
The first ten positions show several different adoption profiles. Brazil is highly balanced across all four components, while the United States is strongest in service flows and balances and Nigeria is strongest in peer-to-peer and cross-border activity.
Official Chainalysis 2026 Top 10
| Rank | Country | Overall rank | Region / note |
|---|---|---|---|
| 1 | Brazil | #1 | South America; official_value; flows #3, balances #4, P2P #3, cross-border #2. |
| 2 | United States of America | #2 | Northern America; official_value; flows #1, balances #1, P2P #20, cross-border #11. |
| 3 | Nigeria | #3 | Western Africa; official_value; flows #18, balances #18, P2P #1, cross-border #1. |
| 4 | Japan | #4 | Eastern Asia; official_value; flows #4, balances #7, P2P #10, cross-border #4. |
| 5 | Republic of Korea | #5 | Eastern Asia; official_value; flows #5, balances #2, P2P #12, cross-border #12. |
| 6 | India | #6 | Southern Asia; official_value; flows #2, balances #3, P2P #16, cross-border #16. |
| 7 | Ukraine | #7 | Eastern Europe; official_value; flows #8, balances #8, P2P #6, cross-border #6. |
| 8 | Thailand | #8 | South-eastern Asia; official_value; flows #25, balances #6, P2P #5, cross-border #8. |
| 9 | South Africa | #9 | Southern Africa; official_value; flows #33, balances #16, P2P #4, cross-border #3. |
| 10 | Canada | #10 | Northern America; official_value; flows #15, balances #9, P2P #7, cross-border #7. |
Overall rank and component ranks are published by Chainalysis. Geographic subregions use the United Nations Statistics Division M49 classification and do not affect ranking calculations.
Chart: rank positions across the verified Top 20
Because the metric is an ordinal rank rather than a magnitude, the chart uses position markers instead of bar lengths. The left edge represents #1 and the right edge represents #20. This preserves the same raw rank values used in the table without implying that a larger rank means stronger adoption.
Methodology
The primary metric is the Chainalysis 2026 Global Crypto Adoption Index overall rank. Lower values rank higher, so #1 is the strongest position. The index covers July 1, 2025 through June 30, 2026. StatRanker accessed the sources used on this page on October 4, 2026.
Metric and unit
Metric: overall grassroots crypto-adoption rank published by Chainalysis. Unit: ordinal rank position. Direction: ascending. No synthetic adoption score is created by StatRanker.
Coverage
Chainalysis reports 117 countries with sufficient data. This page includes the 20 countries for which the 2026 release publishes a reproducible overall and component-rank table.
Data status
official_value means an overall or component rank directly published by Chainalysis for its own index. All 20 rows in the main ranking use this status.
Geographic metadata
Region filters use UN Statistics Division M49 geographic subregions. These classifications are metadata only and are not part of the Chainalysis ranking methodology.
Source hierarchy
Chainalysis is the numeric and methodology source for the main ranking. UN M49 supplies region metadata. TRM Labs is an independent validation source for a separate retail-volume metric.
Missing positions
Ranks outside the publicly tabulated Chainalysis Top 20 are excluded. They are not reconstructed from previous years, secondary reporting or another provider's index.
How Chainalysis constructs the 2026 index
Chainalysis combines four sub-indexes: service inflows, domestic peer-to-peer transfers, cross-border transfers and on-chain balances. It states that raw values are adjusted for purchasing power, normalized to a common 0-to-1 scale using min-max normalization, and combined using the geometric mean of the four normalized scores.
Country attribution is a separate part of the methodology. Personal wallets can be geolocated using behavioral indicators. For pooled service addresses, Chainalysis allocates activity according to website traffic by country. It additionally weights country traffic shares by the square root of GDP per capita before renormalizing the shares. That adjustment changes how a service's activity is distributed between countries but does not change the service's global total.
StatRanker-calculated analytics
Component-rank spread is calculated as: maximum component rank − minimum component rank. For Brazil, max(3, 4, 3, 2) − min(3, 4, 3, 2) = 4 − 2 = 2. For South Africa, max(33, 16, 4, 3) − min(33, 16, 4, 3) = 33 − 3 = 30.
Historical overlap is calculated from the intersection of the official 2025 and 2026 published Top 20 lists. Fourteen of 20 countries appear in both lists, equal to 70%. Because the source methodology changed, this statistic measures list overlap rather than a like-for-like change in adoption.
Regional concentration uses UN M49 geographic metadata. Nine of the 20 countries, or 45%, belong to Asian M49 subregions: Eastern Asia, South-eastern Asia, Southern Asia or Western Asia.
Independent TRM Labs cross-check
TRM Labs measures a different concept: attributed retail crypto volume across more than 200 jurisdictions during Q1 2026. Its ranking is not merged with Chainalysis. It is used only to test whether countries that appear prominently in a different industry dataset also tend to appear near the top of the Chainalysis ranking.
The TRM page contains an internal conflict between its structured Top 10 table and some narrative statements on the same page. For reproducibility, StatRanker uses the structured country table as the numeric source throughout this comparison. For example, the structured table lists Türkiye at #6 with $34.9 billion and −7% year over year, while narrative text elsewhere on the page describes Türkiye as #5 at about $40 billion and +7%. These conflicting versions are not averaged.
TRM Labs structured Top 10 table compared with Chainalysis 2026
| Country | Chainalysis rank | TRM structured table | Status / method note |
|---|---|---|---|
| United States | #2 | #1 · $213.3B | Chainalysis official_value; TRM industry_observed_value; separate metrics. |
| Republic of Korea | #5 | #2 · $66.6B | Structured TRM table used; not merged into overall rank. |
| Russian Federation | #16 | #3 · $47.5B | Structured TRM table used; separate retail-volume scope. |
| India | #6 | #4 · $46.2B | Structured TRM table used; separate retail-volume scope. |
| Brazil | #1 | #5 · $40.4B | Structured TRM table used; separate retail-volume scope. |
| Türkiye | #20 | #6 · $34.9B | TRM structured table takes precedence over conflicting narrative text. |
| United Kingdom | #17 | #7 · $34.6B | Structured TRM table used; separate retail-volume scope. |
| Viet Nam | #18 | #8 · $31.6B | Structured TRM table used; separate retail-volume scope. |
| Ukraine | #7 | #9 · $29.0B | Structured TRM table used; separate retail-volume scope. |
| Germany | #13 | #10 · $25.3B | Structured TRM table used; separate retail-volume scope. |
All 10 countries in the TRM structured Top 10 also appear in the Chainalysis Top 20. After reranking these same 10 countries within the shared subset, the Spearman rank correlation is approximately 0.491. Formula: ρ = 1 − 6Σd² / [n(n² − 1)], with n = 10 and Σd² = 84. This is a StatRanker-calculated validation statistic, not a source-published index value.
Rounding, conflicts and limitations
Chainalysis rank values are integers and require no rounding. TRM retail volumes are shown to one decimal place exactly as presented in its structured table. Conflicting values are never averaged: an explicit row-level table takes precedence for the TRM comparison, and the conflict is disclosed above.
Chainalysis notes that web-traffic country attribution can be imperfect because of VPN use, bots and other geolocation limitations. The index is relative, so a country's rank can change because of its own activity, changes elsewhere, or methodological revisions.
The metric does not directly measure the percentage of residents who own crypto, the number of wallets, legal friendliness, investment returns, regulatory safety, crypto wealth or raw trading volume alone.
Main ranking: crypto adoption by country in 2026
Use the controls to search countries, filter by UN M49 geographic subregion or data status, change sort order, or display the Top 10 or all 20 verified rows.
2026 Chainalysis Global Crypto Adoption Index — verified published Top 20
| Rank | Country | Overall rank | Region / note |
|---|---|---|---|
| 1 | Brazil | #1 | South America; Chainalysis 2026; official_value; flows #3, balances #4, P2P #3, cross-border #2. |
| 2 | United States of America | #2 | Northern America; Chainalysis 2026; official_value; flows #1, balances #1, P2P #20, cross-border #11. |
| 3 | Nigeria | #3 | Western Africa; Chainalysis 2026; official_value; flows #18, balances #18, P2P #1, cross-border #1. |
| 4 | Japan | #4 | Eastern Asia; Chainalysis 2026; official_value; flows #4, balances #7, P2P #10, cross-border #4. |
| 5 | Republic of Korea | #5 | Eastern Asia; Chainalysis 2026; official_value; flows #5, balances #2, P2P #12, cross-border #12. |
| 6 | India | #6 | Southern Asia; Chainalysis 2026; official_value; flows #2, balances #3, P2P #16, cross-border #16. |
| 7 | Ukraine | #7 | Eastern Europe; Chainalysis 2026; official_value; flows #8, balances #8, P2P #6, cross-border #6. |
| 8 | Thailand | #8 | South-eastern Asia; Chainalysis 2026; official_value; flows #25, balances #6, P2P #5, cross-border #8. |
| 9 | South Africa | #9 | Southern Africa; Chainalysis 2026; official_value; flows #33, balances #16, P2P #4, cross-border #3. |
| 10 | Canada | #10 | Northern America; Chainalysis 2026; official_value; flows #15, balances #9, P2P #7, cross-border #7. |
| 11 | Mexico | #11 | Central America; Chainalysis 2026; official_value; flows #21, balances #13, P2P #8, cross-border #5. |
| 12 | China | #12 | Eastern Asia; Chainalysis 2026; official_value; flows #29, balances #15, P2P #2, cross-border #14. |
| 13 | Germany | #13 | Western Europe; Chainalysis 2026; official_value; flows #12, balances #5, P2P #15, cross-border #15. |
| 14 | Indonesia | #14 | South-eastern Asia; Chainalysis 2026; official_value; flows #11, balances #12, P2P #13, cross-border #10. |
| 15 | Australia | #15 | Australia and New Zealand; Chainalysis 2026; official_value; flows #24, balances #10, P2P #11, cross-border #9. |
| 16 | Russian Federation | #16 | Eastern Europe; Chainalysis 2026; official_value; flows #9, balances #21, P2P #9, cross-border #19. |
| 17 | United Kingdom of Great Britain and Northern Ireland | #17 | Northern Europe; Chainalysis 2026; official_value; flows #6, balances #11, P2P #24, cross-border #24. |
| 18 | Viet Nam | #18 | South-eastern Asia; Chainalysis 2026; official_value; flows #7, balances #23, P2P #14, cross-border #17. |
| 19 | Philippines | #19 | South-eastern Asia; Chainalysis 2026; official_value; flows #14, balances #14, P2P #22, cross-border #21. |
| 20 | Türkiye | #20 | Western Asia; Chainalysis 2026; official_value; flows #16, balances #19, P2P #17, cross-border #20. |
Numeric rank source: Chainalysis 2026 Global Crypto Adoption Index. Region metadata: UN Statistics Division M49. The table contains no modeled or inferred rank positions.
Insights from the 2026 crypto adoption ranking
Key Insight
Brazil ranks #1 despite not leading any individual component. Its ranks of #3, #4, #3 and #2 produce a component spread of just 2 positions, showing unusually consistent placement across all four measures.
Notable Pattern
Fourteen of the 20 countries, or 70%, also appeared in the official 2025 Top 20. Six did not: South Africa, Canada, Mexico, China, Germany and Australia. Because the methodology changed, this is list overlap rather than a clean adoption-growth measure.
Regional/Source Concentration
Nine of the 20 countries, or 45%, belong to UN M49 Asian subregions. South-eastern Asia alone contributes four countries. All 20 numeric overall ranks come from one source, Chainalysis, preserving comparability across the main table.
Outlier
South Africa is #9 overall despite ranking #33 in total flows. Its strongest component is cross-border flows at #3, giving it a 30-position spread between its best and worst component ranks, the widest spread in the published Top 20.
What the 2026 ranking means for readers
The ranking is best used to compare the breadth of crypto activity across countries under Chainalysis' 2026 framework. It is not equivalent to a survey asking what percentage of residents own cryptocurrency.
Component ranks matter because similar overall positions can represent very different market structures. A country may be strong in centralized and service-based flows, personal-wallet transfers, international transfers, balances, or some combination of the four.
Independent datasets can legitimately produce different country orders. TRM Labs' Q1 2026 dataset measures attributed retail volume, while Chainalysis combines four normalized adoption dimensions over a 12-month period. A difference between the two rankings is therefore not automatically a data error.
The main interpretation risk is treating ordinal rank as an absolute adoption level. The difference between #1 and #2 is not necessarily the same size as the difference between #10 and #11, because the public Chainalysis table provides positions rather than the underlying normalized overall scores.
FAQ
Which country ranks first for crypto adoption in 2026?
Brazil ranks #1 in the Chainalysis 2026 Global Crypto Adoption Index. The United States ranks #2 and Nigeria ranks #3.
How many countries does the 2026 Chainalysis index rank?
Chainalysis states that 117 countries have sufficient data for the 2026 index. Its public article provides a reproducible overall and component-rank table for the Top 20, which is the verified coverage published on this page.
What period does the 2026 ranking measure?
The 2026 index covers July 1, 2025 through June 30, 2026. Chainalysis labels each 12-month period by the year in which it ends.
What does official_value mean in this table?
It means the overall or component rank is directly published by Chainalysis for its own 2026 index. StatRanker does not calculate or project these rank positions.
How is the Chainalysis index calculated?
Chainalysis combines service inflows, domestic P2P transfers, cross-border transfers and on-chain balances. The source describes purchasing-power adjustment, min-max normalization onto a 0-to-1 scale and a geometric mean across the four normalized components.
Why does Brazil rank first without leading a component?
Brazil ranks #3 in total flows, #4 in balances, #3 in P2P and #2 in cross-border flows. The geometric-mean framework rewards consistently strong performance across components rather than dominance in only one measure.
Why are only 20 countries shown rather than 100?
The public Chainalysis release provides a reproducible table for the Top 20 while reporting that 117 countries are ranked overall. StatRanker does not substitute positions from another provider or infer unpublished ranks.
Can the 2025 and 2026 rankings be compared directly?
Only descriptively. Fourteen countries appear in both published Top 20 lists, but Chainalysis materially changed the methodology for 2026, so rank movement should not be treated as a pure measure of year-over-year adoption growth.
Why does the TRM Labs ranking differ from Chainalysis?
TRM Labs ranks attributed retail crypto volume during Q1 2026, while Chainalysis measures four adoption dimensions over a 12-month period. They use different scopes, periods and methodologies and therefore should not be merged.
Which TRM Labs values does StatRanker use when its page conflicts with itself?
StatRanker uses TRM Labs' structured country table because it is the explicit row-level dataset. Narrative values that conflict with that table are disclosed but are not averaged into the comparison.
Sources
Chainalysis — 2026 Global Crypto Adoption Index
Role: numeric_source + methodology_source. Primary source for all 20 overall ranks, four component ranks, 117-country coverage, the measurement period and 2026 index methodology.
https://www.chainalysis.com/blog/2026-global-crypto-adoption-index/
Chainalysis — 2025 Global Crypto Adoption Index
Role: historical numeric_source. Used only for the 2025 versus 2026 Top-20 overlap calculation and descriptive rank comparison.
https://www.chainalysis.com/blog/2025-global-crypto-adoption-index/
TRM Labs — Q1 2026 Global Crypto Adoption Index
Role: independent validation_source + numeric_source for a separate metric. The structured Top 10 country table is used for the cross-source comparison; conflicting narrative values on the same page are not used.
https://www.trmlabs.com/resources/blog/q1-2026-global-crypto-adoption-index
United Nations Statistics Division — M49
Role: methodology_source for geographic metadata. Used only to assign standardized geographic subregions to ranking rows and power the region filter.
Chainalysis — 2026 Latin America Crypto Adoption
Role: context_source. Provides source-published context on Brazil and Latin America's 2026 crypto economy; it is not used to alter ranking values.
https://www.chainalysis.com/blog/latin-america-crypto-adoption-2026/
