

U.S. States by Medical Malpractice Payment Reports per 100,000 Residents
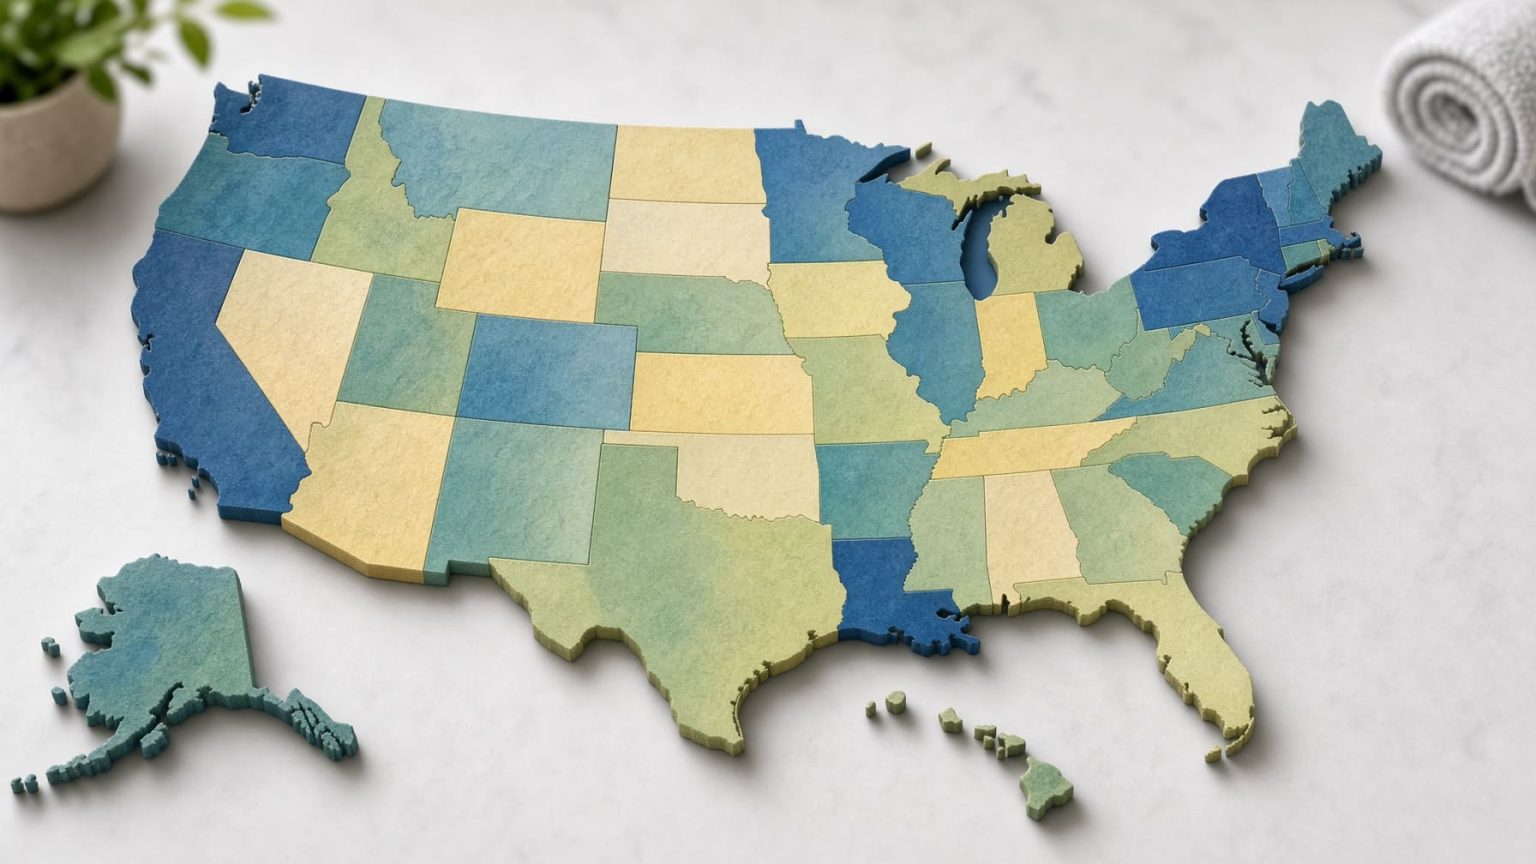
2025 Medical Malpractice Payment Report Rates Across U.S. States
New Mexico recorded the highest population-normalized rate of Medical Malpractice Payment Reports in 2025, with 8.42 reports per 100,000 residents. New Jersey ranked second at 6.72 and New York third at 6.34. The ranking combines Medical Malpractice Payment Report counts from the HRSA National Practitioner Data Bank with U.S. Census Bureau Vintage 2025 population estimates.
This is a 2026 snapshot based on complete 2025 annual data. The table is a compiled research dataset based on two controlling government data sources, with row-level source and method notes shown in the ranking table. All 50 ranking values are derived rates calculated directly from official 2025 inputs. No forecasts or modeled projections are used.
NPDB does not publish this population-normalized rate as an official indicator. The calculation is applied consistently to every state: 2025 Medical Malpractice Payment Reports divided by the July 1, 2025 resident population, multiplied by 100,000. An NPDB payment report is not the same as a lawsuit, verdict, finding of negligence or measure of health-care quality.
New Mexico, based on 179 reports and 2,125,498 residents.
North Dakota, based on 5 reports and 799,358 residents.
9,844 reports across a combined population of 341,091,212.
New Mexico's rate is nearly three times the combined 50-state rate.
Median calculated from the 50 population-normalized state rates.
All rates use official NPDB and Census inputs; 0 official forecasts and 0 modeled projections.
Medical Malpractice Payments by State: How to Read the Ranking
The ranking answers a specific question: how many reportable medical malpractice payments were recorded relative to each state's resident population in 2025? Using a common population denominator makes states of very different sizes more comparable than a ranking based only on raw report counts.
Under NPDB reporting rules, qualifying medical malpractice payments made for the benefit of a named or clearly identified health care practitioner must be reported when the federal reporting criteria are met. The NPDB data therefore describe reportable payments, not every allegation, claim, lawsuit or adverse medical outcome.
For Medical Malpractice Payment Reports, NPDB geographic attribution primarily uses the practitioner's work state. If that information is unavailable, other practitioner location fields may be used under NPDB methodology. The table should therefore be read as a geographic distribution of NPDB payment reports rather than a count of lawsuits filed in each state.
Population normalization does not adjust for the number of physicians, hospital admissions, procedures, insured patients or health-care encounters. Those factors can differ substantially between states and should be considered when interpreting the results.
Top 10 States by Medical Malpractice Payment Reports per 100,000 Residents
New Mexico ranks first, followed by New Jersey and New York. The Top 10 includes four Northeast states, four Southern states, one Western state and one Midwestern state.
Top 10 confirmed states · 2025 MMPRs per 100,000 residents
| Rank | Entity | Value | Source / Method Note |
|---|---|---|---|
| 1 | New Mexico | 8.42 | 179 NPDB reports; Census V2025 population 2,125,498; rate derived from official 2025 inputs. |
| 2 | New Jersey | 6.72 | 642 NPDB reports; Census V2025 population 9,548,215; rate derived from official 2025 inputs. |
| 3 | New York | 6.34 | 1,269 NPDB reports; Census V2025 population 20,002,427; rate derived from official 2025 inputs. |
| 4 | Louisiana | 5.44 | 251 NPDB reports; Census V2025 population 4,618,189; rate derived from official 2025 inputs. |
| 5 | Pennsylvania | 4.92 | 642 NPDB reports; Census V2025 population 13,059,432; rate derived from official 2025 inputs. |
| 6 | Florida | 4.84 | 1,135 NPDB reports; Census V2025 population 23,462,518; rate derived from official 2025 inputs. |
| 7 | Connecticut | 4.47 | 165 NPDB reports; Census V2025 population 3,688,496; rate derived from official 2025 inputs. |
| 8 | Kansas | 3.90 | 116 NPDB reports; Census V2025 population 2,977,220; rate derived from official 2025 inputs. |
| 9 | West Virginia | 3.68 | 65 NPDB reports; Census V2025 population 1,766,147; rate derived from official 2025 inputs. |
| 10 | Kentucky | 3.47 | 160 NPDB reports; Census V2025 population 4,606,864; rate derived from official 2025 inputs. |
Formula: 2025 NPDB Medical Malpractice Payment Reports ÷ July 1, 2025 Census resident population × 100,000. Ranking uses the unrounded derived rate.
Top 20 States by Population-Normalized Payment Report Rate
The chart uses the same values as the ranking table. Bar length is indexed to New Mexico, the highest-rate state.
Methodology
The metric is the number of 2025 NPDB Medical Malpractice Payment Reports per 100,000 residents. It is classified as a calculated_value: a deterministic calculation from official source values rather than an official NPDB rate, forecast or modeled projection.
Numerator
Number of 2025 Medical Malpractice Payment Reports from the HRSA National Practitioner Data Bank Data Analysis Tool.
Denominator
July 1, 2025 resident population from the U.S. Census Bureau Vintage 2025 state population estimates.
Formula
State rate = 2025 MMPR count ÷ July 1, 2025 resident population × 100,000.
Ranking direction
Descending. Higher derived rates rank higher. Full-precision values determine rank before display rounding.
Source hierarchy
HRSA NPDB controls the report count. U.S. Census Bureau Vintage 2025 controls the population denominator. Secondary sources do not replace either input.
Coverage
All 50 U.S. states. Washington, D.C., Puerto Rico and other U.S. territories are excluded to keep the geographic level consistent.
NPDB query settings: report type = Medical Malpractice Payment Report; payment year = 2025; geography = state; practitioner categories = all; measure = number of reports. The state counts used in the ranking come from the NPDB Data Analysis Tool.
Year logic: this is a 2026 snapshot of the 2025 annual series. NPDB notes that reports associated with late-year payments can be submitted during the following reporting period, so the subsequent first-quarter reporting window matters when treating an annual series as complete.
Assumptions: NPDB state attribution is used as published. Resident population is the common denominator for every state. Each MMPR contributes one report regardless of payment amount. No adjustment is made for physician supply, hospital utilization, patient age, insurance coverage, procedures performed, malpractice premium levels or claim severity.
Missing values and conflicts: a state would be excluded if either its 2025 NPDB report count or Vintage 2025 population estimate were unavailable. No state required exclusion. Conflicting secondary figures are not averaged with the controlling government sources.
Rounding: rates are shown to two decimal places. The combined 50-state rate is calculated from total reports divided by total population rather than by averaging individual state rates.
Value-status framework: official_value means a value published directly by the controlling source; official_forecast means a forecast published by an official source; modeled_projection means a forward-looking modeled estimate; calculated_value means a deterministic calculation from published source values using a stated formula. Every ranking value on this page is a calculated_value.
What this metric does not measure: lawsuit filings, dismissed claims, verdicts, proven negligence, total dollars paid, average settlement size, malpractice insurance premiums, physician density, patient safety or overall health-care quality.
All 50 States Ranked by Medical Malpractice Payment Report Rate
Search by state, filter by Census region or data status, change sort order, or limit the view to the original Top 10 or Top 20. All rows remain visible when JavaScript is unavailable.
50-state ranking · 2025 Medical Malpractice Payment Reports per 100,000 residents
| Rank | Entity | Value | Source / Method Note |
|---|---|---|---|
| 1 | New Mexico | 8.42 | 179 NPDB reports; Census V2025 population 2,125,498; rate derived from official inputs. |
| 2 | New Jersey | 6.72 | 642 NPDB reports; Census V2025 population 9,548,215; rate derived from official inputs. |
| 3 | New York | 6.34 | 1,269 NPDB reports; Census V2025 population 20,002,427; rate derived from official inputs. |
| 4 | Louisiana | 5.44 | 251 NPDB reports; Census V2025 population 4,618,189; rate derived from official inputs. |
| 5 | Pennsylvania | 4.92 | 642 NPDB reports; Census V2025 population 13,059,432; rate derived from official inputs. |
| 6 | Florida | 4.84 | 1,135 NPDB reports; Census V2025 population 23,462,518; rate derived from official inputs. |
| 7 | Connecticut | 4.47 | 165 NPDB reports; Census V2025 population 3,688,496; rate derived from official inputs. |
| 8 | Kansas | 3.90 | 116 NPDB reports; Census V2025 population 2,977,220; rate derived from official inputs. |
| 9 | West Virginia | 3.68 | 65 NPDB reports; Census V2025 population 1,766,147; rate derived from official inputs. |
| 10 | Kentucky | 3.47 | 160 NPDB reports; Census V2025 population 4,606,864; rate derived from official inputs. |
| 11 | Massachusetts | 3.15 | 225 NPDB reports; Census V2025 population 7,154,084; rate derived from official inputs. |
| 12 | Rhode Island | 2.96 | 33 NPDB reports; Census V2025 population 1,114,521; rate derived from official inputs. |
| 13 | Michigan | 2.95 | 299 NPDB reports; Census V2025 population 10,127,884; rate derived from official inputs. |
| 14 | Illinois | 2.89 | 367 NPDB reports; Census V2025 population 12,719,141; rate derived from official inputs. |
| 15 | Maryland | 2.84 | 178 NPDB reports; Census V2025 population 6,265,347; rate derived from official inputs. |
| 16 | Georgia | 2.79 | 315 NPDB reports; Census V2025 population 11,302,748; rate derived from official inputs. |
| 17 | Oklahoma | 2.76 | 114 NPDB reports; Census V2025 population 4,123,288; rate derived from official inputs. |
| 18 | Montana | 2.71 | 31 NPDB reports; Census V2025 population 1,144,694; rate derived from official inputs. |
| 19 | Vermont | 2.64 | 17 NPDB reports; Census V2025 population 644,663; rate derived from official inputs. |
| 20 | Missouri | 2.55 | 160 NPDB reports; Census V2025 population 6,270,541; rate derived from official inputs. |
| 21 | Oregon | 2.53 | 108 NPDB reports; Census V2025 population 4,273,586; rate derived from official inputs. |
| 22 | California | 2.46 | 967 NPDB reports; Census V2025 population 39,355,309; rate derived from official inputs. |
| 23 | South Carolina | 2.44 | 136 NPDB reports; Census V2025 population 5,570,274; rate derived from official inputs. |
| 24 | Nevada | 2.41 | 79 NPDB reports; Census V2025 population 3,282,188; rate derived from official inputs. |
| 25 | Indiana | 2.38 | 166 NPDB reports; Census V2025 population 6,973,333; rate derived from official inputs. |
| 26 | New Hampshire | 2.26 | 32 NPDB reports; Census V2025 population 1,415,342; rate derived from official inputs. |
| 27 | Hawaii | 2.23 | 32 NPDB reports; Census V2025 population 1,432,820; rate derived from official inputs. |
| 28 | Delaware | 2.17 | 23 NPDB reports; Census V2025 population 1,059,952; rate derived from official inputs. |
| 29 | Alabama | 2.10 | 109 NPDB reports; Census V2025 population 5,193,088; rate derived from official inputs. |
| 30 | Arizona | 1.97 | 150 NPDB reports; Census V2025 population 7,623,818; rate derived from official inputs. |
| 31 | Washington | 1.94 | 155 NPDB reports; Census V2025 population 8,001,020; rate derived from official inputs. |
| 32 | Utah | 1.86 | 66 NPDB reports; Census V2025 population 3,538,904; rate derived from official inputs. |
| 33 | Mississippi | 1.83 | 54 NPDB reports; Census V2025 population 2,954,160; rate derived from official inputs. |
| 34 | Virginia | 1.69 | 150 NPDB reports; Census V2025 population 8,880,107; rate derived from official inputs. |
| 35 | Alaska | 1.63 | 12 NPDB reports; Census V2025 population 737,270; rate derived from official inputs. |
| 36 | Colorado | 1.61 | 97 NPDB reports; Census V2025 population 6,012,561; rate derived from official inputs. |
| 37 | Idaho | 1.58 | 32 NPDB reports; Census V2025 population 2,029,733; rate derived from official inputs. |
| 38 | Ohio | 1.55 | 184 NPDB reports; Census V2025 population 11,900,510; rate derived from official inputs. |
| 39 | Wyoming | 1.53 | 9 NPDB reports; Census V2025 population 588,753; rate derived from official inputs. |
| 40 | Arkansas | 1.48 | 46 NPDB reports; Census V2025 population 3,114,791; rate derived from official inputs. |
| 41 | Iowa | 1.39 | 45 NPDB reports; Census V2025 population 3,238,387; rate derived from official inputs. |
| 42 | Tennessee | 1.37 | 100 NPDB reports; Census V2025 population 7,315,076; rate derived from official inputs. |
| 43 | Texas | 1.37 | 433 NPDB reports; Census V2025 population 31,709,821; rate derived from official inputs. |
| 44 | Nebraska | 1.34 | 27 NPDB reports; Census V2025 population 2,018,006; rate derived from official inputs. |
| 45 | Wisconsin | 1.27 | 76 NPDB reports; Census V2025 population 5,972,787; rate derived from official inputs. |
| 46 | South Dakota | 1.18 | 11 NPDB reports; Census V2025 population 935,094; rate derived from official inputs. |
| 47 | North Carolina | 1.05 | 118 NPDB reports; Census V2025 population 11,197,968; rate derived from official inputs. |
| 48 | Maine | 0.99 | 14 NPDB reports; Census V2025 population 1,414,874; rate derived from official inputs. |
| 49 | Minnesota | 0.77 | 45 NPDB reports; Census V2025 population 5,830,405; rate derived from official inputs. |
| 50 | North Dakota | 0.63 | 5 NPDB reports; Census V2025 population 799,358; rate derived from official inputs. |
Values are derived from official 2025 NPDB report counts and Census Vintage 2025 population estimates. The population-normalized rate is not published by NPDB as a standalone state indicator.
What Stands Out in the 50-State Data
Key Insight
New Mexico leads at 8.42 reports per 100,000 residents, about 25% above second-ranked New Jersey and almost three times the combined 50-state rate.
Notable Pattern
The Northeast is strongly represented near the top. New Jersey, New York, Pennsylvania and Connecticut all rank in the Top 10.
Regional Concentration
The Top 10 contains four Northeast states, four Southern states, one Western state and one Midwestern state. Seven of the nine Northeast states appear in the Top 20.
Population Effect
California has 967 reports, one of the highest raw totals, but ranks 22nd after population normalization because its resident population exceeds 39 million.
What the Ranking Does — and Does Not — Tell Us
A state near the top recorded more NPDB Medical Malpractice Payment Reports relative to its resident population in 2025. That does not necessarily mean the state had more negligent care, more malpractice lawsuits or poorer medical outcomes.
An MMPR is generated by a specific federal reporting event. Some allegations never result in a payment, some claims are resolved without a reportable practitioner payment, and a payment report does not establish that negligence occurred.
Legal rules, insurance arrangements, patient compensation mechanisms, practitioner mix, claim-resolution practices and reporting patterns can influence state totals. Population normalization improves comparability but does not remove those structural differences.
For legal-market or insurance analysis, the rate is most informative when used with other measures such as total malpractice payments, payment size, physician supply, malpractice premiums, tort rules and litigation volume.
Download the U.S. States by Medical Malpractice Payment Reports per 100,000 Residents dataset
U.S. States by Medical Malpractice Payment Reports per 100,000 Residents
50 ranked entries · Excel + CSV + methodology + sources + chart · Snapshot: 2025 NPDB / Census state comparison · Version 1.0
The archive includes machine-readable data, methodology and source documentation. Quick human verification is required before the ZIP is delivered. Full Data Pack downloads require a free account. Free accounts can download 1 different Data Pack every 30 days; re-downloading the same pack does not use another slot. Annual Data Access provides unlimited manual downloads while annual access is active.
Download Excel + CSV Data PackFAQ
Which state has the highest medical malpractice payment report rate?
New Mexico ranks first at 8.42 NPDB Medical Malpractice Payment Reports per 100,000 residents in 2025.
Is this rate published directly by the National Practitioner Data Bank?
No. NPDB supplies the official state report counts and the Census Bureau supplies the official population estimates. The rate is a derived value calculated from those two official inputs using the same formula for every state.
What does derived value mean in this ranking?
A derived value is a deterministic calculation from published source values. It is not an estimate of an unknown quantity and it is not a forecast. Here, the only calculation is the official NPDB report count divided by the official Census population and multiplied by 100,000.
Why is this described as a 2026 snapshot?
The ranking uses the complete 2025 annual comparison period available in the 2026 NPDB data cycle. Reports associated with payments late in the year can enter the database during the following reporting period, so the subsequent first-quarter reporting window matters when treating the annual series as complete.
Does one NPDB payment report equal one malpractice lawsuit?
No. A Medical Malpractice Payment Report records a qualifying payment made for the benefit of a health care practitioner. It is not a count of lawsuits, allegations or adverse medical events.
Does an NPDB payment report prove medical negligence?
No. A reported payment should not be interpreted as a judicial finding or admission that malpractice occurred.
Why use population instead of raw payment-report counts?
Raw totals are strongly affected by state size. A population denominator provides one consistent way to compare payment-report frequency across states with very different populations.
Does the ranking account for the number of doctors in each state?
No. The denominator is resident population, not physician supply. A physician-based rate would answer a different question and could produce a different ranking.
Are payment amounts included in the ranking?
No. Each report contributes one count regardless of payment size. The ranking measures report frequency per resident, not dollars paid.
Sources
HRSA National Practitioner Data Bank — Data Analysis Tool
Controlling numeric source for the 2025 Medical Malpractice Payment Report counts used in the ranking, as well as relevant geographic and time-period conventions.
https://www.npdb.hrsa.gov/analysistool/HRSA National Practitioner Data Bank — Public Use Data File
Cited for NPDB public-data scope and release context. It is not used as the controlling numeric source for the state counts in this ranking. NPDB notes that Data Analysis Tool results can differ from analyses independently reconstructed from the Public Use Data File.
https://www.npdb.hrsa.gov/resources/publicData.jspHRSA NPDB Guidebook — Medical Malpractice Payment Reports
Definition and reporting guidance used to distinguish an NPDB payment report from a lawsuit, verdict or finding of malpractice.
https://www.npdb.hrsa.gov/guidebook/EMMPR.jspU.S. Census Bureau — Vintage 2025 Population Estimates
Controlling denominator source for July 1, 2025 resident population estimates used in every state calculation.
https://www.census.gov/newsroom/press-kits/2026/national-state-population-estimates.htmlU.S. Census Bureau QuickFacts
State-level reference for checking the Vintage 2025 population estimates used in the denominator.
https://www.census.gov/quickfacts/geo/chart/US/PST045225