

Alcohol Consumption in the WHO European Region 2026: 18 Country Forecasts
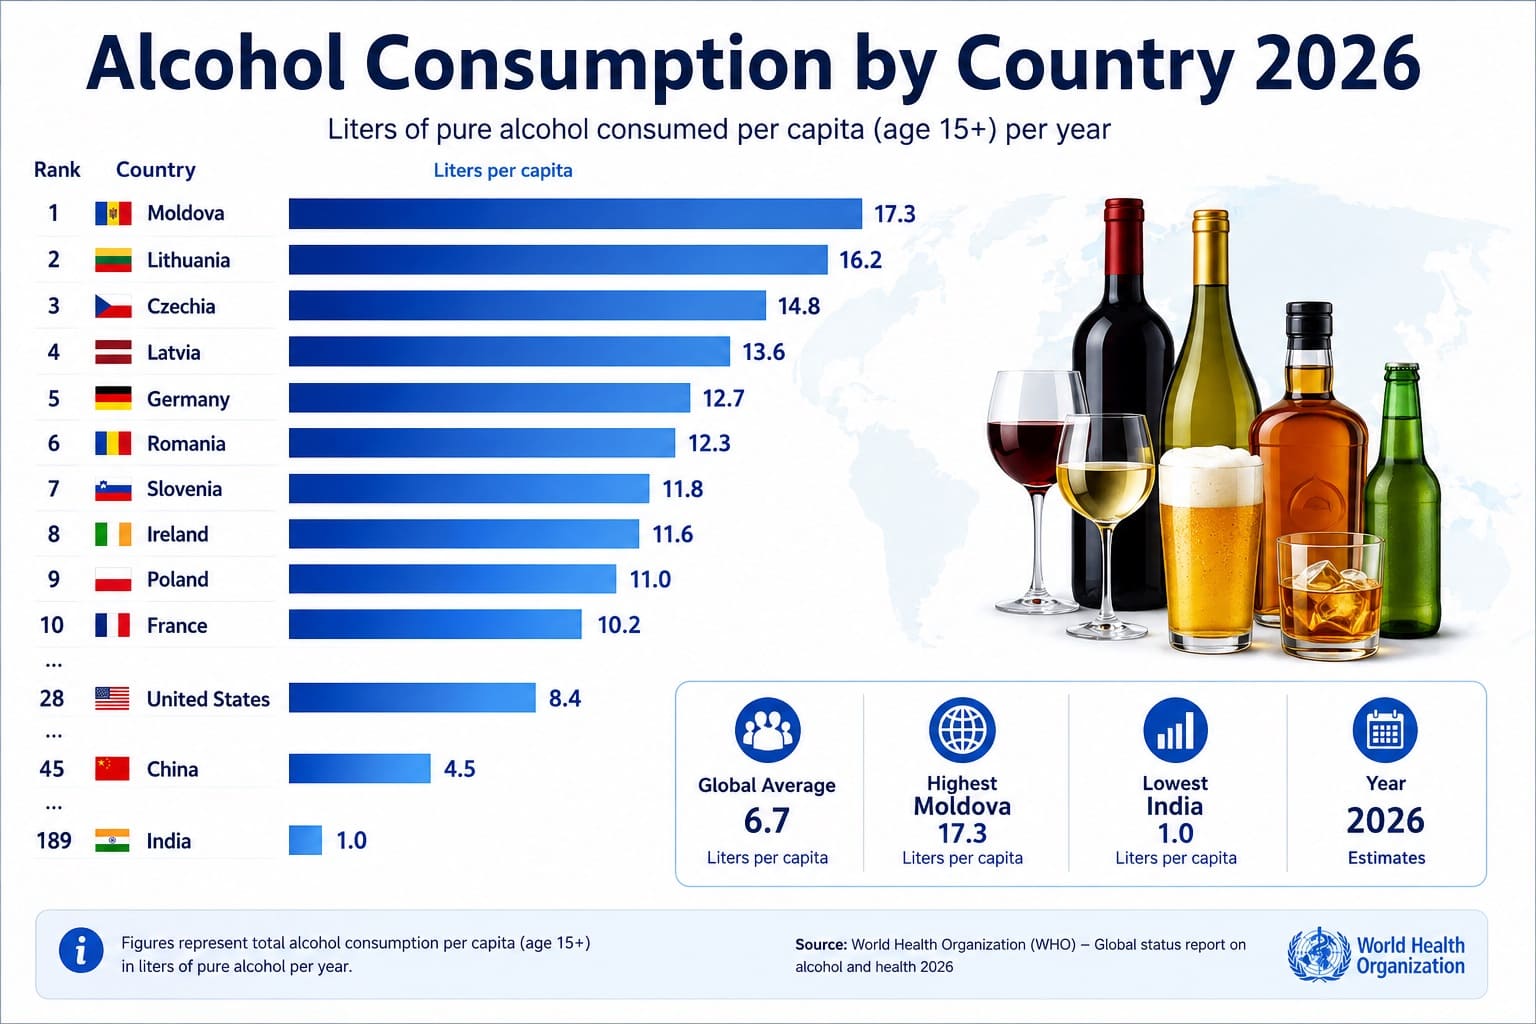
WHO Alcohol-Consumption Forecasts for 18 Countries
Romania has the highest WHO 2026 forecast among the 18 countries in this comparison, at 17.02 liters of pure alcohol per person aged 15 or older. Georgia follows at 15.02 liters, while Latvia ranks third at 13.29 liters.
The indicator measures total recorded and estimated unrecorded alcohol consumption. WHO expresses the result as liters of pure alcohol per person aged 15+ per year and includes tourist-consumption adjustments within its methodology.
The ranking uses one WHO Global Health Observatory indicator series. All 18 values are official WHO forecasts for 2026; the table contains no observed 2026 values and no locally modeled projections.
Continue exploring
More StatRanker rankings on health systems, outcomes and medical capacity.
Top 100 Countries by Adult Obesity Rate: 2026 Snapshot Based on Latest WHO/NCD-RisC Data
Open rankingTop 100 Countries by Cancer Incidence Rate, 2026 Snapshot
Open rankingTop 100 Countries by Adult Smoking Prevalence (%), 2025
Open rankingCoverage is limited to 18 countries with a published 2026 estimate and 95% uncertainty interval in the WHO series. This is not a complete ranking of the WHO European Region or the world, and omitted countries may change the wider order.
Romania has the highest WHO 2026 forecast in this 18-country comparison, at 17.02 liters of pure alcohol per person aged 15+, followed by Georgia at 15.02 liters and Latvia at 13.29 liters.
Romania ranks first in this 18-country comparison.
Switzerland ranks eighteenth among the included rows.
18 WHO forecasts with published 95% uncertainty intervals.
Calculated from the 18 unrounded 2026 forecast values.
18 official forecasts, 0 observed values and 0 local projections.
What the WHO Alcohol-Consumption Indicator Measures
Total alcohol per capita consumption estimates the volume of pure alcohol consumed during a year for each person aged 15 or older. The denominator includes everyone in that age group, including people who do not drink.
Recorded consumption is based on alcohol captured by official production, import, export, sales or taxation systems. Unrecorded consumption estimates alcohol outside those systems, including informal production and other untaxed or uncontrolled sources. WHO combines both components in the total indicator.
Converting beer, wine, spirits and other beverages into liters of pure alcohol makes beverages with different alcohol concentrations comparable. The measure represents alcohol content rather than the physical volume of beverages purchased or consumed.
The published WHO uncertainty interval is shown for every country. Because many intervals overlap, small differences between neighboring forecasts should not automatically be interpreted as meaningful differences.
Highest WHO Alcohol-Consumption Forecasts
Romania, Georgia and Latvia are the only countries in this comparison with forecasts above 13 liters. Germany and Austria are nearly tied, while the countries ranked sixth through tenth fall between 11.28 and 11.77 liters.
Top 10 countries in this 18-country WHO comparison
| Rank | Country | Forecast | Source / interval |
|---|---|---|---|
| 1 | Romania | 17.02 L | WHO GHO official forecast, 2026; 95% interval: 12.03–22.01 L. |
| 2 | Georgia | 15.02 L | WHO GHO official forecast, 2026; 95% interval: 10.25–19.79 L. |
| 3 | Latvia | 13.29 L | WHO GHO official forecast, 2026; 95% interval: 9.23–17.36 L. |
| 4 | Germany | 11.97 L | WHO GHO official forecast, 2026; 95% interval: 8.75–15.19 L. |
| 5 | Austria | 11.97 L | WHO GHO official forecast, 2026; 95% interval: 8.63–15.30 L. |
| 6 | Lithuania | 11.77 L | WHO GHO official forecast, 2026; 95% interval: 8.11–15.43 L. |
| 7 | Republic of Moldova | 11.50 L | WHO GHO official forecast, 2026; 95% interval: 7.35–15.66 L. |
| 8 | Ireland | 11.47 L | WHO GHO official forecast, 2026; 95% interval: 7.91–15.03 L. |
| 9 | Luxembourg | 11.31 L | WHO GHO official forecast, 2026; 95% interval: 8.13–14.50 L. |
| 10 | Estonia | 11.28 L | WHO GHO official forecast, 2026; 95% interval: 6.72–15.85 L. |
Values are rounded to two decimal places after ranking. The order is based on the unrounded WHO forecast values and applies only to the 18 countries shown on this page.
2026 WHO Forecast Comparison
Bar length represents the WHO 2026 forecast for each country. The chart does not encode the uncertainty intervals, which are reported in the ranking tables.
Methodology
The numeric ranking uses one WHO Global Health Observatory indicator series: SA_0000001818, covering projections for total recorded and unrecorded alcohol consumption among people aged 15 and older. The unit is liters of pure alcohol per person per year.
Selection rule
The table includes 18 countries with a published 2026 estimate, lower and upper uncertainty bounds, country identity, year and matching indicator fields in the WHO series.
Coverage limit
The table covers 18 countries rather than the full WHO European Region. Countries outside this page are not assigned ranks.
Target year and status
The target year is 2026. Every row is an official WHO forecast; there are no observed 2026 values or locally produced projections.
Ranking rule
Countries are sorted by the unrounded 2026 forecast in descending order. Higher values receive higher positions.
Uncertainty intervals
Each row retains the published 95% interval so readers can compare the forecast value with the range reported by WHO.
Exclusions
Recorded-sales-only figures, alcohol deaths, disease burden, drinking prevalence, drink-driving measures and incomplete forecast records were excluded.
Conflict handling
Conflicting records were not averaged. The applicable 2026 record from the WHO projection series was retained.
Rounding
Values are displayed to two decimals. Rankings, comparisons and the median use the unrounded forecast values.
WHO states that projections for 2026–2030 were based on autoregressive integrated moving average regression analyses. Country-specific coefficients are not reproduced here, and no independent formula, trend rate or growth assumption has been added.
Source and access method
The numeric values come from the WHO Global Health Observatory projection series. WHO’s indicator pages provide the definition, unit and forecasting method. The archived datasets listed under Sources preserve access to the same WHO-derived records and are not separate statistical sources.
WHO identifies the earlier GHO OData interface as a legacy service scheduled for retirement near the end of 2025. It is listed as a historical access route rather than the current primary WHO data portal.
What the metric does not measure
- It does not measure consumption per drinker because the denominator includes everyone aged 15+.
- It does not measure the number of drinks, beverage volume or retail alcohol sales alone.
- It does not directly measure alcohol-related mortality, disease burden or road injuries.
- It does not show drinking frequency, abstention or heavy episodic drinking.
- It does not provide complete global or WHO European Region coverage on this page.
Alcohol Consumption Forecasts by Country
Showing 18 countries.
WHO 2026 forecasts in liters of pure alcohol per person aged 15+
| Rank | Country | Forecast | Source / interval |
|---|---|---|---|
| 1 | Romania | 17.02 L | Official forecast WHO GHO, 2026; 95% interval: 12.03–22.01 L. |
| 2 | Georgia | 15.02 L | Official forecast WHO GHO, 2026; 95% interval: 10.25–19.79 L. |
| 3 | Latvia | 13.29 L | Official forecast WHO GHO, 2026; 95% interval: 9.23–17.36 L. |
| 4 | Germany | 11.97 L | Official forecast WHO GHO, 2026; 95% interval: 8.75–15.19 L. |
| 5 | Austria | 11.97 L | Official forecast WHO GHO, 2026; 95% interval: 8.63–15.30 L. |
| 6 | Lithuania | 11.77 L | Official forecast WHO GHO, 2026; 95% interval: 8.11–15.43 L. |
| 7 | Republic of Moldova | 11.50 L | Official forecast WHO GHO, 2026; 95% interval: 7.35–15.66 L. |
| 8 | Ireland | 11.47 L | Official forecast WHO GHO, 2026; 95% interval: 7.91–15.03 L. |
| 9 | Luxembourg | 11.31 L | Official forecast WHO GHO, 2026; 95% interval: 8.13–14.50 L. |
| 10 | Estonia | 11.28 L | Official forecast WHO GHO, 2026; 95% interval: 6.72–15.85 L. |
| 11 | Slovenia | 11.28 L | Official forecast WHO GHO, 2026; 95% interval: 7.75–14.81 L. |
| 12 | France | 11.17 L | Official forecast WHO GHO, 2026; 95% interval: 7.50–14.84 L. |
| 13 | Slovakia | 11.16 L | Official forecast WHO GHO, 2026; 95% interval: 7.61–14.71 L. |
| 14 | Spain | 11.03 L | Official forecast WHO GHO, 2026; 95% interval: 7.24–14.81 L. |
| 15 | United Kingdom | 10.73 L | Official forecast WHO GHO, 2026; 95% interval: 7.54–13.92 L. |
| 16 | Hungary | 10.60 L | Official forecast WHO GHO, 2026; 95% interval: 6.96–14.24 L. |
| 17 | Portugal | 10.48 L | Official forecast WHO GHO, 2026; 95% interval: 7.18–13.77 L. |
| 18 | Switzerland | 10.43 L | Official forecast WHO GHO, 2026; 95% interval: 7.31–13.56 L. |
All rows use the same WHO indicator, target year, population scope and unit. The ranking applies only to the 18 countries shown on this page.
Key Findings
Key Insight
Romania leads the included countries at 17.02 liters, approximately 2.00 liters above Georgia.
Notable Pattern
Only Romania, Georgia and Latvia exceed 13 liters. The remaining 15 included forecasts fall between 10.43 and 11.97 liters.
Coverage Limit
All 18 countries belong to the WHO European Region, but this page does not cover every country in the region.
Closest Estimates
Germany and Austria differ by less than 0.01 liters in the unrounded data. Estonia and Slovenia are similarly close.
How to Interpret the Ranking
A forecast of 17 liters does not mean that each person drinks 17 liters of beverages. It represents the pure-alcohol content of all estimated consumption divided across the entire population aged 15 or older.
The figures are not consumption-per-drinker estimates. Because people who abstain are included in the denominator, average consumption among drinkers may be higher than the population-level value.
The difference between an official forecast and an observed value is important. WHO published these 2026 figures as projections; they should not be described as measurements collected during 2026.
Close ranks should be interpreted together with uncertainty intervals. The published intervals overlap for many countries, so the visible order may be more precise than the underlying estimates.
The table should not be used to identify the highest-consuming country in Europe or the world because countries outside this page are not ranked.
Alcohol volume is not a complete measure of alcohol-related harm. Drinking patterns, heavy episodic drinking, health conditions, road safety and access to treatment require separate indicators.
Frequently Asked Questions
Which country has the highest forecast here?
Romania ranks first among the 18 countries shown, with a WHO 2026 forecast of 17.02 liters of pure alcohol per person aged 15+.
Are these observed alcohol-consumption values for 2026?
No. They are WHO projections for 2026, not observed measurements collected during 2026.
Is this a complete European or worldwide ranking?
No. The table covers 18 countries from the WHO European Region. Countries outside this page are not assigned positions.
What does recorded and unrecorded consumption mean?
Recorded consumption appears in official production, trade, sales or taxation systems. Unrecorded consumption estimates alcohol outside those systems.
Why is consumption expressed in liters of pure alcohol?
Pure-alcohol conversion makes beer, wine, spirits and other beverages comparable despite their different alcohol concentrations.
Does the indicator measure consumption per drinker?
No. The denominator includes the entire population aged 15 or older, including people who do not drink.
How did WHO produce the 2026 projections?
WHO states that projections for 2026–2030 were based on autoregressive integrated moving average regression analyses.
Why do the uncertainty intervals matter?
They show the uncertainty around each forecast. Overlapping intervals mean neighboring ranks may not represent clearly distinct consumption levels.
Sources
WHO Global Health Observatory
Current WHO portal for global, regional and country health statistics.
WHO Projection Indicator Details
Primary definition, unit and WHO statement that projections for 2026–2030 use ARIMA regression analyses.
WHO Total Alcohol-Consumption Definition
Supporting definition of recorded and unrecorded consumption, the 15+ denominator and tourist-consumption adjustment.
Legacy WHO GHO OData Endpoint
Historical machine-readable endpoint for indicator SA_0000001818. WHO announced the retirement of older GHO interfaces, so this link is provided as a historical access route.
WHO Legacy Interface Notice
Official WHO notice explaining the retirement of older GHO interfaces and the transition toward the newer WHO data environment.
Archived WHO-Derived European Dataset
Archived copy of WHO-derived European records and published uncertainty intervals. It is not an independent statistical source.
https://huggingface.co/datasets/electricsheepeurope/europe-who-alcohol-0000001818
Archived WHO-Derived Asian Dataset
Archived copy containing the WHO-derived Georgia record. It is not an independent statistical source.
https://huggingface.co/datasets/electricsheepasia/asia-who-alcohol-0000001818
Related rankings
More StatRanker rankings on health systems, outcomes and medical capacity.
HIV ART Coverage by Country: 2026 Snapshot Based on UNAIDS 2024 Estimates
Open rankingChildhood Illnesses on the Rise: Vaccination Gaps and Consequences
Open rankingInfectious Disease Outbreaks: Are We Prepared for the Next Pandemic?
Open rankingCardiovascular Disease: Still the Leading Cause of Death?
Open ranking
StatRanker (Website)
administrator
