

Countries by Stock Market Capitalization as a Share of GDP, 2026 Snapshot
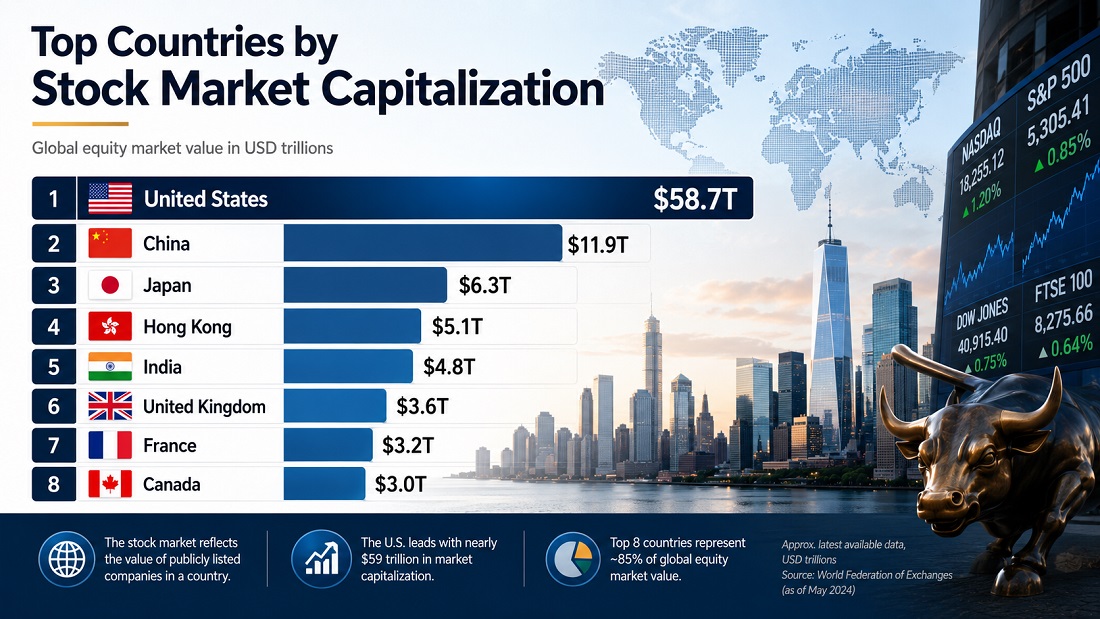
Countries by Stock Market Capitalization as a Share of GDP
This 2026 snapshot ranks countries and economies by market capitalization of listed domestic companies as a percentage of GDP. The metric compares the end-year market value of listed domestic equities with the size of the domestic economy. Higher values rank higher.
The ranking uses the World Bank World Development Indicators series CM.MKT.LCAP.GD.ZS, sourced from the World Federation of Exchanges database. It is a single-source official_value table based on the latest available 2024 observations shown in the World Bank indicator page.
Unit: percent of GDP. Direction: higher is larger. Coverage: 70 numeric 2024 entries in this table. Status mix: 70 official_value rows, 0 official_forecast rows and 0 modeled_projection rows.
Continue exploring
More StatRanker pages connected by topic, category or ranking theme.
1,118.2% of GDP in the 2024 World Bank WDI / WFE indicator series. This is the largest official_value entry and reflects a very large listed-equity market relative to local GDP.
2.2% of GDP among the numeric 2024 entries used in this table. Qatar is listed separately in the upper part of the ranking at 77.7% of GDP.
The table includes only entries with a numeric 2024 value in the selected World Bank WDI indicator snapshot. No unavailable economy is added to force a Top 100 label.
Market capitalization of listed domestic companies as a percentage of GDP. All rows are official_value; no forecasts or modeled projections are included.
Overview
The upper part of the ranking is shaped by financial centers, large equity markets and economies where listed company values are high relative to domestic output. Hong Kong SAR is a clear outlier, while South Africa, Saudi Arabia, the United States, Switzerland and the United Arab Emirates all exceed 190% of GDP.
The 2024 table places Qatar in the upper group at 77.7% of GDP and Kazakhstan in the middle of the ranking at 47.7% of GDP. Both rows are treated as regular 2024 World Bank WDI / WFE observations in this table.
Lower ratios do not automatically mean weak companies or weak economies. They can reflect bank-based finance, limited free float, fewer listed firms, state ownership, market structure, valuation cycles or the fact that large companies list outside the domestic exchange.
Top 10 countries and economies by stock market capitalization to GDP
Top 10 numeric 2024 World Bank WDI entries
| Rank | Entity | Value | Source / Method Note |
|---|---|---|---|
| 1 | Hong Kong SAR | 1,118.2% | official_value World Bank WDI / WFE; 2024; market capitalization of listed domestic companies as % of GDP. |
| 2 | South Africa | 245.7% | official_value World Bank WDI / WFE; 2024; market capitalization of listed domestic companies as % of GDP. |
| 3 | Saudi Arabia | 220.0% | official_value World Bank WDI / WFE; 2024; market capitalization of listed domestic companies as % of GDP. |
| 4 | United States | 216.3% | official_value World Bank WDI / WFE; 2024; market capitalization of listed domestic companies as % of GDP. |
| 5 | Switzerland | 210.5% | official_value World Bank WDI / WFE; 2024; market capitalization of listed domestic companies as % of GDP. |
| 6 | United Arab Emirates | 190.9% | official_value World Bank WDI / WFE; 2024; market capitalization of listed domestic companies as % of GDP. |
| 7 | Japan | 156.7% | official_value World Bank WDI / WFE; 2024; market capitalization of listed domestic companies as % of GDP. |
| 8 | Canada | 150.4% | official_value World Bank WDI / WFE; 2024; market capitalization of listed domestic companies as % of GDP. |
| 9 | India | 131.2% | official_value World Bank WDI / WFE; 2024; market capitalization of listed domestic companies as % of GDP. |
| 10 | Singapore | 116.5% | official_value World Bank WDI / WFE; 2024; market capitalization of listed domestic companies as % of GDP. |
Rank is calculated from the numeric value in descending order. Values are shown to one decimal where the public World Bank indicator page displays one decimal.
Chart: Top 20 numeric 2024 entries
The chart compares the highest 20 official 2024 values in the table. Hong Kong SAR is a clear outlier, so the remaining bars appear much shorter on the same scale.
Methodology
The metric is market capitalization of listed domestic companies divided by GDP and expressed as a percentage. Market capitalization is the share price multiplied by the number of listed shares outstanding at year end. The ranking direction is descending: a larger market-capitalization-to-GDP ratio receives a higher rank.
Source hierarchy
The table uses the World Bank WDI indicator CM.MKT.LCAP.GD.ZS, whose underlying source is the World Federation of Exchanges database. No commercial ranking is used to set the order.
Coverage rule
The page keeps one source year and includes only entries with a numeric 2024 value shown in the selected World Bank indicator snapshot.
Status rule
Every row is official_value. There are no official_forecast or modeled_projection rows, so no base-year growth formula or projection assumption is applied.
Limits
The indicator does not measure household wealth, stock-market returns, investability, liquidity, free float, investor protection, market access or the quality of listed companies.
Rounding follows the public source display. Ties or near-ties are kept as separate rows and sorted by the displayed numeric value. Regional labels are used only for filtering and interpretation; the rank itself is calculated only from the value.
Main ranking table: 70 numeric 2024 entries
Use the controls to search, filter and reorder the table.
Countries and economies by stock market capitalization as % of GDP, 2024
| Rank | Entity | Value | Source / Method Note |
|---|---|---|---|
| 1 | Hong Kong SAR | 1,118.2% | official_value Asia-Pacific; World Bank WDI / WFE; 2024; end-year listed domestic companies market capitalization as % of GDP. |
| 2 | South Africa | 245.7% | official_value Sub-Saharan Africa; World Bank WDI / WFE; 2024; end-year listed domestic companies market capitalization as % of GDP. |
| 3 | Saudi Arabia | 220.0% | official_value Middle East & North Africa; World Bank WDI / WFE; 2024; end-year listed domestic companies market capitalization as % of GDP. |
| 4 | United States | 216.3% | official_value Americas; World Bank WDI / WFE; 2024; end-year listed domestic companies market capitalization as % of GDP. |
| 5 | Switzerland | 210.5% | official_value Europe & Central Asia; World Bank WDI / WFE; 2024; end-year listed domestic companies market capitalization as % of GDP. |
| 6 | United Arab Emirates | 190.9% | official_value Middle East & North Africa; World Bank WDI / WFE; 2024; end-year listed domestic companies market capitalization as % of GDP. |
| 7 | Japan | 156.7% | official_value Asia-Pacific; World Bank WDI / WFE; 2024; end-year listed domestic companies market capitalization as % of GDP. |
| 8 | Canada | 150.4% | official_value Americas; World Bank WDI / WFE; 2024; end-year listed domestic companies market capitalization as % of GDP. |
| 9 | India | 131.2% | official_value Asia-Pacific; World Bank WDI / WFE; 2024; end-year listed domestic companies market capitalization as % of GDP. |
| 10 | Singapore | 116.5% | official_value Asia-Pacific; World Bank WDI / WFE; 2024; end-year listed domestic companies market capitalization as % of GDP. |
| 11 | Malaysia | 106.5% | official_value Asia-Pacific; World Bank WDI / WFE; 2024; end-year listed domestic companies market capitalization as % of GDP. |
| 12 | Australia | 98.9% | official_value Asia-Pacific; World Bank WDI / WFE; 2024; end-year listed domestic companies market capitalization as % of GDP. |
| 13 | Thailand | 98.7% | official_value Asia-Pacific; World Bank WDI / WFE; 2024; end-year listed domestic companies market capitalization as % of GDP. |
| 14 | Kuwait | 88.3% | official_value Middle East & North Africa; World Bank WDI / WFE; 2024; end-year listed domestic companies market capitalization as % of GDP. |
| 15 | South Korea | 83.0% | official_value Asia-Pacific; World Bank WDI / WFE; 2024; end-year listed domestic companies market capitalization as % of GDP. |
| 16 | Chile | 79.3% | official_value Americas; World Bank WDI / WFE; 2024; end-year listed domestic companies market capitalization as % of GDP. |
| 17 | Qatar | 77.7% | official_value Middle East & North Africa; World Bank WDI / WFE; 2024; end-year listed domestic companies market capitalization as % of GDP. |
| 18 | China | 62.7% | official_value Asia-Pacific; World Bank WDI / WFE; 2024; end-year listed domestic companies market capitalization as % of GDP. |
| 19 | Israel | 61.2% | official_value Middle East & North Africa; World Bank WDI / WFE; 2024; end-year listed domestic companies market capitalization as % of GDP. |
| 20 | Mauritius | 61.1% | official_value Sub-Saharan Africa; World Bank WDI / WFE; 2024; end-year listed domestic companies market capitalization as % of GDP. |
| 21 | Jamaica | 56.5% | official_value Americas; World Bank WDI / WFE; 2024; end-year listed domestic companies market capitalization as % of GDP. |
| 22 | Philippines | 54.6% | official_value Asia-Pacific; World Bank WDI / WFE; 2024; end-year listed domestic companies market capitalization as % of GDP. |
| 23 | Indonesia | 54.4% | official_value Asia-Pacific; World Bank WDI / WFE; 2024; end-year listed domestic companies market capitalization as % of GDP. |
| 24 | Kazakhstan | 47.7% | official_value Europe & Central Asia; World Bank WDI / WFE; 2024; end-year listed domestic companies market capitalization as % of GDP. |
| 25 | Jordan | 46.7% | official_value Middle East & North Africa; World Bank WDI / WFE; 2024; end-year listed domestic companies market capitalization as % of GDP. |
| 26 | Morocco | 46.4% | official_value Middle East & North Africa; World Bank WDI / WFE; 2024; end-year listed domestic companies market capitalization as % of GDP. |
| 27 | Luxembourg | 44.9% | official_value Europe & Central Asia; World Bank WDI / WFE; 2024; end-year listed domestic companies market capitalization as % of GDP. |
| 28 | Spain | 43.7% | official_value Europe & Central Asia; World Bank WDI / WFE; 2024; end-year listed domestic companies market capitalization as % of GDP. |
| 29 | Germany | 43.6% | official_value Europe & Central Asia; World Bank WDI / WFE; 2024; end-year listed domestic companies market capitalization as % of GDP. |
| 30 | Bahrain | 43.3% | official_value Middle East & North Africa; World Bank WDI / WFE; 2024; end-year listed domestic companies market capitalization as % of GDP. |
| 31 | Vietnam | 43.0% | official_value Asia-Pacific; World Bank WDI / WFE; 2024; end-year listed domestic companies market capitalization as % of GDP. |
| 32 | Seychelles | 37.4% | official_value Sub-Saharan Africa; World Bank WDI / WFE; 2024; end-year listed domestic companies market capitalization as % of GDP. |
| 33 | Iran | 36.1% | official_value Middle East & North Africa; World Bank WDI / WFE; 2024; end-year listed domestic companies market capitalization as % of GDP. |
| 34 | New Zealand | 35.7% | official_value Asia-Pacific; World Bank WDI / WFE; 2024; end-year listed domestic companies market capitalization as % of GDP. |
| 35 | Greece | 32.5% | official_value Europe & Central Asia; World Bank WDI / WFE; 2024; end-year listed domestic companies market capitalization as % of GDP. |
| 36 | Zambia | 30.7% | official_value Sub-Saharan Africa; World Bank WDI / WFE; 2024; end-year listed domestic companies market capitalization as % of GDP. |
| 37 | Brazil | 30.1% | official_value Americas; World Bank WDI / WFE; 2024; end-year listed domestic companies market capitalization as % of GDP. |
| 38 | Oman | 29.9% | official_value Middle East & North Africa; World Bank WDI / WFE; 2024; end-year listed domestic companies market capitalization as % of GDP. |
| 39 | Croatia | 29.9% | official_value Europe & Central Asia; World Bank WDI / WFE; 2024; end-year listed domestic companies market capitalization as % of GDP. |
| 40 | West Bank and Gaza | 29.8% | official_value Middle East & North Africa; World Bank WDI / WFE; 2024; end-year listed domestic companies market capitalization as % of GDP. |
| 41 | Cyprus | 29.0% | official_value Europe & Central Asia; World Bank WDI / WFE; 2024; end-year listed domestic companies market capitalization as % of GDP. |
| 42 | Peru | 28.4% | official_value Americas; World Bank WDI / WFE; 2024; end-year listed domestic companies market capitalization as % of GDP. |
| 43 | Turkey | 27.9% | official_value Europe & Central Asia; World Bank WDI / WFE; 2024; end-year listed domestic companies market capitalization as % of GDP. |
| 44 | Austria | 22.6% | official_value Europe & Central Asia; World Bank WDI / WFE; 2024; end-year listed domestic companies market capitalization as % of GDP. |
| 45 | Nigeria | 21.6% | official_value Sub-Saharan Africa; World Bank WDI / WFE; 2024; end-year listed domestic companies market capitalization as % of GDP. |
| 46 | Poland | 21.5% | official_value Europe & Central Asia; World Bank WDI / WFE; 2024; end-year listed domestic companies market capitalization as % of GDP. |
| 47 | Panama | 21.1% | official_value Americas; World Bank WDI / WFE; 2024; end-year listed domestic companies market capitalization as % of GDP. |
| 48 | Bermuda | 20.9% | official_value Americas; World Bank WDI / WFE; 2024; end-year listed domestic companies market capitalization as % of GDP. |
| 49 | Botswana | 20.1% | official_value Sub-Saharan Africa; World Bank WDI / WFE; 2024; end-year listed domestic companies market capitalization as % of GDP. |
| 50 | Sri Lanka | 19.7% | official_value Asia-Pacific; World Bank WDI / WFE; 2024; end-year listed domestic companies market capitalization as % of GDP. |
| 51 | Bangladesh | 19.5% | official_value Asia-Pacific; World Bank WDI / WFE; 2024; end-year listed domestic companies market capitalization as % of GDP. |
| 52 | Rwanda | 19.3% | official_value Sub-Saharan Africa; World Bank WDI / WFE; 2024; end-year listed domestic companies market capitalization as % of GDP. |
| 53 | Armenia | 18.7% | official_value Europe & Central Asia; World Bank WDI / WFE; 2024; end-year listed domestic companies market capitalization as % of GDP. |
| 54 | Hungary | 18.7% | official_value Europe & Central Asia; World Bank WDI / WFE; 2024; end-year listed domestic companies market capitalization as % of GDP. |
| 55 | Namibia | 18.5% | official_value Sub-Saharan Africa; World Bank WDI / WFE; 2024; end-year listed domestic companies market capitalization as % of GDP. |
| 56 | Colombia | 17.3% | official_value Americas; World Bank WDI / WFE; 2024; end-year listed domestic companies market capitalization as % of GDP. |
| 57 | Malta | 17.2% | official_value Europe & Central Asia; World Bank WDI / WFE; 2024; end-year listed domestic companies market capitalization as % of GDP. |
| 58 | Uzbekistan | 16.4% | official_value Europe & Central Asia; World Bank WDI / WFE; 2024; end-year listed domestic companies market capitalization as % of GDP. |
| 59 | Tunisia | 16.2% | official_value Middle East & North Africa; World Bank WDI / WFE; 2024; end-year listed domestic companies market capitalization as % of GDP. |
| 60 | Slovenia | 15.7% | official_value Europe & Central Asia; World Bank WDI / WFE; 2024; end-year listed domestic companies market capitalization as % of GDP. |
| 61 | Pakistan | 14.0% | official_value Asia-Pacific; World Bank WDI / WFE; 2024; end-year listed domestic companies market capitalization as % of GDP. |
| 62 | Kenya | 12.5% | official_value Sub-Saharan Africa; World Bank WDI / WFE; 2024; end-year listed domestic companies market capitalization as % of GDP. |
| 63 | Romania | 12.4% | official_value Europe & Central Asia; World Bank WDI / WFE; 2024; end-year listed domestic companies market capitalization as % of GDP. |
| 64 | Egypt | 10.9% | official_value Middle East & North Africa; World Bank WDI / WFE; 2024; end-year listed domestic companies market capitalization as % of GDP. |
| 65 | Czechia | 10.0% | official_value Europe & Central Asia; World Bank WDI / WFE; 2024; end-year listed domestic companies market capitalization as % of GDP. |
| 66 | Tanzania | 9.3% | official_value Sub-Saharan Africa; World Bank WDI / WFE; 2024; end-year listed domestic companies market capitalization as % of GDP. |
| 67 | Ghana | 9.2% | official_value Sub-Saharan Africa; World Bank WDI / WFE; 2024; end-year listed domestic companies market capitalization as % of GDP. |
| 68 | Belarus | 7.9% | official_value Europe & Central Asia; World Bank WDI / WFE; 2024; end-year listed domestic companies market capitalization as % of GDP. |
| 69 | Bulgaria | 7.4% | official_value Europe & Central Asia; World Bank WDI / WFE; 2024; end-year listed domestic companies market capitalization as % of GDP. |
| 70 | Azerbaijan | 2.2% | official_value Europe & Central Asia; World Bank WDI / WFE; 2024; end-year listed domestic companies market capitalization as % of GDP. |
Source snapshot: World Bank WDI indicator CM.MKT.LCAP.GD.ZS, with underlying WFE data. The table uses only numeric 2024 observations shown for this indicator.
Insights
Key insight
Hong Kong SAR is not just first; it is structurally separate from the rest of the table. Its ratio exceeds 1,100% of GDP, while the second-ranked entry is below 250%.
Notable pattern
Several Gulf and financial-center economies rank high because listed-market value can be large relative to domestic GDP. The ratio is therefore especially sensitive to financial-center structure, exchange concentration and local GDP scale.
Regional concentration
Asia-Pacific and Middle East & North Africa entries are prominent in the upper part of the ranking, while Europe & Central Asia has many mid-table and lower-table entries.
Outlier
The distance between Hong Kong SAR and the rest of the ranking is larger than the distance between most neighboring rows. The chart therefore uses Hong Kong SAR as the 100% bar reference.
What It Means
A high market-capitalization-to-GDP ratio means the listed equity market is large compared with annual domestic output. It does not automatically mean that the stock market is more accessible, safer, more liquid or better regulated.
For readers comparing countries, the ratio is most useful as a market-structure indicator. It shows where listed company valuation is large relative to the economy, but it should be read together with liquidity, free float, exchange rules, investor access, sector concentration and macroeconomic conditions.
For investment and policy analysis, very high values can point to financial-center effects, cross-border listings, large multinational issuers or valuation cycles. Low values can reflect bank-based finance, private ownership, state ownership or limited domestic listing depth.
FAQ
What does stock market capitalization as a share of GDP measure?
It measures the market value of listed domestic companies relative to the size of the economy. A value of 100% means listed domestic company market capitalization is roughly equal to annual GDP.
Does a higher value mean a better stock market?
No. The indicator measures size relative to GDP, not returns, liquidity, investability, valuation quality, governance, free float or investor access.
Why can financial centers rank very high?
Financial-center effects can make the ratio much higher than in larger domestic economies. Listed company value, cross-border capital flows and exchange concentration may be large relative to local GDP.
Why can a country appear much higher or lower than expected?
The ratio depends on listed-company market value relative to GDP. It can move sharply because of valuation cycles, exchange structure, free float, domestic listing practices, bank-based finance and the size of the local economy.
Why are some large economies lower than expected?
Large economies may rely more on bank finance, private ownership or overseas listings. The ratio can also be affected by valuation cycles and sector composition.
Are forecasts or projections included?
No. Every row in this table is official_value from the 2024 World Bank indicator snapshot. No official_forecast or modeled_projection rows are used.
Sources
World Bank Data — CM.MKT.LCAP.GD.ZS
Market capitalization of listed domestic companies (% of GDP)
Primary data source for all row values, target year and unit.
World Bank WDI metadata
World Development Indicators metadata glossary
Used for the indicator definition, underlying WFE source and measurement notes.
World Federation of Exchanges database via World Bank
Underlying exchange-data source named by the World Bank for this indicator.
Our World in Data processing note
Total market capitalization of listed domestic companies as a share of GDP
Cross-check source for indicator definition, source chain and update context.
Related rankings
More StatRanker pages connected by topic, category or ranking theme.

StatRanker (Website)
administrator
