

Top 100 Defense Companies by Revenue, 2026 Snapshot
Top defense contractors by arms revenue: 2026 snapshot
This ranking measures arms revenue: revenue from military goods and military services sold to military customers. It does not rank companies by market capitalization, total corporate sales, profit, contract backlog, or political influence. The 2026 snapshot uses the latest full public SIPRI Top 100 dataset available in 2026: company financial-year 2024 arms revenue, released by SIPRI in December 2025 and reported in constant 2024 US dollars.
A value of $64.65B means that SIPRI attributes about $64.65 billion of the company’s 2024 revenue to arms and military services. For diversified groups, the defense share can be far below total revenue; for pure-play military producers, arms revenue may be close to total revenue.
Data basis: SIPRI Arms Industry Database, December 2025. Page updated: May 2, 2026. The “2026 snapshot” label refers to the publication context in 2026; the underlying company revenue year is 2024.What the top of the defense revenue ranking shows
The upper tier is still dominated by US prime contractors, but the 2026 snapshot shows a broader international structure. BAE Systems is inside the top five, Rostec appears as a consolidated Russian entry because of limited company-level disclosure, and several Chinese state-owned groups remain large despite revenue declines linked to procurement disruption and internal investigations.
Beyond the highest US-dominated tier, the ranking shows the impact of rearmament in Europe and Asia. Rheinmetall and Hanwha Group appear just outside the largest prime-contractor cluster, while Mitsubishi Heavy Industries and Saab show how Japanese and European producers are moving upward on demand for ammunition, armored vehicles, air defense, missiles, aircraft, and related systems. Technology and services firms such as L3Harris, Leidos, Amentum, Booz Allen Hamilton, CACI, and SAIC show the growing revenue weight of command systems, space, cyber, electronics, and engineering services.
Large US prime with major exposure to combat aircraft, missiles, integrated air and missile defense, space, and sustainment.
High ranking reflects missiles, sensors, air defense, aerospace systems, and military electronics across a diversified aerospace group.
Defense-heavy profile built around strategic systems, space, sensors, bombers, missile defense, and advanced command networks.
The leading European-headquartered company in the ranking, with strength in land systems, naval platforms, electronic systems, and combat vehicles.
Revenue is supported by submarines, combat vehicles, munitions, IT services, mission systems, and large US Navy programs.
Still one of the largest defense groups despite a revenue decline, with activity in military aircraft, rotorcraft, weapons, satellites, and services.
Included as a holding-company entry because public data for many Russian arms companies is limited; domestic demand linked to the war in Ukraine is central to the figure.
China’s aviation group remains one of the largest defense producers, although the 2024 arms revenue figure was slightly lower year on year.
Large Chinese electronics and systems producer with major defense exposure, but 2024 arms revenue was down in SIPRI’s constant-dollar comparison.
Strong position in communications, space, ISR, electronic systems, and mission technologies used in military networks, surveillance, and electronic-warfare programs.
| Rank | Company | Arms revenue |
|---|---|---|
| 1 | Lockheed Martin Corp. | $64.65B |
| 2 | RTX | $43.60B |
| 3 | Northrop Grumman Corp. | $37.85B |
| 4 | BAE Systems | $33.79B |
| 5 | General Dynamics Corp. | $33.63B |
| 6 | Boeing | $30.55B |
| 7 | Rostec | $27.12B |
| 8 | AVIC | $20.32B |
| 9 | CETC | $18.92B |
| 10 | L3Harris Technologies | $16.21B |
Full Top 100 defense companies by arms revenue
Use the controls to narrow the ranking by company name, region, revenue size, or year-on-year change. The default view shows the Top 20, while the full Top 100 remains available in the table.
Showing the default Top 20 view.
| Rank | Company | Arms revenue, 2024 | Change |
|---|---|---|---|
| 1 | Lockheed Martin Corp. | $64.65B | +3.2% |
| 2 | RTX | $43.60B | +4.1% |
| 3 | Northrop Grumman Corp. | $37.85B | +3.3% |
| 4 | BAE Systems | $33.79B | +6.9% |
| 5 | General Dynamics Corp. | $33.63B | +8.1% |
| 6 | Boeing | $30.55B | −4.6% |
| 7 | Rostec | $27.12B | +26% |
| 8 | AVIC | $20.32B | −1.3% |
| 9 | CETC | $18.92B | −10% |
| 10 | L3Harris Technologies | $16.21B | +6.6% |
| 11 | NORINCO | $13.97B | −31% |
| 12 | Leonardo | $13.83B | +10% |
| 13 | Airbus | $13.37B | +1.2% |
| 14 | CSSC | $12.33B | +8.7% |
| 15 | Thales | $11.80B | +11% |
| 16 | HII | $10.28B | −3.1% |
| 17 | CASC | $10.23B | −16% |
| 18 | Leidos | $9.37B | +4.2% |
| 19 | Amentum | $8.33B | +1.6% |
| 20 | Rheinmetall | $8.24B | +47% |
| 21 | Hanwha Group | $7.97B | +42% |
| 22 | Booz Allen Hamilton | $7.81B | +9.8% |
| 23 | Rolls-Royce | $7.20B | +8.3% |
| 24 | CACI International | $6.51B | +11% |
| 25 | Elbit Systems | $6.28B | +14% |
| 26 | AECC | $6.26B | +9.6% |
| 27 | Honeywell International | $6.09B | +5.4% |
| 28 | Saab | $5.55B | +24% |
| 29 | Safran | $5.32B | +15% |
| 30 | MBDA | $5.26B | +7.8% |
| 31 | Israel Aerospace Industries | $5.19B | +13% |
| 32 | Mitsubishi Heavy Industries | $5.03B | +37% |
| 33 | GE Aerospace | $4.89B | +0.8% |
| 34 | Rafael | $4.70B | +23% |
| 35 | KBR | $4.68B | +7.3% |
| 36 | Naval Group | $4.66B | 0.0% |
| 37 | EDGE Group | $4.66B | n/a |
| 38 | CSGC | $4.58B | −9.7% |
| 39 | Babcock International Group | $4.57B | +9.1% |
| 40 | Dassault Aviation Group | $4.29B | +30% |
| 41 | United Shipbuilding Corp. | $4.11B | +6.5% |
| 42 | KNDS | $4.11B | +14% |
| 43 | Science Applications International Corp. | $3.89B | −2.5% |
| 44 | Hindustan Aeronautics | $3.81B | −0.3% |
| 45 | V2X | $3.76B | +7.1% |
| 46 | Czechoslovak Group | $3.63B | +193% |
| 47 | ASELSAN | $3.47B | +24% |
| 48 | Textron | $3.29B | +8.6% |
| 49 | TransDigm Group | $3.18B | +20% |
| 50 | NCSIST | $3.11B | −2.5% |
| 51 | PGZ | $3.04B | +34% |
| 52 | JSC Ukrainian Defense Industry | $3.01B | +41% |
| 53 | Fincantieri | $2.99B | +4.5% |
| 54 | Parker-Hannifin Corp. | $2.74B | +2.2% |
| 55 | Kawasaki Heavy Industries | $2.65B | +36% |
| 56 | Bechtel Corp. | $2.64B | −14% |
| 57 | ST Engineering | $2.62B | +14% |
| 58 | Bharat Electronics | $2.47B | +24% |
| 59 | Serco Group | $2.42B | +0.4% |
| 60 | LIG Nex1 | $2.40B | +38% |
| 61 | ThyssenKrupp | $2.29B | +12% |
| 62 | Hensoldt | $2.24B | +18% |
| 63 | Parsons Corp. | $2.22B | +17% |
| 64 | Fujitsu | $2.19B | +25% |
| 65 | Turkish Aerospace Industries | $2.16B | +11% |
| 66 | Oshkosh Corp. | $2.16B | +4.9% |
| 67 | Diehl | $2.11B | +53% |
| 68 | BWX Technologies | $2.07B | +6.2% |
| 69 | Teledyne Technologies | $2.05B | −5.5% |
| 70 | Korea Aerospace Industries | $2.01B | −11% |
| 71 | QinetiQ | $1.95B | 0.0% |
| 72 | Sierra Nevada Corp. | $1.94B | −2.5% |
| 73 | Baykar | $1.90B | −12% |
| 74 | General Atomics | $1.89B | −13% |
| 75 | Eaton | $1.87B | +6.3% |
| 76 | Mitsubishi Electric Corp. | $1.85B | +87% |
| 77 | SpaceX | $1.81B | +103% |
| 78 | Curtiss-Wright Corp. | $1.79B | +9.8% |
| 79 | Kongsberg Gruppen | $1.78B | +17% |
| 80 | Hyundai Rotem | $1.73B | +45% |
| 81 | Amphenol Corp. | $1.67B | +18% |
| 82 | CNNC | $1.67B | −8.2% |
| 83 | NEC Corp. | $1.54B | +43% |
| 84 | United Launch Alliance | $1.54B | +45% |
| 85 | CAE | $1.46B | +5.8% |
| 86 | Moog | $1.40B | +9.4% |
| 87 | Roketsan | $1.39B | +13% |
| 88 | Navantia | $1.27B | +4.1% |
| 89 | HEICO Corp. | $1.25B | +17% |
| 90 | Melrose Industries | $1.24B | −1.6% |
| 91 | Mazagon Dock Shipbuilders | $1.23B | +9.8% |
| 92 | ViaSat | $1.22B | +4.3% |
| 93 | MKE | $1.21B | +17% |
| 94 | Howmet Aerospace | $1.16B | +10% |
| 95 | Keysight Technologies | $1.15B | −11% |
| 96 | DEFEND ID | $1.14B | +39% |
| 97 | TTM Technologies | $1.13B | +8.7% |
| 98 | Mitre Corp. | $1.12B | −0.9% |
| 99 | The Aerospace Corp. | $1.10B | +0.9% |
| 100 | Ultra Electronics Group | $1.07B | +11% |
Source: SIPRI Arms Industry Database, December 2025. Revenue figures are in constant 2024 US dollars and rounded to the nearest $10 million by SIPRI. “Change” is the real change in arms revenue from 2023 to 2024; n/a means comparable prior-year data was not available.
Charts: revenue concentration and growth outliers
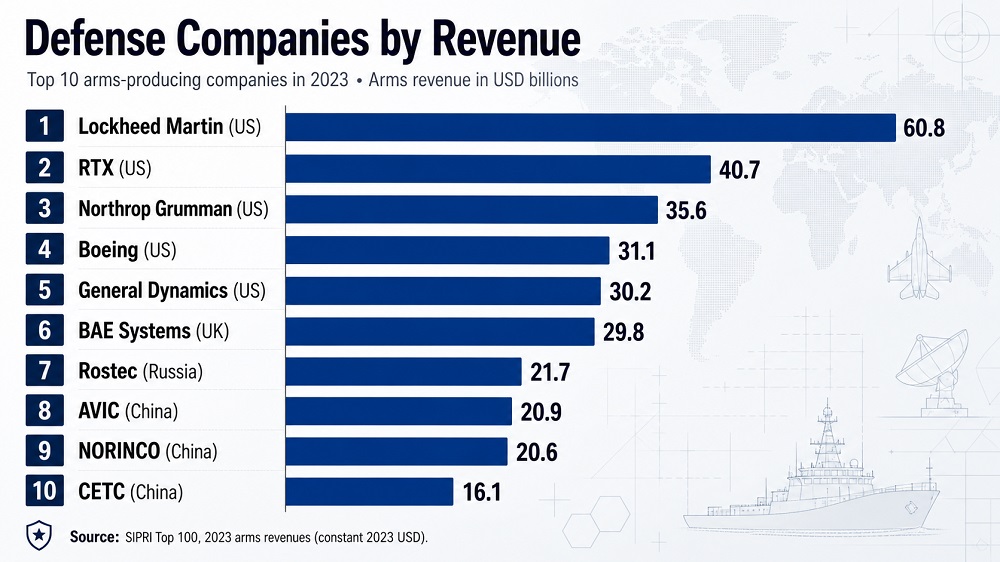
The bar chart shows the steep drop from the largest US primes to the rest of the Top 10. The scatter chart links company size with real revenue growth, showing why the most important movements are not always at the very top: mid-ranking firms such as Czechoslovak Group, SpaceX, Mitsubishi Electric, Diehl, Hanwha Group, and Rheinmetall recorded some of the strongest percentage increases.
Top 10 arms revenue, 2024
- Lockheed Martin Corp. — $64.65B
- RTX — $43.60B
- Northrop Grumman Corp. — $37.85B
- BAE Systems — $33.79B
- General Dynamics Corp. — $33.63B
- Boeing — $30.55B
- Rostec — $27.12B
- AVIC — $20.32B
- CETC — $18.92B
- L3Harris Technologies — $16.21B
Arms revenue vs. real revenue change
- Czechoslovak Group — +193%, $3.63B
- SpaceX — +103%, $1.81B
- Mitsubishi Electric Corp. — +87%, $1.85B
- Diehl — +53%, $2.11B
- Rheinmetall — +47%, $8.24B
- United Launch Alliance — +45%, $1.54B
- Hyundai Rotem — +45%, $1.73B
- NEC Corp. — +43%, $1.54B
The scatter chart excludes rows where comparable prior-year growth is unavailable. High growth rates can reflect new programs, acquisitions, export surges, currency and inflation adjustments, or recovery from a smaller base.
Methodology
The indicator is arms revenue, defined by SIPRI as revenue generated from sales of military goods and services to military customers. It includes major weapons, military platforms, components, electronics, military services, maintenance, and other defense-related activities where sufficient data are available. It excludes ordinary civilian revenue inside diversified companies and excludes military research and development divisions at academic institutions.
The year used for the table is company financial-year 2024 as reported or estimated on SIPRI’s company basis, expressed in constant 2024 US dollars. The page is labelled as a 2026 snapshot because the SIPRI dataset was released in December 2025 and is the latest complete Top 100 public dataset available for use in 2026. Using 2024 financial-year revenue is more reliable than projecting 2026 revenue because many defense groups report with different fiscal calendars, different segment definitions, and varying levels of disclosure.
Companies are ranked by arms revenue at the end of the relevant financial year. SIPRI revises past years when company reports, exchange rates, corporate structures, or better estimates become available. The table therefore uses SIPRI’s updated 2023 comparison values where available, not necessarily the values published in older releases.
Revenue values are rounded to the nearest $10 million by SIPRI. In this page, billions are displayed with two decimal places for readability. Percentage changes below 10% may be shown with one decimal place, while larger changes are often rounded to whole percentages, matching the style of the source table. EDGE Group is listed without a comparable year-on-year change because SIPRI did not have consistent 2023 data for that company in the same basis.
The largest limitation is comparability. Publicly listed US and European companies generally disclose more segment detail than many state-owned or private companies. Some rows are estimates with high uncertainty, and Russian data are especially constrained after 2022. For China, SIPRI includes available companies but notes that procurement disruption and corruption-related investigations affected several reported revenue movements. The ranking is a useful industrial benchmark, but it is not a measure of military capability, combat effectiveness, weapons quality, profit, backlog, or government influence.
Insights: how to interpret the 2026 defense-company hierarchy
The top of the ranking is structurally concentrated. The first six positions are occupied by large US and UK-listed primes with deep portfolios, long-running government relationships, and exposure to aircraft, naval platforms, missiles, space systems, electronics, and sustainment. These firms benefit from scale, but they also face the highest scrutiny on cost overruns, production delays, and program execution.
The middle of the ranking shows where procurement pressure is changing the industrial map. Rheinmetall, Hanwha Group, Czechoslovak Group, PGZ, JSC Ukrainian Defense Industry, Diehl, Hyundai Rotem, and several Japanese producers reflect the demand shock created by ammunition shortages, air-defense needs, Ukraine-related procurement, and national rearmament plans. In percentage terms, some of the fastest growth is outside the traditional top five.
The lower part of the Top 100 is important because it contains specialist suppliers that shape real defense capacity: electronics firms, shipyards, cyber and engineering service providers, propulsion and component companies, space launch firms, simulation providers, and missile specialists. A company ranked 80th can still be strategically important if it supplies a bottleneck component, a critical sensor, or a unique production capability. Arms revenue can also rise before equipment is fully delivered to end users, so the table should not be read as an immediate measure of battlefield availability.
Regionally, the United States remains the center of gravity, but Europe’s growth is more visible than in earlier cycles. Asian results are mixed: South Korean and Japanese companies expanded rapidly, while several large Chinese entries declined. The Middle East reached a record number of companies in the Top 100, reflecting both domestic conflict-related demand and export ambitions in Türkiye, Israel, and the UAE.
How to use this ranking
- For industry analysts and researchers, the ranking helps separate total corporate size from defense exposure. Honeywell, Airbus, and Mitsubishi Heavy Industries are large diversified groups, while companies such as MBDA, KNDS, Roketsan, and LIG Nex1 are much more defense-focused.
- For policymakers, the table highlights supply-chain dependence. Platforms at the top rely on many mid-tier firms for electronics, propulsion, simulation, communications, missiles, and maintenance.
- For journalists and researchers, year-on-year change should be interpreted with context. A 50% or 100% rise may reflect new accounting scope, acquisitions, delayed deliveries catching up, export surges, or a small base.
- For non-specialist readers, the ranking explains why defense budgets do not translate instantly into battlefield capacity. Large backlogs, skilled labor, critical materials, certification, and production-line expansion can slow delivery even when revenue is rising.
FAQ
Does this ranking measure total company revenue?
No. It measures arms revenue: revenue from military goods and military services. A diversified company may have much larger total revenue than its arms revenue. For example, aerospace, electronics, engineering, or industrial groups may sell both military and civilian products.
Why is the page called a 2026 snapshot if the data year is 2024?
The latest complete SIPRI Top 100 dataset available in 2026 was released in December 2025 and covers company financial-year 2024. Defense-company rankings lag because they depend on annual reports, estimates, currency conversion, and harmonization across different fiscal calendars.
Why can different defense-company rankings produce different results?
Rankings can differ because they use different definitions of defense revenue, reporting windows, company submissions, currency conversion, and treatment of subsidiaries. SIPRI focuses on arms-producing and military services companies and applies a harmonized research methodology across countries.
Is a higher rank the same as better military technology?
No. Revenue reflects sales volume, not necessarily technological superiority, delivery speed, combat effectiveness, or innovation. A smaller company may be highly advanced in missiles, drones, cyber, sensors, satellites, or a single critical component.
Why are some state-owned companies difficult to compare?
Disclosure standards vary widely. Some state-owned groups publish limited segment data, some combine civilian and military activity, and some operate through subsidiaries. SIPRI uses open sources and estimates when possible, but uncertainty is higher where public reporting is limited.
Why did some mid-ranking companies grow faster than the biggest primes?
Smaller revenue bases can produce larger percentage changes. Growth can also come from ammunition demand, urgent procurement, export contracts, acquisitions, space programs, or national rearmament plans. That is why the change column should be read alongside absolute revenue.
Can this ranking be used to compare national military power?
Only with caution. The table measures company revenue, not national inventories, readiness, doctrine, manpower, logistics, or combat experience. It is best used as an industrial-capacity indicator and as one input for defense-industry analysis.
Sources
Primary source for the ranking, company arms revenues, 2023 comparison values, real percentage changes, regional context, and methodology notes.
https://www.sipri.org/publications/2025/sipri-fact-sheets/sipri-top-100-arms-producing-and-military-services-companies-2024Underlying database used by SIPRI for the annual Top 100, including historical revisions, company scope, and methodological definitions.
https://www.sipri.org/databases/armsindustryContext for the record $679 billion total, the 5.9% real increase, and regional patterns in the latest Top 100 release.
https://www.sipri.org/media/press-release/2025/sipri-top-100-arms-producers-see-combined-revenues-surge-states-rush-modernize-and-expand-arsenalsStatRanker (Website)
administrator
