

Top 100 Pharma Companies by Revenue in 2026
How to Read the Revenue Ranking
Compiled from company-reported and market data, then checked for obvious outliers, source conflicts, company names and business-model fit.This ranking compares 100 listed companies across pharmaceuticals, biotechnology and closely related healthcare businesses. Revenue is shown in U.S. dollars and rounded to billions.
Use it as a size map, not as a quality ranking. CVS Health, Sinopharm, Roche and Eli Lilly can all appear near the top, but they do not make money in the same way.
The timing matters. GLP-1 obesity and diabetes drugs, oncology portfolios, biosimilars, generics, post-pandemic vaccine normalization, contract research, animal health and distribution-heavy business models are all changing how pharma-related revenue looks in 2026.
- About this ranking: the page was built as an editorial data reference, not a sponsored list.
- Source review: rows were checked against industry lists and company-reported figures when a value looked unusually large or inconsistent.
- Best use: compare total company size first, then switch to prescription-only sources when the question is drug sales rather than overall business volume.
CVS Health leads because pharmacy retail, benefit management and healthcare services are counted here, not just drug manufacturing.
The list combines drugmakers, biotech firms, generics groups, service providers, distributors and pharma-adjacent suppliers.
The middle of the table is much smaller than the top few companies, which shows how fast the list narrows after the first tier.
This is a total company revenue ranking. Manufacturer-only prescription drug lists put innovative drugmakers closer to the center and reduce the effect of pharmacy, distribution and services revenue.
Data checks behind the table
- Coverage: 100 listed companies with revenue values above $1.7B in the selected pharma and biopharma-adjacent universe.
- Concentration: the first 10 rows make up about 55.2% of the Top 100 revenue pool; the first 20 make up about 76.8%.
- Outlier effect: CVS Health alone represents about 21.6% of the Top 100 pool. The second chart removes the largest distribution-linked outlier so the drugmaker tier is easier to read.
- Regional mix: the list includes 35 Asia-Pacific companies, 32 Americas companies, 30 European companies, 2 African companies and 1 Middle Eastern company based on the table’s region labels.
- Anomaly removed: an obvious Pharming Group inconsistency was excluded because the company’s own 2025 release reported $376.1 million, not a level comparable with the largest global pharmaceutical groups.
What the first 10 rows actually show
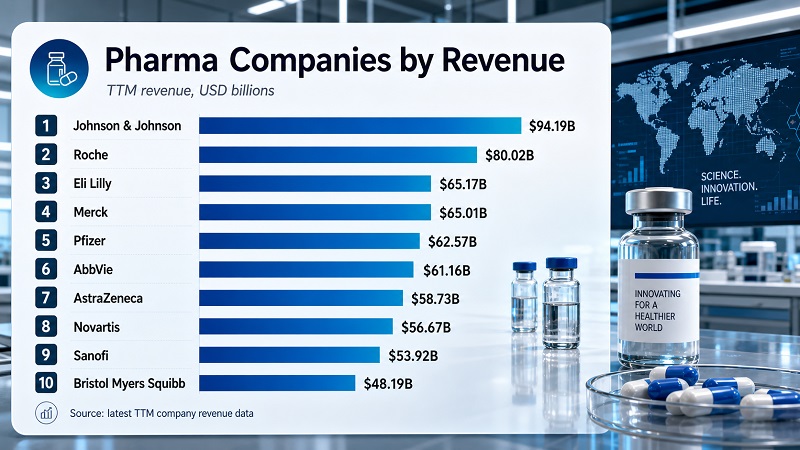
The first 10 rows mix two very different types of companies. CVS Health and Sinopharm show how pharmacy, benefit-management and distribution-linked models can produce enormous sales. Johnson & Johnson, Roche, Eli Lilly, Merck, Pfizer, AbbVie, AstraZeneca, Novartis and Sanofi represent the large drugmaker tier.
Together, these 10 companies account for about $1.026 trillion of the Top 100 total. Remove CVS Health, and the remaining Top 10 revenue shown here falls to about $623.61 billion. That second number is often the more useful comparison when the question is large manufacturer size.
Lilly deserves special attention in this snapshot because GLP-1 demand has changed its growth profile. Pfizer also needs context: it remains very large, but its revenue mix no longer looks like the COVID-product peak period.
CVS Health
Ranks first because pharmacy retail, benefits and healthcare services all sit inside the revenue number.
Johnson & Johnson
A diversified healthcare group with a large innovative medicines business and a broad medical technology footprint.
Sinopharm
Ranks high because distribution and healthcare-product channels create very large sales volume in China.
Roche
Combines a major innovative medicines portfolio with one of the world’s largest diagnostics businesses.
Eli Lilly
Diabetes and obesity medicines, especially GLP-1 products, are lifting the company’s sales base.
Merck & Co.
Remains one of the largest global drugmakers through oncology, vaccines and specialty medicines.
Pfizer
Still very large, but the post-pandemic revenue mix is different from the COVID-product peak.
AbbVie
Shows how immunology, aesthetics, oncology and neuroscience can support size after major patent-cycle pressure.
AstraZeneca
Supported by oncology, rare disease, respiratory and cardiovascular-metabolic medicines.
Novartis
A focused innovative-medicines company after the Sandoz separation, but still one of the largest by reported sales.
Top 10 companies by revenue
| Rank | Company | Revenue | Country |
|---|---|---|---|
| 1 | CVS Health | $402.06B | USA |
| 2 | Johnson & Johnson | $94.19B | USA |
| 3 | Sinopharm | $80.09B | China |
| 4 | Roche | $80.02B | Switzerland |
| 5 | Eli Lilly | $65.17B | USA |
| 6 | Merck & Co. | $65.01B | USA |
| 7 | Pfizer | $62.57B | USA |
| 8 | AbbVie | $61.16B | USA |
| 9 | AstraZeneca | $58.73B | United Kingdom |
| 10 | Novartis | $56.67B | Switzerland |
Complete Revenue Ranking and Interactive Company Table
The table is sorted by revenue in USD billions. By default, it shows the first 20 companies; use the view selector to open the full Top 100.
| Rank | Company | Revenue, USD billions | Country |
|---|---|---|---|
| 1 | CVS Health | $402.06B | USA |
| 2 | Johnson & Johnson | $94.19B | USA |
| 3 | Sinopharm | $80.09B | China |
| 4 | Roche | $80.02B | Switzerland |
| 5 | Eli Lilly | $65.17B | USA |
| 6 | Merck & Co. | $65.01B | USA |
| 7 | Pfizer | $62.57B | USA |
| 8 | AbbVie | $61.16B | USA |
| 9 | AstraZeneca | $58.73B | United Kingdom |
| 10 | Novartis | $56.67B | Switzerland |
| 11 | Sanofi | $53.92B | France |
| 12 | Bayer | $52.29B | Germany |
| 13 | Bristol Myers Squibb | $48.19B | USA |
| 14 | Novo Nordisk | $47.70B | Denmark |
| 15 | GSK | $43.77B | United Kingdom |
| 16 | Amgen | $36.75B | USA |
| 17 | China Resources Pharmaceutical Group | $35.30B | Hong Kong |
| 18 | Takeda Pharmaceutical | $29.86B | Japan |
| 19 | Gilead Sciences | $29.44B | USA |
| 20 | Merck KGaA | $23.78B | Germany |
| 21 | Teva Pharmaceutical Industries | $17.25B | Israel |
| 22 | CSL | $15.43B | Australia |
| 23 | Otsuka Holdings | $14.47B | Japan |
| 24 | Regeneron Pharmaceuticals | $14.34B | USA |
| 25 | Viatris | $14.29B | USA |
| 26 | Labcorp | $13.95B | USA |
| 27 | Vertex Pharmaceuticals | $12.00B | USA |
| 28 | Baxter | $11.24B | USA |
| 29 | Sandoz Group | $11.15B | Switzerland |
| 30 | Astellas Pharma | $10.95B | Japan |
| 31 | Daiichi Sankyo | $10.94B | Japan |
| 32 | Guangzhou Baiyunshan Pharmaceutical Holdings | $10.55B | China |
| 33 | Bausch Health | $10.26B | Canada |
| 34 | Biogen | $9.89B | USA |
| 35 | Zoetis | $9.46B | USA |
| 36 | UCB | $9.09B | Belgium |
| 37 | Lonza | $8.24B | Switzerland |
| 38 | Grifols | $8.23B | Spain |
| 39 | ICON plc | $8.10B | Ireland |
| 40 | Chugai Pharmaceutical | $7.19B | Japan |
| 41 | Sun Pharmaceutical | $6.39B | India |
| 42 | Organon | $6.21B | USA |
| 43 | WuXi AppTec | $5.95B | China |
| 44 | Huadong Medicine | $5.93B | China |
| 45 | Fosun Pharma | $5.58B | China |
| 46 | BeOne Medicines | $5.34B | USA |
| 47 | Galderma Group | $5.24B | Switzerland |
| 48 | Galenica | $5.22B | Switzerland |
| 49 | Incyte | $5.14B | USA |
| 50 | Eisai | $5.06B | Japan |
| 51 | Elanco | $4.71B | USA |
| 52 | Ipsen | $4.61B | France |
| 53 | CSPC Pharmaceutical Group | $4.44B | China |
| 54 | Jazz Pharmaceuticals | $4.26B | Ireland |
| 55 | Perrigo | $4.25B | Ireland |
| 56 | Jiangsu Hengrui Medicine | $4.19B | China |
| 57 | Nipro Corporation | $4.00B | Japan |
| 58 | Dr. Reddy's Laboratories | $3.95B | India |
| 59 | Sino Biopharmaceutical | $3.86B | China |
| 60 | Lundbeck | $3.80B | Denmark |
| 61 | Aurobindo Pharma | $3.76B | India |
| 62 | Alnylam Pharmaceuticals | $3.71B | USA |
| 63 | Argenx | $3.60B | Netherlands |
| 64 | Ono Pharmaceutical | $3.43B | Japan |
| 65 | BioNTech | $3.35B | Germany |
| 66 | BioMarin Pharmaceutical | $3.22B | USA |
| 67 | United Therapeutics | $3.18B | USA |
| 68 | Kyowa Kirin | $3.16B | Japan |
| 69 | Cipla | $3.15B | India |
| 70 | Hikma Pharmaceuticals | $3.12B | United Kingdom |
| 71 | Genmab | $3.10B | Denmark |
| 72 | West Pharmaceutical Services | $3.07B | USA |
| 73 | Amneal Pharmaceuticals | $3.01B | USA |
| 74 | Shionogi | $2.97B | Japan |
| 75 | Celltrion | $2.94B | South Korea |
| 76 | Neurocrine Biosciences | $2.86B | USA |
| 77 | Recordati | $2.85B | Italy |
| 78 | Zydus Lifesciences | $2.84B | India |
| 79 | Swedish Orphan Biovitrum | $2.82B | Sweden |
| 80 | Lupin Limited | $2.81B | India |
| 81 | Tong Ren Tang | $2.58B | China |
| 82 | WuXi Biologics | $2.55B | China |
| 83 | Clicks Group | $2.54B | South Africa |
| 84 | Medpace | $2.53B | USA |
| 85 | Richter Gedeon | $2.46B | Hungary |
| 86 | Aspen Pharmacare | $2.44B | South Africa |
| 87 | Royalty Pharma | $2.37B | United Kingdom |
| 88 | Exelixis | $2.32B | USA |
| 89 | Medios AG | $2.25B | Germany |
| 90 | Sarepta Therapeutics | $2.19B | USA |
| 91 | Sumitomo Pharma | $2.14B | Japan |
| 92 | Orion Corporation | $2.14B | Finland |
| 93 | Santen Pharmaceutical | $2.06B | Japan |
| 94 | Mallinckrodt Pharmaceuticals | $1.93B | United Kingdom |
| 95 | Moderna | $1.92B | USA |
| 96 | Biocon | $1.91B | India |
| 97 | Changchun High-Tech Industry | $1.87B | China |
| 98 | Rohto Pharmaceutical | $1.84B | Japan |
| 99 | Glenmark Pharmaceuticals | $1.84B | India |
| 100 | PTC Therapeutics | $1.73B | USA |
How the source data was handled: the market snapshot was compiled from CompaniesMarketCap pharmaceutical-category revenue pages and cross-checked against industry rankings, SEC filings, annual reports and company investor releases where available. Values are rounded to two decimals in USD billions. Snapshot accessed and checked May 2, 2026. The table uses total company revenue, so some pharma-adjacent companies are included even when their sales are not limited to prescription drugs. No placement in the table is sponsored.
Charts: where the list gets concentrated
The first chart shows the first 20 companies exactly as they appear in the ranking. CVS Health is so large that the manufacturer tier becomes harder to read. The second chart removes CVS Health and Sinopharm, giving a cleaner comparison among large drugmakers and pharma-service companies.
Top 20 total-revenue view: ranks 1–20
Top 20 comparison view after excluding CVS Health and Sinopharm
- CVS Health — $402.06B
- Johnson & Johnson — $94.19B
- Sinopharm — $80.09B
- Roche — $80.02B
- Eli Lilly — $65.17B
- Merck & Co. — $65.01B
- Pfizer — $62.57B
- AbbVie — $61.16B
- AstraZeneca — $58.73B
- Novartis — $56.67B
- Sanofi — $53.92B
- Bayer — $52.29B
- Bristol Myers Squibb — $48.19B
- Novo Nordisk — $47.70B
- GSK — $43.77B
- Amgen — $36.75B
- China Resources Pharmaceutical Group — $35.30B
- Takeda Pharmaceutical — $29.86B
- Gilead Sciences — $29.44B
- Merck KGaA — $23.78B
The first 20 rows account for about $1.427 trillion, or about 76.8% of the Top 100 total. CVS Health alone accounts for about 28.2% of that first-20 total, so total-revenue rankings need context before they are used to compare drugmakers.
Methodology
The indicator is total revenue, converted or displayed in U.S. dollars and rounded to billions. In plain terms, revenue means reported sales before expenses are deducted. It is useful for comparing company size, distribution reach and operating footprint.
This is a 2026 snapshot, not a forecast for the full 2026 year. Many companies had already published full-year 2025 results or trailing-twelve-month revenue data by early 2026. Where a full annual figure was not comparable across markets, the latest public trailing revenue value was used.
Rows were reviewed in three passes: revenue order, business-model fit and obvious source conflicts. Company names were standardized for readability, while the values stayed tied to reported source data. Figures were rounded to two decimal places in USD billions.
Included and excluded business types
| Business type | Treatment | Reason |
|---|---|---|
| Innovative drugmakers and biotech | Included | They are the core of the pharma company universe. |
| Generics and biosimilars | Included | They are part of global medicine supply and reported pharma sales. |
| Pharmacy, benefit management and distribution-linked groups | Included with context | They appear in public pharma-category revenue tables, but they should not be read as direct peers of patented drugmakers. |
| CRO, CDMO, diagnostics, packaging and pharma-service suppliers | Included with context | They show the infrastructure around drug development, manufacturing, testing and delivery. |
| Private companies without comparable revenue data | Excluded | The ranking relies on source data that readers can check. |
| Obvious source anomalies | Excluded or adjusted | A row was not used when company-reported revenue clearly contradicted the table value. |
An obvious Pharming Group anomaly in one market table was not used. Pharming’s own 2025 release reported $376.1 million of total revenue, which does not fit a top-tier global revenue position. To keep the table at 100 companies, the next eligible company by revenue was included.
The main limitation is comparability. A dollar from pharmacy benefit management, wholesale distribution, diagnostics, contract research or medical packaging is not economically identical to a dollar from patented medicine sales. Revenue also says nothing by itself about margin, R&D intensity, patent quality, pipeline risk, geographic access, drug affordability or patient outcomes.
For prescription-only comparisons, use this table alongside manufacturer-focused sources such as Pharm Exec and Fierce Pharma.
What stands out in the 2026 ranking
- The top is much heavier than the bottom. The first 10 rows generate about $1.026 trillion, or roughly 55.2% of the Top 100 total. The first 20 generate about $1.427 trillion, or roughly 76.8%.
- CVS changes the picture. CVS Health alone contributes about 21.6% of the Top 100 total and about 28.2% of the first-20 total. That does not make CVS a stronger drug innovator than Roche, Lilly or Merck; it shows how large pharmacy and benefit-management revenue can be.
- Asia-Pacific has the largest company count. The table includes 35 Asia-Pacific companies, reflecting China’s distribution scale, Japan’s established branded pharma base, India’s generics strength and South Korea’s biologics presence.
- The Americas carry many of the largest U.S.-listed manufacturers. The region has 32 companies in the table, including Lilly, Merck, Pfizer, AbbVie, Bristol Myers Squibb, Amgen, Gilead, Regeneron, Vertex and several specialist biotech names.
- Europe remains central in high-value pharma. The table includes 30 European companies, with Roche, Novartis, Sanofi, AstraZeneca, Bayer, GSK, Novo Nordisk, Merck KGaA, Sandoz, UCB and Lonza spread across branded medicines, generics and pharma services.
- Smaller revenue does not always mean weaker strategic value. Companies around $2B–$5B can be important in rare disease, biologics services, generics, animal health, drug delivery, clinical research or regional pharmaceutical markets.
- Prescription-only rankings will not look the same. Remove pharmacy services, distributors, CROs and suppliers, and the center of the list shifts toward Johnson & Johnson, Roche, Lilly, Merck, Pfizer, AbbVie, AstraZeneca, Novartis, Sanofi, Bayer, Bristol Myers Squibb and Novo Nordisk.
How to use the table without misreading it
For a quick market scan, start with the full table and filter by region. That shows where large listed companies are clustered and whether a region is represented mainly by branded drugmakers, generics groups, distributors or service providers.
For competitor research, stay inside the same business model. Roche, Merck, Lilly and AstraZeneca are closer peers than CVS Health and Roche, even though CVS is larger by total revenue. ICON and Medpace belong in a service-provider comparison, not an oncology-drugmaker comparison.
For student or research use, treat the ranking as a starting dataset. Revenue explains size, but it should be paired with operating margin, R&D spending, patent cliffs, product concentration, approvals, regulatory risk and pipeline maturity.
For procurement or partnership screening, the table can help narrow a shortlist. It should not decide the partner choice on its own.
FAQ
Does this ranking measure prescription drug sales only?
No. It uses total company revenue for listed companies in and around the pharma category. Prescription-only lists usually look different because they exclude pharmacy services, distribution, diagnostics, contract research and other non-drug revenue streams.
Why is CVS Health ranked first if it is not a pure drugmaker?
CVS Health has very large pharmacy, benefits and healthcare-services revenue. In a total-revenue table, that model can outrank research-based pharmaceutical manufacturers even though the businesses are not direct peers.
Why do some biotech companies rank lower than famous pharma brands?
Many biotech companies build valuable pipelines before they have very large product sales. Revenue rankings favor companies with marketed products, distribution reach and mature global sales channels.
Is higher revenue the same as better innovation?
No. A company can be very large and still face weak pipeline momentum, patent pressure or limited first-in-class innovation. Innovation depends on R&D quality, clinical success, approvals and patient impact.
Why are Japanese, Indian and Chinese companies common in the Top 100?
Japan contributes established branded and specialty drugmakers. India brings generics and global medicine supply. China adds domestic-market size, distribution, traditional medicine, biotech services and increasingly advanced drug development.
Why use a 2026 snapshot instead of a full 2026 year?
Full 2026 results will not be available until companies report after year-end. This snapshot uses the latest annual and trailing data available during 2026, so the table stays current without pretending to know future full-year results.
Can this table be used for financial research?
Yes, but only as a starting point. Revenue needs to be read alongside profitability, debt, valuation, pipeline risk, patent expirations, regulatory exposure and company filings.
Sources
The sources below were used to build and check the 2026 snapshot, separate total revenue from prescription-drug sales, and verify the treatment of anomalous market data. The table stays close to sources readers can inspect rather than relying on a black-box ranking.
Main market snapshot for listed companies in the pharmaceutical category. The table was reviewed for consistency and adjusted where an obvious anomaly conflicted with company-reported revenue.
https://companiesmarketcap.com/pharmaceuticals/largest-pharmaceutical-companies-by-revenue/Used to compare the largest manufacturer-focused names and to frame the 2025–2026 shift among major drugmakers.
https://www.fiercepharma.com/special-reports/top-20-pharma-companies-2025-revenueIndustry reference for prescription-drug sales rankings, which differ from total company revenue rankings.
https://www.pharmexec.com/view/2025-pharm-exec-top-50-companiesOfficial filing source for U.S.-listed companies when checking annual revenue and business-segment context.
https://www.sec.gov/edgar/search/Reference source for revenue definitions, fiscal-year context, product mix and company-reported cross-checks.
https://www.annualreports.com/Used to verify that Pharming Group reported 2025 revenue of $376.1 million, supporting the decision to exclude a public-table anomaly from this Top 100 snapshot.
https://www.pharming.com/news/pharming-group-reports-fourth-quarter-full-year-2025-financial-resultsStatRanker (Website)
administrator
