Top Countries by Airline Departures Worldwide: Latest Official Ranking
A reliable way to compare the scale of national airline systems is registered carrier departures worldwide — a country-level indicator that counts domestic departures and departures abroad operated by airlines registered in that country. For a 2025 snapshot based on comparable official country data, the latest full cross-country reference year is still 2023, so it remains the strongest base for the ranking.
This distinction matters because a busy airport and a large national airline system are not the same thing. A country can handle heavy transfer traffic from foreign carriers and still rank lower on a carrier-based indicator. Another can rank high because its own airlines operate dense domestic schedules, strong regional networks, or both. That is why the United States and China stand far above the rest: each combines scale, frequency, and a very large carrier base, while countries such as the United Arab Emirates or the United Kingdom reflect a different mix of hub activity and airline-system depth.
9.267 million carrier departures in 2023, far ahead of every other country.
4.909 million departures, showing how large the Chinese airline system became after recovery.
ICAO’s 2025 safety report gives global context for scheduled commercial departures in 2024.
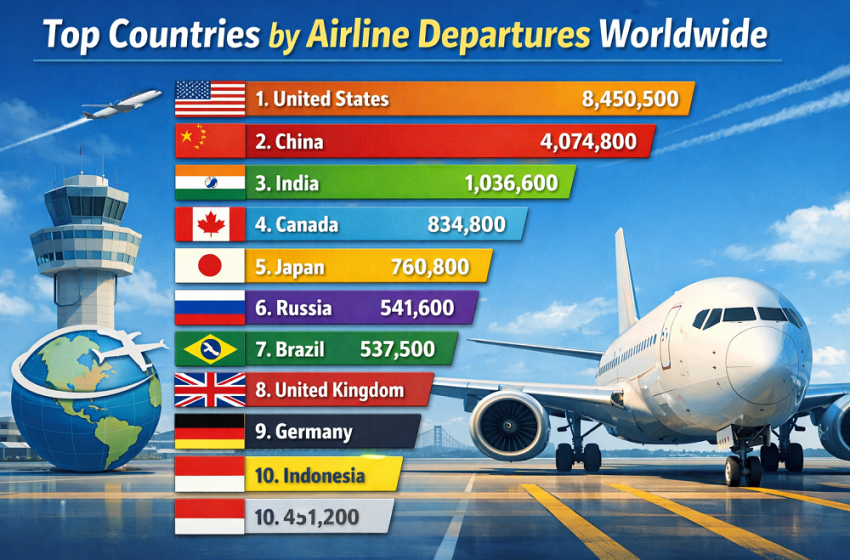
Top 10 countries by airline departures
The top of the ranking reflects several different aviation models. The United States leads because it has the world’s deepest domestic route network. China combines large scale with strong post-pandemic recovery. India continues to rise because its market is still expanding structurally, not only cyclically. Canada, Japan, Brazil, and Indonesia show how geography and network necessity can support high flight volumes even outside the very largest economies.
The U.S. remains clearly ahead because aviation is deeply embedded in domestic mobility. Multiple legacy hubs, strong low-cost competition, and dense short-haul demand all reinforce that lead.
China’s airline system now operates at very large scale. Even so, it still trails the United States by a wide margin, which shows the continuing depth of the American domestic market.
India stands out because it is still in a growth phase rather than a mature plateau. The market is expanding through rising incomes, stronger domestic tourism, and broader route development.
Canada’s position shows how strongly territory size and dispersed population centers can support aviation demand even in a country with a smaller population than India or Brazil.
Japan combines business traffic, island connectivity, and a highly structured domestic system. It remains one of the clearest examples of a mature but still very large national aviation market.
This group mixes hub-centric systems with territorially driven domestic networks. It is also where the difference between airport importance and airline-country scale becomes especially visible.
| Rank | Country | Departures per year | Average per month |
|---|---|---|---|
| 1 | United States | 9,267,000 | 772,250 |
| 2 | China | 4,909,000 | 409,083 |
| 3 | India | 1,235,000 | 102,917 |
| 4 | Canada | 1,079,000 | 89,917 |
| 5 | Japan | 976,000 | 81,333 |
| 6 | United Kingdom | 839,000 | 69,917 |
| 7 | Turkey | 810,000 | 67,500 |
| 8 | Brazil | 792,000 | 66,000 |
| 9 | Russia | 784,000 | 65,333 |
| 10 | Indonesia | 736,000 | 61,333 |
Chart 1. Top 10 countries by annual airline departures
The main visual takeaway is the size of the gap at the top. The United States is a clear first, China is a clear second, and the rest of the ranking falls into a lower-volume cluster operating at a fraction of the U.S. total.
Methodology
This ranking is built around the World Bank indicator IS.AIR.DPRT, which uses ICAO civil aviation statistics and ICAO staff estimates. The core definition is important: registered carrier departures worldwide are domestic takeoffs and takeoffs abroad of air carriers registered in the country. In other words, the indicator is tied to the nationality of the airline system, not to every flight physically leaving airports inside the country.
For a 2025 article, the strongest fact-based approach is to use the latest full official country year with broad international comparability. At the time of writing, that year is 2023 in the World Development Indicators reference period. The monthly averages shown in the table are simple annual totals divided by twelve and rounded to the nearest whole departure.
The chart and narrative use 2024 ICAO global traffic context only as background, not as a substitute ranking base. ICAO’s 2025 safety report says scheduled commercial departures reached 37.09 million globally in 2024, but it does not publish the same open, ready-to-rank country table in that report. That is why the article does not pretend to show a “final actual 2025 country leaderboard.” It uses the latest fully comparable official country ranking and explains the limit clearly.
Another limitation is your original seat-threshold idea. The public country indicator does not isolate only aircraft with more than 30 passenger seats. ICAO’s global safety context often refers to scheduled commercial operations and, in accident analysis, aircraft above 5,700 kg maximum certificated takeoff mass, but that is not the same as an exact “more than 30 seats” country ranking. So the article stays precise: this is a ranking of registered carrier departures, not a seat-threshold ranking.
Insights and interpretation
The first major insight is concentration. A small group of countries accounts for an outsized share of carrier departures because aviation is strongest where there is a combination of domestic depth, strong network carriers, major population centers, and route structures that make air travel operationally necessary. The United States is the clearest example: aviation there is not only an international connector, but also a core part of domestic transport.
The second insight is that domestic network density matters more than airport fame. The world’s most talked-about hubs do not always belong to the countries with the most carrier departures. Countries such as the United Arab Emirates are globally visible because of transit strength, long-haul connectivity, and flagship airlines. But that visibility does not automatically produce the same departure counts as giant domestic systems like the United States, China, or India.
The third insight is that geography still shapes aviation economics. Canada and Indonesia rank strongly for different reasons, but both illustrate how air travel becomes structurally embedded when populations are spread across vast distances or islands. Brazil also fits this logic. In these countries, aviation is not only about tourism or premium business traffic; it solves core connectivity problems that surface transport does not always solve efficiently.
The fourth insight is market maturity. Japan and the United Kingdom are powerful aviation systems, but they are more mature markets. India, by contrast, still has room to expand domestic penetration, airport capacity, and fleet scale. That makes India one of the most important markets to watch in the next cycle, even though the current official ranking still places it well behind the top two.
What this means for the reader
For investors, lessors, maintenance firms, and aviation software vendors, this ranking is a practical map of where the largest airline operating ecosystems actually are. More departures usually mean more demand for maintenance slots, airport handling, crew pipelines, digital dispatch tools, spare parts logistics, and route-planning support.
For travelers, the ranking helps explain why some countries give you more alternatives when things go wrong. Large departure systems usually come with denser schedules, stronger rebooking options, and more routing redundancy. That does not guarantee a better travel experience every time, but it does create more operational flexibility.
For policymakers, the ranking is a reminder that airport construction alone does not create a top-tier aviation system. The real engine is the airline base: regulation, fleet economics, domestic demand, tourism patterns, labor supply, and network profitability. A country can build terminals quickly; it takes much longer to build a durable carrier ecosystem.
FAQ
Because the United States combines several advantages at once: a huge domestic market, many large airlines, multiple hub systems, strong low-cost competition, and a route map where air travel is deeply built into normal domestic mobility. Other countries may have famous hubs, but very few have that same mix of domestic scale and flight frequency.
No. That is the key methodological distinction. The indicator counts departures operated by air carriers registered in the country, including domestic takeoffs and takeoffs abroad. It is a carrier-country measure, not a territory-of-airport measure.
Because 2023 is still the latest full official year with broad country comparability in the World Bank and ICAO reference framework. A 2025 article can still be current if it honestly uses the latest complete official ranking rather than pretending that partial or incomparable data are a final fact table.
No. It is the closest broadly comparable official country indicator, but it is not an exact seat-threshold dataset. That is why the article avoids making a stronger claim than the public data can support.
Because airport prominence and airline-country scale are different things. A hub airport can be extremely important globally while handling many flights operated by foreign carriers. This ranking only counts departures by airlines registered in that country.
Read it as a measure of the size of national airline systems. It is very useful for comparing operating scale, but it is not the right metric for airport congestion, seat supply, passenger totals, or airline profitability. Each of those questions needs a different dataset.
India is one of the most important countries to watch because it already ranks near the top globally while still having room for deeper domestic penetration, broader airport development, and continued fleet expansion. Its market story is still driven more by structural growth than by mature stability.
Sources
Core indicator page for the country-level dataset used as the ranking base.
https://data.worldbank.org/indicator/IS.AIR.DPRTOfficial definition of the indicator, source attribution to ICAO, unit of measure, and reference period through 2023.
https://databank.worldbank.org/metadataglossary/world-development-indicators/series/IS.AIR.DPRTOfficial global context showing 35.3 million scheduled departures in 2023 and high reporting coverage.
https://www.icao.int/world-air-transport-2023Global scheduled commercial departures context for 2024 and reporting notes on the scheduled commercial flights data used in the report.
https://www.icao.int/sites/default/files/sp-files/safety/Documents/ICAO_SR_2025.pdf