The Corruption Perceptions Index (CPI)
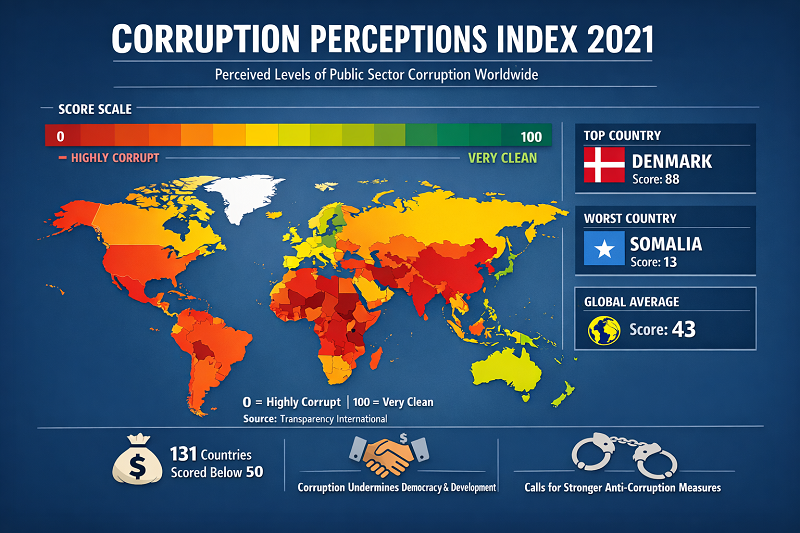
The Corruption Perceptions Index (CPI) scores 182 countries and territories on perceived public-sector corruption on a 0–100 scale (higher = cleaner). In CPI 2025, the global picture remains challenging: the global average is around the low-40s and most countries score below 50, which is consistent with long-running institutional and enforcement gaps. This page ranks the Top 100 by CPI score and adds a quick “cleanest vs. weakest” snapshot plus a chart you can scan in seconds.
Reading tip: CPI is about perception-based risk and integrity signals in the public sector. It is not a direct count of corruption cases, and it is not a measure of private-sector wrongdoing.
Top 10 cleanest (highest CPI scores)
Denmark
Finland
Singapore
New Zealand
Norway
Switzerland
Sweden
Luxembourg
Netherlands
Germany
Table — Top 10 cleanest
| Rank | Country | CPI score |
|---|---|---|
| 1 | Denmark | 89 |
| 2 | Finland | 88 |
| 3 | Singapore | 84 |
| 4 | New Zealand | 81 |
| 5 | Norway | 81 |
| 6 | Switzerland | 80 |
| 7 | Sweden | 80 |
| 8 | Luxembourg | 78 |
| 9 | Netherlands | 78 |
| 10 | Germany | 77 |
Note on ties: CPI scores are integers and ties are common. The “Top 10” list above follows score order and is meant for quick scanning.
Chart — Top 20 CPI scores (cleanest public sectors)
- Denmark — 89
- Finland — 88
- Singapore — 84
- New Zealand — 81
- Norway — 81
- Switzerland — 80
- Sweden — 80
- Luxembourg — 78
- Netherlands — 78
- Germany — 77
- Iceland — 77
- Australia — 76
- Hong Kong SAR — 76
- Ireland — 76
- Estonia — 76
- Canada — 75
- Uruguay — 73
- Bhutan — 71
- Japan — 71
- United Kingdom — 70
Bottom 10 (lowest CPI scores)
The lowest CPI scores typically cluster in conflict-affected settings and places with weakened oversight, limited accountability, or entrenched state capture. CPI does not diagnose causes, but it flags where integrity risks are most acute.
| Group | Country | CPI score |
|---|---|---|
| Bottom | South Sudan | 9 |
| Bottom | Somalia | 9 |
| Bottom | Venezuela | 10 |
| Bottom | Yemen | 13 |
| Bottom | Libya | 13 |
| Bottom | Eritrea | 13 |
| Bottom | Sudan | 14 |
| Bottom | Nicaragua | 14 |
| Bottom | Equatorial Guinea | 15 |
| Bottom | Syrian Arab Republic | 15 |
Methodology (how this ranking is built)
The CPI is produced by Transparency International and aggregates multiple expert and business assessments into a single score per country. CPI 2025 covers 182 countries and territories and reports scores on a 0–100 scale, where 0 signals a highly corrupt public sector and 100 signals a very clean one. The composite is built from a set of external data sources (e.g., risk ratings, governance and rule-of-law expert assessments), harmonised to a common scale and combined using Transparency International’s published methodology.
Practical limitations: CPI is perception-based (not a direct measurement of bribes or prosecutions), it can lag fast political changes, and it does not capture every integrity problem that matters (for example, some forms of private-sector misconduct or cross-border facilitation can sit outside what the CPI directly measures). For comparisons, treat CPI as a consistent signal rather than a precise “amount of corruption.”
Insights to notice in 2025
- The cleanest scores are concentrated among a small set of highly institutionalised economies; even within the top tier, scores can drift as enforcement and transparency standards change.
- Stagnation dominates: many countries cluster in the 30–50 range, signalling persistent governance gaps rather than one-off scandals.
- Small states can rank high because strong administrative capacity and tight oversight can be easier to enforce; this does not automatically mean “zero integrity risk.”
- Resource exporters show mixed outcomes: some achieve strong CPI scores with institutional checks, while others remain vulnerable to rent-seeking dynamics.
What this means for readers
CPI is a fast integrity-risk lens. If you are comparing countries for relocation, international contracting, market entry, or long-term investing, CPI helps you understand how “frictional” the public-sector environment may feel in practice: licensing and permits, procurement and tenders, customs and inspections, and the predictability of rules and enforcement.
The safest way to use the ranking is as a starting filter: combine CPI with rule-of-law measures, business environment indicators, and country-specific due diligence (sector rules, local enforcement history, and procurement transparency).
FAQ
Why do countries tie in the CPI?
Scores are reported as whole numbers on a 0–100 scale, and many countries end up with the same score. Ties are normal and reflect the limited resolution of the index.
Is CPI “corruption in society” or “corruption in government”?
CPI focuses on perceived corruption in the public sector. It reflects how experts and businesspeople assess public-sector integrity, not personal experiences of citizens and not private-sector crime.
Does a high CPI score mean a country has no corruption?
No. A higher score suggests stronger integrity safeguards and lower perceived public-sector corruption, but no country is “corruption-free.” The CPI also does not capture every integrity issue that matters.
Can a country’s score change quickly?
It can, but CPI often moves gradually because it is based on assessments that may lag sudden events. Big reforms, enforcement shifts, or institutional breakdowns can still show up over time.
How should I compare countries with similar CPI scores?
Use CPI as a “risk band” and then look at supporting indicators: rule-of-law, judicial independence, procurement transparency, media freedom, and sector-specific enforcement.
Where can I see the full Top 100 and a CPI vs. income scatter chart?
Go to Part 2 below: it includes a full Top 100 table with search, sort and filters, plus a scatter chart linking CPI with GDP per capita (PPP).
Top 100 Countries by CPI score (2025)
| # | Country | CPI value | YoY (pts) |
|---|---|---|---|
| 1 | Denmark | 89 | 0 |
| 2 | Finland | 88 | 0 |
| 3 | Singapore | 84 | 0 |
| 4 | New Zealand | 81 | 0 |
| 5 | Norway | 81 | 0 |
| 6 | Switzerland | 80 | 0 |
| 7 | Sweden | 80 | 0 |
| 8 | Luxembourg | 78 | -3 |
| 9 | Netherlands | 78 | 0 |
| 10 | Germany | 77 | +2 |
| 11 | Iceland | 77 | 0 |
| 12 | Australia | 76 | 0 |
| 13 | Hong Kong SAR | 76 | +2 |
| 14 | Ireland | 76 | 0 |
| 15 | Estonia | 76 | 0 |
| 16 | Canada | 75 | 0 |
| 17 | Uruguay | 73 | -3 |
| 18 | Bhutan | 71 | 0 |
| 19 | Japan | 71 | 0 |
| 20 | United Kingdom | 70 | 0 |
| 21 | Austria | 69 | 0 |
| 22 | Belgium | 69 | 0 |
| 23 | United Arab Emirates | 69 | 0 |
| 24 | Barbados | 68 | 0 |
| 25 | Seychelles | 68 | 0 |
| 26 | Taiwan | 68 | 0 |
| 27 | France | 66 | 0 |
| 28 | Lithuania | 65 | +2 |
| 29 | Bahamas | 64 | 0 |
| 30 | United States | 64 | 0 |
| 31 | Brunei Darussalam | 63 | 0 |
| 32 | Saint Vincent and the Grenadines | 63 | 0 |
| 33 | Chile | 63 | 0 |
| 34 | South Korea | 63 | 0 |
| 35 | Israel | 62 | 0 |
| 36 | Cabo Verde | 62 | 0 |
| 37 | Dominica | 60 | 0 |
| 38 | Latvia | 60 | 0 |
| 39 | Saint Lucia | 59 | 0 |
| 40 | Czechia | 59 | +3 |
| 41 | Botswana | 58 | 0 |
| 42 | Qatar | 58 | 0 |
| 43 | Rwanda | 58 | 0 |
| 44 | Slovenia | 58 | 0 |
| 45 | Saudi Arabia | 57 | 0 |
| 46 | Grenada | 56 | 0 |
| 47 | Costa Rica | 56 | 0 |
| 48 | Portugal | 56 | 0 |
| 49 | Spain | 55 | 0 |
| 50 | Cyprus | 55 | 0 |
| 51 | Fiji | 55 | 0 |
| 52 | Italy | 53 | 0 |
| 53 | Poland | 53 | 0 |
| 54 | Malaysia | 52 | 0 |
| 55 | Oman | 52 | -3 |
| 56 | Bahrain | 50 | -3 |
| 57 | Greece | 50 | 0 |
| 58 | Georgia | 50 | 0 |
| 59 | Jordan | 50 | 0 |
| 60 | Malta | 49 | 0 |
| 61 | Mauritius | 48 | 0 |
| 62 | Slovakia | 48 | 0 |
| 63 | Vanuatu | 47 | 0 |
| 64 | Croatia | 47 | 0 |
| 65 | Armenia | 46 | 0 |
| 66 | Kuwait | 46 | 0 |
| 67 | Namibia | 46 | 0 |
| 68 | Senegal | 46 | 0 |
| 69 | Montenegro | 46 | 0 |
| 70 | Benin | 45 | 0 |
| 71 | Romania | 45 | 0 |
| 72 | Sao Tome and Principe | 45 | 0 |
| 73 | Timor-Leste | 44 | 0 |
| 74 | Solomon Islands | 44 | 0 |
| 75 | Jamaica | 44 | 0 |
| 76 | Ghana | 43 | 0 |
| 77 | China | 43 | 0 |
| 78 | Kosovo | 43 | 0 |
| 79 | Côte d’Ivoire | 43 | 0 |
| 80 | Moldova | 42 | 0 |
| 81 | Vietnam | 41 | 0 |
| 82 | Trinidad and Tobago | 41 | 0 |
| 83 | South Africa | 41 | 0 |
| 84 | Bulgaria | 40 | 0 |
| 85 | Burkina Faso | 40 | 0 |
| 86 | Hungary | 40 | 0 |
| 87 | Guyana | 40 | 0 |
| 88 | Cuba | 40 | 0 |
| 89 | North Macedonia | 40 | 0 |
| 90 | Tanzania | 40 | 0 |
| 91 | Albania | 39 | 0 |
| 92 | India | 39 | 0 |
| 93 | Maldives | 39 | 0 |
| 94 | Morocco | 39 | 0 |
| 95 | Tunisia | 39 | 0 |
| 96 | Kazakhstan | 38 | 0 |
| 97 | Suriname | 38 | 0 |
| 98 | Ethiopia | 38 | 0 |
| 99 | Gambia | 37 | 0 |
| 100 | Dominican Republic | 37 | 0 |
CPI vs GDP per capita (PPP): do richer countries score cleaner?
Supporting page (PPP incomes): Top 100 Economies by GDP per Capita (PPP), 2025
The scatter below pairs CPI score (vertical axis) with GDP per capita (PPP, thousands of international dollars; horizontal axis) for a selection of countries that appear in both lists. The relationship is not “automatic”: income levels correlate with stronger institutions on average, but there are meaningful outliers.
- Singapore — (132.6; 84)
- Denmark — (73.7; 89)
- United States — (75.5; 64)
- Germany — (62.8; 77)
- Finland — (55.6; 88)
- United Kingdom — (52.5; 70)
- Japan — (46.1; 71)
- Poland — (45.1; 53)
- China — (23.8; 43)
- Ukraine — (16.3; 36)
- Indonesia — (14.5; 34)
How to interpret CPI rankings (without over-reading them)
CPI is best read as an integrity “risk map” for the public sector. At the top of the ranking, countries tend to combine strong audit and procurement systems, predictable enforcement, and professional civil services. In the middle of the distribution, outcomes are often mixed: some agencies may be clean and capable, while procurement, licensing or local government can remain vulnerable to favoritism and informal payments. At the bottom, the risk typically becomes systemic: weak oversight, limited accountability, and politicised enforcement can make rules unpredictable and raise the cost of doing business.
Use the ranking as a first filter, then validate with country-specific evidence: procurement transparency, judicial independence, media freedom, and enforcement track record in your sector.
Policy takeaways (what consistently moves CPI over time)
- Independent enforcement matters: anti-corruption agencies, prosecutors, and courts must be able to investigate and sanction without political interference.
- Transparent public money is core: open contracting, audit capacity, beneficial ownership transparency, and clear conflict-of-interest rules reduce capture risks.
- Civic space and scrutiny correlate with better outcomes: protections for journalists, watchdog organisations, and access to information raise the cost of abuse of power.
- Procurement is the battleground in many countries: digital tendering, competitive procedures, and publish-by-default documentation can reduce discretion.
- Cross-border integrity matters: strong domestic scores can coexist with weak controls that enable laundering or offshore secrecy elsewhere.
How CPI connects to income (the scatter chart message)
The CPI vs GDP per capita (PPP) scatter typically slopes upward: higher-income countries often have stronger institutions, more administrative capacity, and more predictable enforcement. But the relationship is not deterministic. Some countries achieve relatively strong integrity signals at modest income levels, while others remain stuck with low CPI scores despite substantial economic scale. The most actionable reading is to treat institutional quality as a separate pillar of development, not as an automatic by-product of growth.
Sources
-
Transparency International — Corruption Perceptions Index 2025 (CPI page).
https://www.transparency.org/en/cpi/2025 -
Transparency International — CPI 2025 press release (global findings).
https://www.transparency.org/en/press/corruption-perceptions-index-2025-decline-leadership-undermining-global-fight -
Transparency International — CPI 2025 source description (methodology components).
https://transparencia.org.es/wp-content/uploads/CPI2025_SourceDescription.pdf -
StatRanker supporting page — GDP per capita (PPP) Top 100 (2025 snapshot; 2024 proxy).
https://statranker.org/economy/top-100-economies-by-gdp-per-capita-ppp-2025-full-country-ranking/ -
World Bank — GDP per capita, PPP (current international $) indicator (reference series used in the PPP page sources).
https://data.worldbank.org/indicator/NY.GDP.PCAP.PP.CD