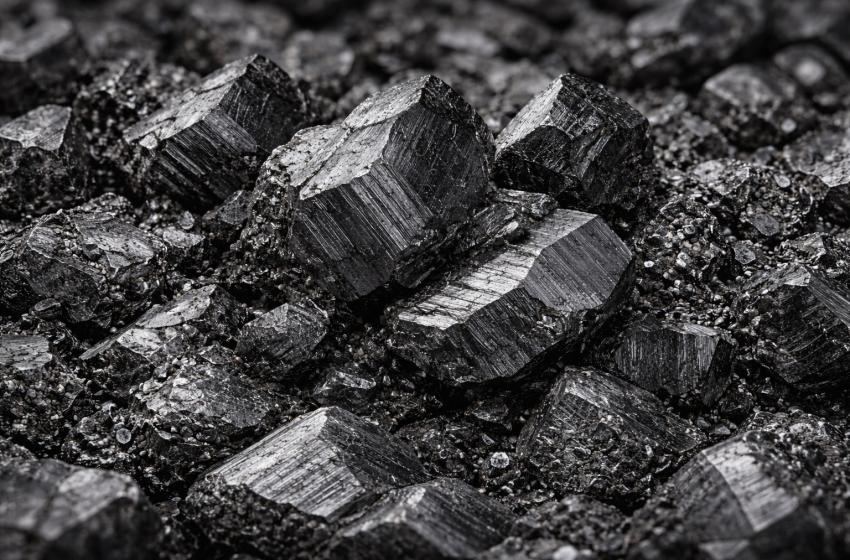
Top 30 Countries by Natural Graphite Mine Production, 2025
This ranking summarizes natural graphite mine output by country using the latest USGS 2024e estimates. Values are shown in kilotons (kt), where 1 kt = 1,000 metric tons. For batteries, graphite matters not only by tonnage, but also by grade and downstream processing capacity.
| Rank | Country | Production (kt) |
|---|---|---|
| 1 | China | 1,270.0 |
| 2 | Madagascar | 89.0 |
| 3 | Mozambique | 75.0 |
| 4 | Brazil | 68.0 |
| 5 | India | 27.8 |
| 6 | Tanzania | 25.0 |
| 7 | Canada | 20.0 |
| 8 | Russia | 20.0 |
| 9 | Korea, Republic of | 9.6 |
| 10 | Korea, North | 8.1 |
What the data suggests about supply concentration
The distribution is highly skewed. China dominates mined natural graphite, while the next producers form a much smaller second tier. In the latest USGS estimates (2024e), China’s output is on the order of ~1.27 Mt, whereas the next countries are below 0.1 Mt.
A visible pattern is the emergence of a compact group of mid-scale producers (Madagascar, Mozambique, Brazil, India, Tanzania), which can matter for diversification but does not remove the overall supply concentration at the top.
Another key point is that tonnage ≠ battery readiness. Battery anodes typically require consistent flake quality and downstream purification/spheronization. Mine output is a starting point in the value chain, not a full indicator of usable anode material supply.
| Rank | Country | Production (kt) |
|---|---|---|
| 1 | China | 1,270.0 |
| 2 | Madagascar | 89.0 |
| 3 | Mozambique | 75.0 |
| 4 | Brazil | 68.0 |
| 5 | India | 27.8 |
| 6 | Tanzania | 25.0 |
| 7 | Canada | 20.0 |
| 8 | Russia | 20.0 |
| 9 | Korea, Republic of | 9.6 |
| 10 | Korea, North | 8.1 |
| 11 | Norway | 7.0 |
| 12 | Sri Lanka | 3.3 |
| 13 | Turkey | 3.1 |
| 14 | Vietnam | 2.0 |
| 15 | Ukraine | 1.2 |
| 16 | Mexico | 0.9 |
| 17 | Austria | 0.5 |
| 18 | Germany | 0.17 |
How to interpret the ranking
Natural graphite is a strategic input into a broad industrial stack: traditional refractories and steelmaking, plus a fast-growing demand channel tied to battery anodes. The ranking highlights how mine supply is concentrated, which can influence trade exposure and the resilience of downstream manufacturing.
The reserve base is more distributed than short-run output. Countries with substantial reserves but lower current production can represent potential future supply, but realizing that potential depends on investment, permitting, logistics, and processing pathways.
For markets and policy discussions, mine output should be read alongside processing capacity and product specifications. A country can rank highly in mining yet still export concentrate that must be upgraded elsewhere to reach battery-grade material.
Concentration snapshot (derived from the same country list)
Policy takeaway
- Mine supply is highly concentrated, with one country dominating current output.
- Diversification depends on scaling mid-tier producers and improving logistics and permitting certainty.
- Reserves indicate potential supply, but development timelines and processing constraints shape realized output.
- Downstream capability (purification, spheronization, coating) can be as important as mining tonnage for batteries.
- Monitoring should track both mining and processing, plus trade restrictions and quality segmentation (flake vs amorphous).
Primary data sources and technical notes
- USGS Mineral Commodity Summaries (January 2025): country mine production (2023, 2024e) and reserves for natural graphite. https://pubs.usgs.gov/periodicals/mcs2025/mcs2025-graphite.pdf
- USGS Mineral Commodity Summaries (January 2024): background notes and earlier year context for natural graphite. https://pubs.usgs.gov/periodicals/mcs2024/mcs2024-graphite.pdf
- USGS Minerals Yearbook (Graphite, 2022): longer-form industry context and historical tables for natural graphite. https://pubs.usgs.gov/myb/vol1/2022/myb1-2022-graphite.pdf
- British Geological Survey (World Mineral Production 2019–2023): supplemental context on reported production series and definitions. https://nora.nerc.ac.uk/id/eprint/539285/1/WMP_2019-2023_COMPLETE.pdf
Download: Data tables & charts (Graphite Mine Production, 2025)
ZIP archive with CSV/XLSX tables and PNG chart images used in this page.
⬇ Download ZIPgraphite_mine_production_2025_assets.zip