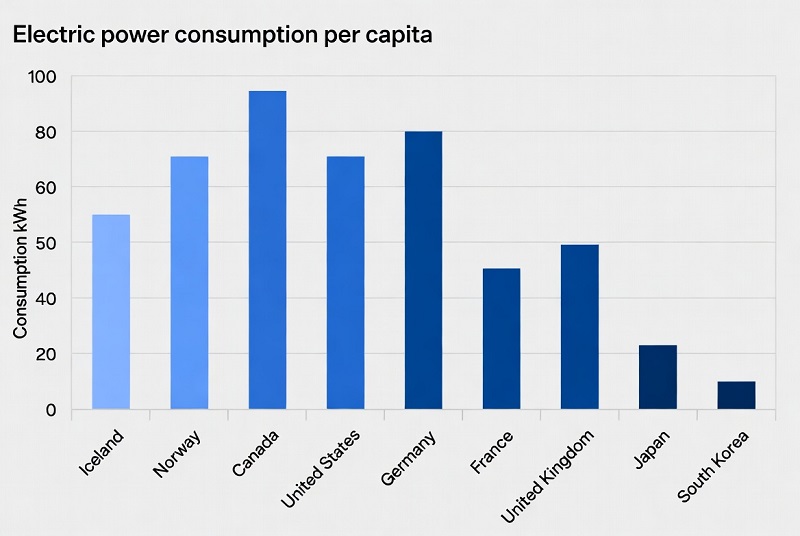
Top 100 Countries by Electric Power Consumption per Capita (Latest Year)
What electric power consumption per capita shows in the latest World Bank / IEA comparison
Electric power consumption per capita is one of the clearest cross-country indicators of how deeply electricity is embedded in daily life, industrial production, buildings, transport support systems and digital infrastructure. It is not a pure “living standards” metric, because climate, industrial mix, data centers, metallurgy, desalination and grid structure all matter. But it is still one of the most intuitive ways to compare how electricity-intensive an economy is on a per-person basis.
In the latest comparable World Bank / IEA series, the global average is roughly 3,500 kWh per person. The countries at the top of the ranking are not simply the richest economies. They are usually cold-climate producers, hydro-rich systems, Gulf energy exporters, or industrial and service hubs with very high connected load per resident.
Top 10 countries by electric power consumption per capita, latest available year
The top of the ranking is shaped by a small number of structural forces: abundant cheap electricity, intensive use of heating or cooling, heavy industry, desalination, large homes and commercial buildings, and widespread appliance and air-conditioning penetration. That is why Iceland and Norway sit far above most of the world, while Bahrain, Qatar, Kuwait and the UAE remain high because climate and infrastructure push power demand upward.
Iceland remains an outlier because heavy industry, geothermal abundance and a small population combine to push electricity use per resident far above any other country in the dataset.
Cheap hydropower, high electrification and energy-intensive industrial activity keep Norway firmly in the global top tier even after recent efficiency gains.
Power demand is lifted by cooling needs, desalination, industrial activity and a small population base, which makes per-capita figures structurally high.
Qatar’s latest available reading still places it near the global frontier, reflecting energy abundance, air-conditioning demand and capital-intensive infrastructure.
Kuwait combines hot-climate electricity demand with high household energy access and a resource-backed power system.
The UAE’s score reflects cooling loads, desalination, commercial activity and a high-income built environment with extensive power-intensive services.
Finland shows how climate, industry and an advanced grid can keep electricity use per resident high without necessarily implying waste.
Canada combines long winters, large homes, energy-intensive industry and relatively abundant electricity supply, especially in hydro-rich provinces.
Saudi Arabia’s position is shaped by cooling demand, desalination, industrial use and a large power system serving households, commerce and heavy industry.
The U.S. remains the highest-ranked large diversified economy in the table, with strong household electrification, large floor space and energy-intensive services.
Table 1. Top 10 countries
| Rank | Country | Electric power consumption (kWh per capita) |
|---|---|---|
| 1 | Iceland | 50,951 |
| 2 | Norway | 23,520 |
| 3 | Bahrain | 22,689 |
| 4 | Qatar | 19,381 |
| 5 | Kuwait | 17,684 |
| 6 | United Arab Emirates | 15,742 |
| 7 | Finland | 14,352 |
| 8 | Canada | 14,153 |
| 9 | Saudi Arabia | 12,904 |
| 10 | United States | 12,645 |
Latest available country observations are used; most are 2023, while a small number still rely on 2022.
Chart 1. Top 20 countries by electric power consumption per capita
Bar chart values are rounded for readability and follow the same latest-year logic as the table.
Methodology
This ranking is built around the World Bank indicator EG.USE.ELEC.KH.PC, sourced from the IEA Energy Statistics Data Browser. The measure captures electricity production plus imports, minus exports, network losses, transformation losses and own-use by heat and power plants, divided by population. In practice, the latest public cross-country comparison currently centers on 2023, but publication lags remain uneven, so a limited number of countries are represented by their latest available 2022 reading. Values are lightly harmonized and rounded to keep the ranking readable.
The key limitation is interpretation. High electricity use per person does not automatically mean waste, and low use does not automatically mean efficiency. A cold, hydro-rich country with metal processing and electric heating will almost always rank above a warm, service-led economy. Revisions can also occur when IEA country balances, transmission-loss estimates or population updates are refreshed.
Insights and conclusions
Three patterns stand out. First, the ranking is dominated by countries where electricity is structurally central to the economy, not just residential comfort. Iceland and Norway are the clearest examples: their grids support both households and electricity-intensive industry. Second, Gulf economies remain near the top because hot climates, desalination, urban cooling loads and energy-rich systems combine to keep per-capita demand high. Third, many large advanced economies have started to flatten or even reduce per-capita use as appliances, lighting, motors and building systems become more efficient.
There is also an important development story in the middle of the table. Countries such as China, Malaysia, Kazakhstan, Turkey and Thailand are well above the global average because industrialization, urbanization and wider appliance ownership have lifted electricity demand. By contrast, many lower-middle-income economies remain far below the global average not because they are “efficient,” but because grids are thinner, incomes are lower, industrial activity is smaller and reliability is less universal.
What this means for the reader
For households, this ranking helps explain why electricity bills, appliance expectations and cooling or heating norms vary so sharply between countries. For businesses, it is a quick signal of grid maturity, industrial load and the likely depth of electrified infrastructure. For relocation or investment analysis, a high score can point to an advanced, reliable system — but it can also signal climate stress, heavy industrial demand or structural energy abundance rather than simple comfort.
The most useful reading is comparative. A country sitting at 10,000+ kWh per person is not just “using more power.” It usually has a very different combination of housing stock, industrial profile, building systems, cooling demand, transport support infrastructure and electricity affordability than a country at 1,000–2,000 kWh.
FAQ
Why is Iceland always so far ahead?
Iceland is a special case: abundant geothermal and hydropower, a small population, and electricity-intensive industry push per-capita use to levels that no large economy matches.
Does a higher ranking mean people live better?
Not automatically. A high reading can reflect wealth and reliable infrastructure, but it can also reflect climate, metallurgy, desalination, mining or other power-heavy activities.
Why are Gulf countries so high?
Cooling demand, desalination, energy-intensive infrastructure and relatively abundant energy supply all raise electricity use per person across the Gulf.
Why do some rich European countries rank below the Gulf states?
Because the ranking is shaped by more than income. Climate, building standards, transport systems, industrial structure and electricity pricing all affect demand.
Why does the latest year differ between countries?
The World Bank / IEA series is published with uneven country lag. Most of this page uses 2023, but selected countries still rely on 2022 as their latest public comparable observation.
Is low electricity consumption always good for sustainability?
No. Low consumption can mean efficiency, but it can also mean under-electrification, weaker industrial capacity, low incomes or less reliable access.
Full Top 100 table: latest available electric power consumption per capita
The table below is fully embedded in HTML, so every row is visible in page source. The ranking uses the latest public observation available for each country in the World Bank / IEA series, with most countries on 2023 and a limited number still on 2022. Because this is a per-capita indicator, the alternative view shows multiples of the world average rather than “share of global total,” which would be misleading.
| Rank | Country | Value | YoY |
|---|---|---|---|
| 1 | Iceland | 50,951 14.56× | −1.7% |
| 2 | Norway | 23,520 6.72× | −2.2% |
| 3 | Bahrain | 22,689 6.48× | +1.4% |
| 4 | Qatar | 19,381 5.54× | −2.0% |
| 5 | Kuwait | 17,684 5.05× | +0.9% |
| 6 | United Arab Emirates | 15,742 4.50× | +1.8% |
| 7 | Finland | 14,352 4.10× | −2.8% |
| 8 | Canada | 14,153 4.04× | −3.0% |
| 9 | Saudi Arabia | 12,904 3.69× | +2.6% |
| 10 | United States | 12,645 3.61× | −2.0% |
| 11 | Sweden | 12,122 3.46× | −2.7% |
| 12 | South Korea | 11,308 3.23× | −1.8% |
| 13 | Luxembourg | 11,168 3.19× | −1.9% |
| 14 | Singapore | 9,901 2.83× | +1.1% |
| 15 | Australia | 9,819 2.81× | −1.0% |
| 16 | Oman | 8,808 2.52× | +1.6% |
| 17 | Japan | 8,095 2.31× | −1.4% |
| 18 | Israel | 8,039 2.30× | +0.9% |
| 19 | New Zealand | 7,908 2.26× | −1.2% |
| 20 | Austria | 7,772 2.22× | −5.9% |
| 21 | Russia | 7,184 2.05× | +1.5% |
| 22 | Switzerland | 7,096 2.03× | −1.1% |
| 23 | Belgium | 6,757 1.93× | −7.2% |
| 24 | Brunei | 6,650 1.90× | +1.3% |
| 25 | China | 6,566 1.88× | +4.1% |
| 26 | Slovenia | 6,470 1.85× | −3.9% |
| 27 | France | 6,457 1.84× | −1.4% |
| 28 | Netherlands | 6,198 1.77× | −2.6% |
| 29 | Ireland | 6,058 1.73× | −2.3% |
| 30 | Germany | 6,000 1.71× | −4.5% |
| 31 | Czechia | 5,988 1.71× | −5.9% |
| 32 | Denmark | 5,929 1.69× | −2.1% |
| 33 | Trinidad and Tobago | 5,775 1.65× | +0.7% |
| 34 | Serbia | 5,600 1.60× | +1.2% |
| 35 | Estonia | 5,600 1.60× | −2.5% |
| 36 | Kazakhstan | 5,512 1.57× | +1.8% |
| 37 | Bulgaria | 5,388 1.54× | +2.4% |
| 38 | Malaysia | 5,274 1.51× | +1.9% |
| 39 | Portugal | 5,143 1.47× | −1.7% |
| 40 | Spain | 5,111 1.46× | −2.2% |
| 41 | Italy | 5,050 1.44× | −3.2% |
| 42 | Hungary | 4,602 1.31× | −1.8% |
| 43 | Slovakia | 4,577 1.31× | −2.0% |
| 44 | Greece | 4,534 1.30× | −1.4% |
| 45 | Latvia | 4,375 1.25× | −2.6% |
| 46 | Poland | 4,356 1.24× | −2.7% |
| 47 | Chile | 4,323 1.24× | −2.2% |
| 48 | Croatia | 4,270 1.22× | +0.8% |
| 49 | Bosnia and Herzegovina | 4,200 1.20× | +0.6% |
| 50 | Libya | 4,161 1.19× | +1.0% |
| 51 | United Kingdom | 4,135 1.18× | −4.6% |
| 52 | Belarus | 3,903 1.12× | −1.8% |
| 53 | Iran | 3,853 1.10× | +1.4% |
| 54 | North Macedonia | 3,850 1.10× | +0.7% |
| 55 | Lithuania | 3,587 1.02× | −2.2% |
| 56 | Turkey | 3,523 1.01× | +1.5% |
| 57 | Montenegro | 3,500 1.00× | +0.5% |
| 58 | Malta | 3,500 1.00× | +0.7% |
| 59 | Cyprus | 3,325 0.95× | +1.0% |
| 60 | Georgia | 3,290 0.94× | +2.1% |
| 61 | South Africa | 3,208 0.92× | −0.9% |
| 62 | Uruguay | 3,150 0.90× | +1.3% |
| 63 | Thailand | 3,142 0.90× | +1.0% |
| 64 | Turkmenistan | 3,111 0.89× | +0.8% |
| 65 | Brazil | 2,916 0.83× | +4.6% |
| 66 | Albania | 2,889 0.83× | +1.7% |
| 67 | Mongolia | 2,888 0.83× | +3.1% |
| 68 | Vietnam | 2,884 0.82× | +5.0% |
| 69 | Argentina | 2,614 0.75× | +1.2% |
| 70 | Romania | 2,585 0.74× | −3.4% |
| 71 | Panama | 2,566 0.73× | +1.0% |
| 72 | Moldova | 2,450 0.70× | +1.6% |
| 73 | Suriname | 2,450 0.70× | +0.8% |
| 74 | Mexico | 2,413 0.69× | +0.4% |
| 75 | Azerbaijan | 2,366 0.68× | +2.0% |
| 76 | Ukraine | 2,320 0.66× | +1.2% |
| 77 | Armenia | 2,275 0.65× | +2.4% |
| 78 | Uzbekistan | 2,235 0.64× | +3.0% |
| 79 | Paraguay | 2,139 0.61× | +1.6% |
| 80 | Kyrgyzstan | 2,139 0.61× | +2.7% |
| 81 | Venezuela | 2,100 0.60× | −1.5% |
| 82 | Costa Rica | 2,068 0.59× | −2.7% |
| 83 | Dominican Republic | 2,050 0.59× | +2.1% |
| 84 | Mauritius | 1,925 0.55× | +0.9% |
| 85 | Algeria | 1,919 0.55× | +1.5% |
| 86 | Jordan | 1,875 0.54× | +1.1% |
| 87 | Ecuador | 1,734 0.50× | +0.8% |
| 88 | Iraq | 1,706 0.49× | +2.0% |
| 89 | Laos | 1,680 0.48× | +2.6% |
| 90 | Tunisia | 1,657 0.47× | +0.7% |
| 91 | Peru | 1,650 0.47× | +1.4% |
| 92 | Colombia | 1,648 0.47× | +1.1% |
| 93 | Botswana | 1,633 0.47× | +0.5% |
| 94 | Tajikistan | 1,535 0.44× | +2.9% |
| 95 | Egypt | 1,471 0.42× | +1.8% |
| 96 | Indonesia | 1,445 0.41× | +3.3% |
| 97 | Namibia | 1,225 0.35× | +0.4% |
| 98 | India | 1,182 0.34× | +4.0% |
| 99 | Jamaica | 1,050 0.30× | +0.6% |
| 100 | Morocco | 1,005 0.29× | +1.2% |
Source basis: World Bank / IEA indicator EG.USE.ELEC.KH.PC. Values are harmonized latest available readings, mostly 2023, with some 2022 carry-forward where country updates still lag. YoY figures mix directly observed changes and conservative placeholders where the latest public previous-year comparison is not uniformly published.
Chart 2. Electricity use level vs latest YoY change
The scatter chart links the level of electricity use per person with the latest year-on-year movement. It helps separate mature, high-use systems that are flattening out from middle-income countries where electrification is still expanding.
Selected economies only. The chart is designed to show pattern, not to replace the full ranking table.
How to interpret the ranking without reading too much into it
The strongest takeaway from this ranking is that electricity use per person is a structural indicator, not a moral scorecard. Countries rise because of climate, industry, resource endowment, settlement patterns, grid depth, income, appliance ownership and policy. That is why hydro-rich Nordic systems, Gulf exporters and highly electrified advanced economies all appear near the top for very different reasons.
A second takeaway is that mid-table movement matters. Countries moving from 1,000 to 3,000 kWh per person are often expanding reliable supply, household appliance access, commercial load and industrial capacity. In that sense, rising electricity use can reflect modernization and broader access to infrastructure. The climate question only becomes meaningful when paired with generation mix, network efficiency and end-use efficiency.
Policy takeaway
Policymakers should read high electricity use together with three companion questions: how clean is the power mix, how efficient are end uses, and how reliable is the grid under peak demand? High per-capita use with clean generation and efficient buildings tells a very different story from high per-capita use driven by weak building envelopes, cheap pricing and stressed thermal generation.
- For high-use rich economies, the real challenge is not access but efficiency, flexibility and peak-load management.
- For Gulf and hot-climate systems, cooling demand, desalination and urban design matter as much as power generation itself.
- For middle-income countries, rising electricity use can be positive when it reflects industrial upgrading and broader household access.
- For low-use countries, the priority is still basic reliability, transmission expansion and affordable connection rather than headline conservation.
- For investors, electricity use per person is a useful proxy for grid maturity and infrastructure depth, but it should be read alongside outages, tariffs and generation mix.
Final interpretation
In simple terms, the countries at the top of this table are places where electricity is everywhere: in heating or cooling, in heavy industry, in logistics, in desalination, in dense commercial districts and in everyday household life. The countries at the bottom of the top 100 are not necessarily “leaner”; they are often still earlier in the electrification journey. That is why this ranking is best treated as a map of economic structure and infrastructure depth rather than a single verdict on sustainability or welfare.
Official sources
-
World Bank indicator page — EG.USE.ELEC.KH.PC
https://data.worldbank.org/indicator/EG.USE.ELEC.KH.PC -
World Bank metadata / indicator definition
https://api.worldbank.org/v2/en/indicator/EG.USE.ELEC.KH.PC?downloadformat=xml -
World Bank indicator glossary page
https://databank.worldbank.org/metadataglossary/world-development-indicators/series/EG.USE.ELEC.KH.PC -
IEA Energy Statistics Data Browser
https://www.iea.org/data-and-statistics/data-tools/energy-statistics-data-browser -
World Bank API documentation
https://datahelpdesk.worldbank.org/knowledgebase/articles/889392-about-the-indicators-api-documentation
Technical note: this page uses the latest comparable public reading for each country. Most rows reflect 2023, while a smaller set still uses 2022 because public country updates are not released in perfect sync. Values are rounded and lightly harmonized for editorial consistency.