

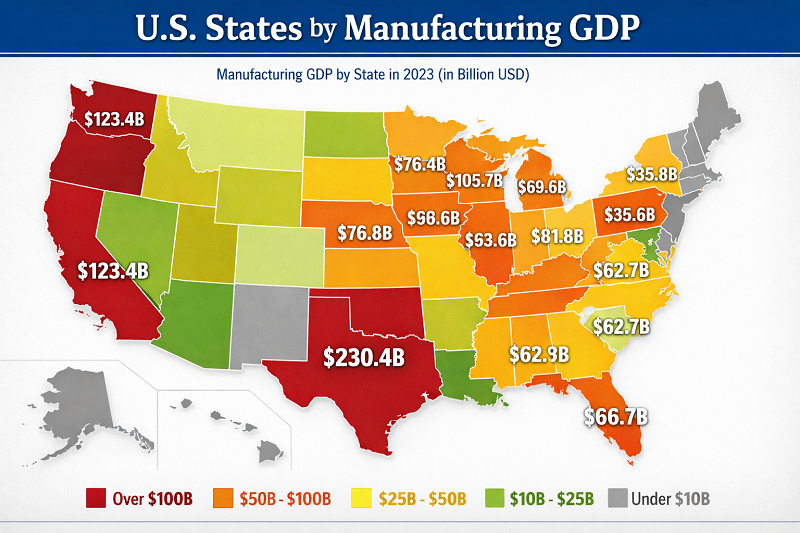
Top 50 U.S. States by Manufacturing GDP
Manufacturing GDP by state: where real output is concentrated (latest year: 2024)
Manufacturing GDP is a value-added measure: the inflation-adjusted contribution of manufacturing industries (NAICS 31–33) to each state economy. In this snapshot, the latest annual year shown in the source ranking is 2024. Values are reported in the source as “$000,000 (millions) of chained 2017 dollars” and are converted here to billions for readability.
Shares on this page are calculated as each state’s value divided by the published total above. One state (Wyoming) is not shown in the source rank table for this industry-year combination; where a value is not published, it is treated as suppressed rather than zero.
Top 10 snapshot
Top 10 table (real manufacturing GDP, 2024)
Units are billions of chained 2017 dollars. “Share” is each state’s share of the published total (2,375.9 B).
| Rank | State | Manufacturing GDP (B) | Share |
|---|---|---|---|
| 1 | California | 347.5 | 14.63% |
| 2 | Texas | 239.3 | 10.07% |
| 3 | Indiana | 119.4 | 5.03% |
| 4 | Illinois | 110.7 | 4.66% |
| 5 | Ohio | 109.8 | 4.62% |
| 6 | Michigan | 99.2 | 4.18% |
| 7 | Pennsylvania | 88.5 | 3.73% |
| 8 | North Carolina | 87.6 | 3.69% |
| 9 | New York | 73.5 | 3.09% |
| 10 | Georgia | 69.2 | 2.91% |
Chart: Top 20 states by manufacturing GDP (2024)
The chart shows published values only. If the chart does not render, a text fallback is displayed.
Fallback (Top 5 by real manufacturing GDP, 2024):
California 347.5B · Texas 239.3B · Indiana 119.4B · Illinois 110.7B · Ohio 109.8B
Published total (49 states): 2,375.9B. Top 20 share: 78.66%.
Practical reading: a high rank reflects scale and value-added intensity. It does not directly measure factory employment, shipments, or the number of plants.
Methodology
The ranking uses state-level real GDP by industry for manufacturing (NAICS 31–33). “Real” here means BEA’s chained 2017 dollars, a chain-type quantity index expressed in dollar terms for interpretability. The source table reports values in millions of chained 2017 dollars ($000,000). For this page, the values are converted to billions by dividing by 1,000 and rounded to one decimal in the visuals and tables.
State shares are computed as value / published total × 100, where the published total is the sum of all states with reported values for this industry-year combination (2,375.9B). If a state is missing from the published ranking table, the most likely explanation is disclosure protection in the underlying tabulation for that specific industry-state-year cell; the missing value is treated as “suppressed” rather than assumed to be zero.
Limitations matter. Chained-dollar series are designed for comparing real output across time, but additivity is not perfect across detailed categories. Manufacturing GDP is value added, not sales: it excludes intermediate inputs and captures the net contribution of manufacturing to GDP. Finally, modern supply chains span multiple states; a plant, suppliers, and engineering services can sit in different places, so “where output is booked” should not be read as “where every part of the value chain lives.”
Key insights from the ranking
The distribution is steep at the top. The top five states account for about 39.00% of the published manufacturing total, and the top twenty reach 78.66%. That concentration is a mix of sheer economic scale and deep industrial clustering: autos and suppliers, aerospace, chemicals, energy-intensive processing, and advanced electronics all create large value-added footprints when they co-locate with supplier networks and skilled labor.
A second pattern is the coexistence of “large diversified economies” and “specialized manufacturing states.” California and Texas lead partly because of scale, but several Midwestern states rank unusually high relative to population because of dense tradable-sector ecosystems. Across the published states, the median value is about 35.2B, while the middle half of the distribution spans roughly 13.6B to 56.2B.
Manufacturing size and manufacturing dependence are different. This table is “where output is,” not “where manufacturing dominates the whole economy.” For that second question, a complementary view would divide manufacturing GDP by total state GDP to measure manufacturing intensity.
What this means for readers
For supply-chain and industrial strategy, manufacturing GDP is a practical signal of where complex production ecosystems are already thick: places with experienced vendors, specialized maintenance and engineering services, freight capacity, and a workforce that has “learned by doing” across multiple cycles.
For workforce planning, it helps identify states where technical skills and plant-support occupations are likely to be in persistent demand. For policy and regional development, it is a grounded way to discuss cluster readiness: permitting, utilities, logistics reliability, and training pipelines often matter more than incentive headlines when projects choose among multiple locations.
Full table (all states) + interactive tools
Use the tools to quickly find a state, filter by Census region, and switch the value column between levels (billions of chained 2017 dollars) and share of the published total. Without JavaScript, the table remains fully visible and sorted by rank.
Published total (49 states): 2,375.9B (chained 2017 dollars). Share values are computed as state value divided by this published total. One state (Wyoming) is marked as n/a (suppressed) because the source ranking table does not publish a value for that cell.
| Rank | State | Region | Value |
|---|---|---|---|
| 1 | California | West | 347.5 B 14.63% |
| 2 | Texas | South | 239.3 B 10.07% |
| 3 | Indiana | Midwest | 119.4 B 5.03% |
| 4 | Illinois | Midwest | 110.7 B 4.66% |
| 5 | Ohio | Midwest | 109.8 B 4.62% |
| 6 | Michigan | Midwest | 99.2 B 4.18% |
| 7 | Pennsylvania | Northeast | 88.5 B 3.73% |
| 8 | North Carolina | South | 87.6 B 3.69% |
| 9 | New York | Northeast | 73.5 B 3.09% |
| 10 | Georgia | South | 69.2 B 2.91% |
| 11 | Florida | South | 64.6 B 2.72% |
| 12 | Tennessee | South | 58.6 B 2.47% |
| 13 | New Jersey | Northeast | 57.9 B 2.44% |
| 14 | Wisconsin | Midwest | 56.2 B 2.36% |
| 15 | Washington | West | 55.7 B 2.35% |
| 16 | Massachusetts | Northeast | 52.8 B 2.22% |
| 17 | Minnesota | Midwest | 46.3 B 1.95% |
| 18 | Louisiana | South | 45.3 B 1.90% |
| 19 | Virginia | South | 44.4 B 1.87% |
| 20 | Missouri | Midwest | 42.6 B 1.79% |
| 21 | Alabama | South | 41.9 B 1.76% |
| 22 | Kentucky | South | 39.6 B 1.66% |
| 23 | Arizona | West | 39.2 B 1.65% |
| 24 | South Carolina | South | 37.5 B 1.58% |
| 25 | Iowa | Midwest | 35.2 B 1.48% |
| 26 | Connecticut | Northeast | 34.2 B 1.44% |
| 27 | Oregon | West | 33.1 B 1.39% |
| 28 | Kansas | Midwest | 26.5 B 1.11% |
| 29 | Utah | West | 25.1 B 1.06% |
| 30 | Maryland | South | 23.9 B 1.01% |
| 31 | Colorado | West | 23.5 B 0.99% |
| 32 | Arkansas | South | 21.9 B 0.92% |
| 33 | Mississippi | South | 18.2 B 0.77% |
| 34 | Nebraska | Midwest | 17.8 B 0.75% |
| 35 | Oklahoma | South | 16.3 B 0.69% |
| 36 | Idaho | West | 9.4 B 0.39% |
| 37 | Nevada | West | 8.8 B 0.37% |
| 38 | New Hampshire | Northeast | 7.9 B 0.33% |
| 39 | West Virginia | South | 7.3 B 0.31% |
| 40 | Maine | Northeast | 6.8 B 0.29% |
| 41 | Delaware | South | 6.3 B 0.26% |
| 42 | Rhode Island | Northeast | 4.6 B 0.19% |
| 43 | South Dakota | Midwest | 4.5 B 0.19% |
| 44 | New Mexico | West | 4.4 B 0.18% |
| 45 | North Dakota | Midwest | 4.3 B 0.18% |
| 46 | Montana | West | 3.0 B 0.13% |
| 47 | Vermont | Northeast | 2.9 B 0.12% |
| 48 | Hawaii | West | 1.6 B 0.07% |
| 49 | Alaska | West | 1.4 B 0.06% |
| n/a | Wyoming | West | n/a n/a |
Scatter chart: scale vs share
Each point is a state with a published value (x = manufacturing GDP in billions; y = share of the published total). Hover a point to see the label.
Fallback summary:
Top 3 by scale: California 347.5B, Texas 239.3B, Indiana 119.4B.
Published total: 2,375.9B (49 states). Top 10 share: 56.60%.
Interpretation • Policy takeaways • FAQ • Sources
How to interpret manufacturing GDP by state
Manufacturing GDP is a production-focused indicator: it describes where inflation-adjusted manufacturing value added is generated. It is a useful way to talk about industrial output and cluster depth, but it should not be treated as a stand-in for factory jobs, shipments, exports, or “industrial strength” in every sense.
A state can rank high because it hosts large, capital-intensive, or high-margin subsectors (for example, advanced chemicals, aerospace, complex machinery, or electronics). Another state can employ many manufacturing workers but produce less value added if its mix is more labor-intensive or lower value per unit output. In other words: scale and sector mix matter as much as headcount.
Plain-English rule: this table answers “where real manufacturing output is,” not “where manufacturing is everything.”
To measure dependence, compare manufacturing GDP with total state GDP. To measure jobs, use employment and wages. To measure trade exposure, use exports.
Real (chained-dollar) values are chosen to reduce confusion between price changes and real output changes. That makes the metric better suited for production comparisons across time. At the same time, chain-type series are not perfectly additive, and the national manufacturing total may not exactly match a simple sum of detailed components. For transparency, this page reports the denominator used for shares as the published sum across states with available values.
Why output clusters geographically
Manufacturing clusters are built around input availability and coordination costs. When a region accumulates specialized suppliers, maintenance expertise, engineering services, testing labs, and logistics capacity, new plants gain from the existing ecosystem. Suppliers then locate near anchor firms to reduce delivery time and improve synchronization. Over time, these feedback loops can be stronger than simple “low cost” explanations.
State borders also hide how integrated many production systems are. Autos, aerospace, chemicals, and food processing often operate as multi-state networks: components and services cross borders repeatedly. A high-output state is frequently a node in a larger regional web, not an isolated island of production.
Policy takeaways (production-focused)
- Workforce pipelines: apprenticeships, community-college programs, and technician training can be more binding than incentives when advanced plants scale.
- Site readiness: industrial land, permitting clarity, and utility interconnection timelines often decide projects when multiple states compete.
- Freight reliability: ports, rail, highways, and last-mile access reduce inventory buffers and improve supplier coordination.
- Energy resilience: stable power and predictable rates matter for energy-intensive manufacturing and for continuous-process industries.
- Supplier development: upgrading local vendors can multiply the value-added impact of anchor plants and reduce supply-chain fragility.
- Innovation diffusion: university–industry links and applied R&D help states move toward higher value-added manufacturing over time.
For readers using the ranking in practice, the most reliable approach is to treat manufacturing GDP as a starting map. Then layer in subsector mix (which industries drive the number), employment and wage data (who benefits and where skills are scarce), and infrastructure indicators (whether growth can be supported without bottlenecks).
FAQ
Why does California rank #1 in real manufacturing GDP?
Manufacturing GDP is value added, so California can lead through a combination of scale and high-value subsectors (aerospace, electronics, complex machinery, and specialized processing). The measure captures the net contribution of manufacturing to GDP, not just factory counts.
Why is Indiana so high relative to its population?
A state can rank high when it hosts dense tradable-sector clusters (autos and suppliers, machinery, chemicals) with large value added per worker and a deep supplier ecosystem. Absolute GDP by industry reflects output scale, not population size.
What does “chained 2017 dollars” mean in plain English?
It is an inflation-adjusted measure of real output. Instead of letting higher prices inflate the numbers, chain-type methods aim to reflect changes in quantities and productivity. Values are expressed in 2017-dollar terms for comparability.
Are the “shares” on this page shares of the entire U.S. manufacturing GDP?
They are shares of the published state total in the source ranking table (49 states). One state value is not published for this industry-year cell, so the denominator is the published sum rather than a full 50-state total.
Is manufacturing GDP the same as manufacturing employment or factory sales?
No. Manufacturing GDP is value added (output minus intermediate inputs). Employment counts jobs; factory sales or shipments measure revenue-like flows. These can move differently when productivity, prices, and supply-chain structure change.
Can ranks change after revisions?
Yes. BEA updates and revises regional accounts when more complete source data become available or methods change. A state’s level and rank can shift even if the underlying economy did not “suddenly” change.
Why is Wyoming marked as n/a (suppressed)?
Some state–industry cells may be withheld in published tables to protect confidential information. When a value is suppressed, it should not be treated as zero; it is simply not published for that cell.
Sources
Primary definitions and the published ranking table used for the values in this page:
Public ranking table listing state manufacturing GDP levels (chained 2017 dollars) used for the state values and ordering.
BEA program page with releases, definitions, and access points for state GDP by industry.
Methodology documentation describing conceptual framework, sources, and estimation practices for GDP by state.
Notes on definitions and release context, including how state GDP is defined and reported.
Example release explaining that annual state GDP estimates can be revised when more complete source data are incorporated.
Interactive data application for GDP by state and industry; use it to verify units, definitions, and select manufacturing (NAICS 31–33).
Convenient distribution of BEA’s manufacturing real GDP series with update timestamps and download options.


