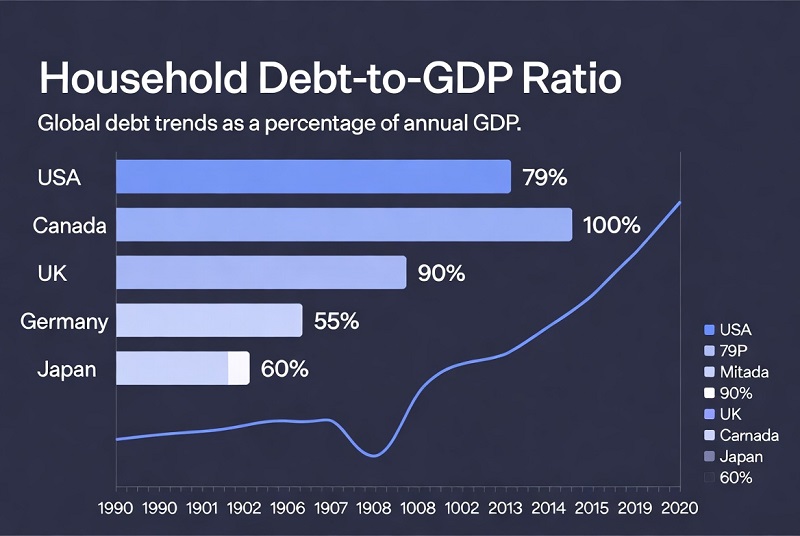
Countries by Household Debt-to-GDP — 2025
What this measures. Household debt-to-GDP compares the outstanding stock of household (and NPISH) credit to the size of the economy. It is a leverage gauge: high values usually reflect deep mortgage markets, high property values, and long loan tenors—while also amplifying sensitivity to interest rates, unemployment, and house-price corrections.
Data shown here are taken from the BIS “Credit to non-financial sector” long series (break-adjusted). Where a country has no official BIS observation for the snapshot quarter, it is not included.
Top 10 (Household debt-to-GDP)
Switzerland
Mortgage-heavy credit system; long-running high leverage
Australia
High housing exposure; large share of variable-rate mortgages
Canada
Large mortgage market; high household balance-sheet size
Netherlands
Structural mortgage depth and tax/contract features
New Zealand
Housing-driven leverage; strong household credit penetration
South Korea
High household leverage amid expensive housing markets
Norway
High mortgage share; sensitive to rate resets and income shocks
Hong Kong
High property values; household leverage sustained by housing finance
Thailand
Elevated household credit stock relative to GDP
Denmark
Deep mortgage finance; long-established household credit system
Method note for this section. The ranking uses the BIS “Credit to non-financial sector” household (households + NPISH) break-adjusted series, expressed as a percent of GDP. The reference point is the latest available quarter used as the “2025 snapshot” (Q2 2025, end-of-quarter). Values are displayed to one decimal where provided by the source.
Top 10 table (level)
| Rank | Country | Debt/GDP (%) | Snapshot |
|---|---|---|---|
| 1 | Switzerland | 121.1 | Q2 2025 |
| 2 | Australia | 113.7 | Q2 2025 |
| 3 | Canada | 98.4 | Q2 2025 |
| 4 | Netherlands | 93.9 | Q2 2025 |
| 5 | New Zealand | 90.2 | Q2 2025 |
| 6 | South Korea | 89.7 | Q2 2025 |
| 7 | Norway | 88.4 | Q2 2025 |
| 8 | Hong Kong | 87.9 | Q2 2025 |
| 9 | Thailand | 87.7 | Q2 2025 |
| 10 | Denmark | 84.4 | Q2 2025 |
Top 20 bar chart
Household debt-to-GDP (%) — Top 20 (BIS snapshot)
Unit: % of GDP · Reference: Q2 2025 (end-of-quarter)
Chart fallback (values shown as a list)
- Switzerland — 121.1%
- Australia — 113.7%
- Canada — 98.4%
- Netherlands — 93.9%
- New Zealand — 90.2%
- South Korea — 89.7%
- Norway — 88.4%
- Hong Kong — 87.9%
- Thailand — 87.7%
- Denmark — 84.4%
- Sweden — 83.3%
- United Kingdom — 74.3%
- United States — 71.5%
- Malaysia — 69.9%
- Japan — 65.4%
- Finland — 63.2%
- Luxembourg — 62.6%
- France — 60.0%
- China — 59.6%
- Belgium — 56.6%
Full table (all countries available in this snapshot)
This snapshot includes 43 countries with an official household debt-to-GDP value (Jun 2025). Columns shown: level and YoY change (pp). Where a field is not available, it is left blank rather than estimated.
| Rank | Country | Debt/GDP (%) | YoY change (pp) | Reference |
|---|---|---|---|---|
| 1 | Switzerland | 121.1 | −2.6 | Jun 2025 |
| 2 | Australia | 113.7 | −1.3 | Jun 2025 |
| 3 | Canada | 98.4 | −4.0 | Jun 2025 |
| 4 | Netherlands | 93.9 | −11.7 | Jun 2025 |
| 5 | New Zealand | 90.2 | −6.4 | Jun 2025 |
| 6 | South Korea | 89.7 | −8.3 | Jun 2025 |
| 7 | Norway | 88.4 | +5.9 | Jun 2025 |
| 8 | Hong Kong | 87.9 | −6.7 | Jun 2025 |
| 9 | Thailand | 87.7 | −6.1 | Jun 2025 |
| 10 | Denmark | 84.4 | −6.7 | Jun 2025 |
| 11 | Sweden | 83.3 | −9.1 | Jun 2025 |
| 12 | United Kingdom | 74.3 | −7.9 | Jun 2025 |
| 13 | Malaysia | 69.9 | +0.7 | Jun 2025 |
| 14 | USA | 68.0 | −7.4 | Jun 2025 |
| 15 | Japan | 64.0 | −3.2 | Jun 2025 |
| 16 | Finland | 63.2 | −4.5 | Jun 2025 |
| 17 | Luxembourg | 62.6 | −4.9 | Jun 2025 |
| 18 | France | 60.0 | −6.2 | Jun 2025 |
| 19 | China | 59.6 | −0.5 | Jun 2025 |
| 20 | Belgium | 56.6 | −4.8 | Jun 2025 |
| 21 | Portugal | 53.1 | −10.0 | Jun 2025 |
| 22 | Germany | 49.2 | −5.1 | Jun 2025 |
| 23 | Chile | 44.7 | −0.7 | Jun 2025 |
| 24 | Singapore | 44.6 | −3.5 | Jun 2025 |
| 25 | Spain | 43.9 | −11.2 | Jun 2025 |
| 26 | Austria | 43.3 | −6.7 | Jun 2025 |
| 27 | India | 42.6 | +4.3 | Jun 2025 |
| 28 | Israel | 42.2 | −2.3 | Jun 2025 |
| 29 | Greece | 38.5 | −13.5 | Jun 2025 |
| 30 | Brazil | 36.5 | +3.4 | Jun 2025 |
| 31 | Italy | 35.9 | −5.1 | Jun 2025 |
| 32 | South Africa | 33.9 | −0.5 | Jun 2025 |
| 33 | Saudi Arabia | 31.6 | +4.3 | Jun 2025 |
| 34 | Czechia | 31.0 | −1.6 | Jun 2025 |
| 35 | Colombia | 25.39 | −3.8 | Jun 2025 |
| 36 | Ireland | 24.3 | −5.0 | Jun 2025 |
| 37 | Poland | 22.3 | −7.1 | Jun 2025 |
| 38 | Russia | 21.0 | +1.8 | Jun 2025 |
| 39 | Hungary | 17.5 | −2.3 | Jun 2025 |
| 40 | Mexico | 17.0 | +0.9 | Jun 2025 |
| 41 | Indonesia | 15.8 | −0.7 | Jun 2025 |
| 42 | Turkey | 9.6 | −2.7 | Jun 2025 |
| 43 | Argentina | 5.4 | +1.0 | Jun 2025 |
Footnote: “YoY change” is the difference between the latest snapshot and the value one year earlier (in percentage points). “Debt per capita” and “mortgage share” are not shown here because they are not consistently available in this snapshot across countries.
Scatter chart: debt level vs YoY change
Household debt-to-GDP vs YoY change (Jun 2025)
Each dot is a country · X-axis: Debt/GDP (%) · Y-axis: YoY change (pp)
How to interpret household debt-to-GDP
Debt-to-GDP is a sensitivity indicator, not a moral score. A high household debt ratio often reflects a large mortgage market and high property values. The risk is not the level alone—it is the interaction with (1) interest-rate resets, (2) household income shocks, and (3) house-price drawdowns that reduce collateral buffers.
1) Interest-rate channel (payment shock)
- Variable-rate dominance means faster transmission from central-bank hikes to monthly payments.
- Fixed-rate systems smooth the shock, but refinancing waves can still create delayed stress.
- Debt-service vs. debt stock: two countries can have similar debt/GDP but very different payment burdens depending on rates and loan terms.
2) Mortgage structure (housing concentration)
- Household leverage is typically mortgage-led in high-debt economies; consumer credit is the smaller share.
- High loan-to-value (LTV) lending and interest-only features can raise vulnerability when prices fall.
- House-price growth can temporarily “mask” risk by increasing collateral; reversals do the opposite.
3) Consumer credit channel (non-housing stress)
- Credit cards, auto loans, and unsecured lending tend to matter most during unemployment spikes.
- Even with moderate debt/GDP, high delinquency can emerge if lending quality is weak.
Macro risks to watch in 2025
- Recession + high rates is the hardest mix: income falls while servicing costs stay elevated.
- House-price correction weakens collateral and can reduce credit availability through tighter underwriting.
- Refinancing cliffs appear when fixed-rate loans reset at higher rates over a short window.
- Bank funding conditions can amplify tightening even without policy-rate changes.
Policy takeaways
- Macroprudential tools (LTV/DTI caps, stress tests, amortization requirements) are designed to cool risk without requiring large rate moves.
- Targeted measures work best when risk is concentrated (e.g., investor loans, high-LTV first-time buyers, short-reset mortgages).
- Data transparency matters: breakdowns by mortgage vs consumer credit and by rate type improve early-warning capacity.
Comparability limitations (read before comparing countries)
- Definition differences: “households + NPISH” coverage and instrument scope can differ across reporting systems.
- Breaks and revisions: long series are adjusted for breaks, but historical comparability still depends on underlying national source changes.
- Shadow/alternative lending: some forms of credit may sit outside bank balance sheets or be underreported in certain jurisdictions.
- GDP denominator effects: nominal GDP swings can move the ratio even when debt stocks change slowly.
Primary sources (what each is used for)
BIS — Credit to the non-financial sector (main source)
Debt/GDP seriesUse this for the core “households + NPISH” credit stock, including the break-adjusted long series. This is the benchmark series behind the country-level household debt-to-GDP values.
BIS — methodology on long credit series / break adjustments
Definitions & breaksExplains how BIS constructs long series and adjusts for structural breaks across source changes; useful for interpreting 5-year change and longer trends.
BIS — Total credit statistics (tables & documentation)
Coverage guideCountry coverage notes and table documentation used to verify which economies are included and how aggregates are defined.
OECD — Household debt (cross-check where available)
Cross-checkUseful for validating household debt measures for OECD members and for additional metadata. Not all countries are covered.
IMF — Global Debt Database (broad context)
Context seriesBroad debt context and alternative coverage; definitions can differ from BIS. Use primarily for triangulation and narrative context.
https://www.imf.org/en/Publications/WP/Issues/2020/12/16/A-Global-Database-of-Public-Debt-50053
FRED mirror (BIS series re-publisher; convenient lookup)
ConvenienceA practical front-end for BIS series with clear “Observations” lines and source codes. Values should be treated as BIS-based, with BIS as the ultimate source.
How to replicate the ranking from the primary source
- Open the BIS Data Portal: data.bis.org.
- Navigate to the dataset “Credit to non-financial sector” and select Borrowers: Households and NPISH.
- Select the measure expressed as % of GDP (break-adjusted series if you want consistency across time).
- Choose the snapshot quarter (e.g., 2025-Q2) and export the country list to sort by value.
FAQ
Is high household debt-to-GDP always bad?
Not automatically. High ratios often reflect mature mortgage markets and high home values. Risk depends on rate structure (fixed vs variable), underwriting standards, and how resilient household income is during downturns.
Why can a country rank high even if “people aren’t struggling”?
Debt-to-GDP is a stock ratio. A high level can coexist with low default rates when incomes are stable, lending is conservative, and debt service remains manageable relative to disposable income.
Does this measure include only mortgages?
No. The BIS household credit concept covers loans and debt securities to households (and NPISH). In many high-debt economies, mortgages are the dominant component, but the total also reflects consumer credit where relevant.
Can the ratio fall even if households keep borrowing?
Yes. If nominal GDP grows faster than the outstanding debt stock (or if inflation lifts GDP), the ratio can decline even while debt rises in nominal terms.
Why do some countries have no value?
Coverage depends on official reporting and definitional alignment. If there is no BIS household (households + NPISH) observation for the snapshot quarter, the country is not shown rather than estimated.
What’s the biggest mistake when comparing countries?
Treating the number as purely “consumer debt stress.” In many economies it is primarily a housing finance number. You need context: mortgage terms, rate type, housing supply constraints, and the pace of house-price changes.
What indicator should I pair with debt-to-GDP?
Pair it with a payment metric (debt service ratio), an income shock proxy (unemployment), and a housing indicator (house-price growth). That combination explains vulnerability better than any single ratio.
Download: Household Debt-to-GDP (2025) — Tables & Chart Files
This asset pack contains the ranking tables used in the article and the exported chart images for reuse in posts, newsletters, or reports.
- CSV: Top 10 and Top 20 household debt-to-GDP tables
- HTML: ready-to-embed Top 10 table
- Images: Top 20 chart exported as PNG and SVG
- Notes: source links and comparability notes
admin (Website)
administrator