Countries by External Debt (% of GNI) — 2025
What this ranking measures
This ranking compares economies by external debt stocks as a share of Gross National Income (GNI). The concept captures total debt owed to nonresidents (public and private), expressed as a percentage of national income. Higher values can reflect genuine leverage and rollover risk — but also financial-center balance sheets where cross-border positions are large relative to domestic income.
Reference: 2024 values are used as a practical 2025 snapshot because internationally comparable debt series are published with a lag.
Top 10 economies by external debt (% of GNI)
Top 10 table
| Rank | Economy | External debt (% of GNI) | Short-term debt share (%) |
|---|---|---|---|
| 1 | Luxembourg | 3,983.17 | 27.27 |
| 2 | Malta | 797.06 | 20.25 |
| 3 | Cyprus | 670.48 | 24.53 |
| 4 | Ireland | 522.34 | 40.01 |
| 5 | Hong Kong | 469.47 | 59.86 |
| 6 | Singapore | 399.86 | 62.89 |
| 7 | Netherlands | 335.47 | 23.60 |
| 8 | Seychelles | 302.28 | 29.10 |
| 9 | United Kingdom | 267.77 | 70.71 |
| 10 | France | 240.08 | 43.88 |
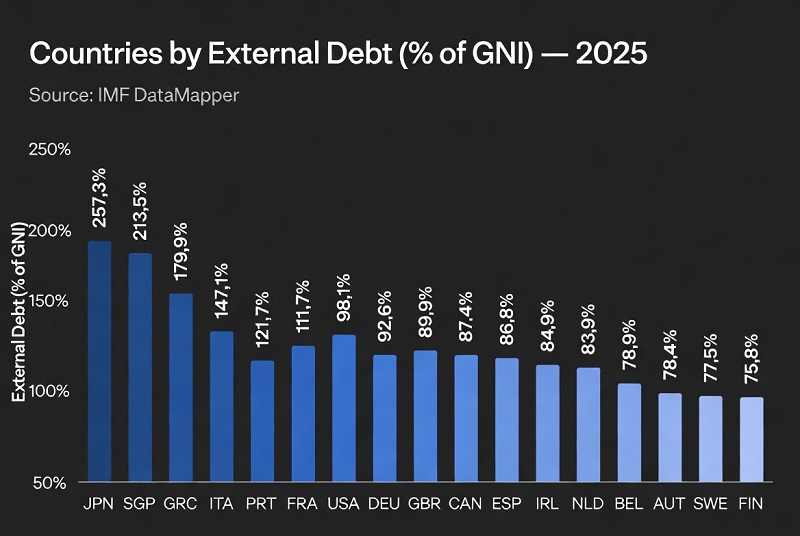
Top 20 bar chart
External debt stocks (% of GNI), top 20 economies.
Chart unavailable — Top 20 list
- Luxembourg — 3,983.17%
- Malta — 797.06%
- Cyprus — 670.48%
- Ireland — 522.34%
- Hong Kong — 469.47%
- Singapore — 399.86%
- Netherlands — 335.47%
- Seychelles — 302.28%
- United Kingdom — 267.77%
- France — 240.08%
- Belgium — 235.33%
- Switzerland — 234.52%
- Lebanon — 233.88%
- Greece — 232.71%
- Finland — 195.43%
- Sweden — 162.21%
- Spain — 156.18%
- Mongolia — 155.37%
- Norway — 151.89%
- Austria — 151.37%
Methodology (how the 2025 snapshot is built)
The ranking uses the most recent internationally comparable values for external debt stocks as a share of GNI. For most economies the latest observation currently available is 2024, and we use it as a 2025 snapshot. External debt is a stock concept: it reflects the outstanding amount owed to nonresidents at a point in time, rather than what a country borrowed in a single year.
Where available, we also use short-term external debt share (portion of total external debt with original maturity of one year or less). This helps distinguish “high debt but long maturity” from “high debt and fast rollover,” which tends to be more fragile during rate spikes or market closures.
Limitations: series are revised; reporting differs by economy; financial-center structures can inflate gross external positions; and the latest year may not fully capture very recent refinancing shocks.
Insights to notice in 2025
1) Financial hubs dominate the very top. In small open economies with large banking/corporate cross-border balance sheets, gross external debt can dwarf domestic income.
2) Rollover risk is about maturity, not only size. A country with moderate external debt but a high short-term share can face tighter liquidity stress than a higher-debt peer with longer maturities.
3) Buffer matters. Large FX reserves and credible access to swap lines can reduce “sudden stop” risk even when headline external debt is elevated.
What it means for readers
External debt ratios are a macro risk lens. For households and investors, the practical channel is currency and interest-rate volatility: when external financing tightens, economies with higher rollover pressure may see sharper FX moves, tighter credit, and fiscal adjustment. For businesses, the signal is strongest if revenues are local-currency while liabilities are foreign-currency — especially with short maturities.
FAQ
Why are Luxembourg, Malta, Cyprus, and Ireland so high?
These economies host large cross-border financial and corporate structures. The ranking reflects gross external liabilities relative to domestic income, not necessarily household debt or “traditional” sovereign borrowing.
Does a high ratio mean a country is near default?
Not automatically. Risk depends on who owes the debt (public vs private), currency composition, maturity, creditor base, and whether the economy has stable market access and FX liquidity buffers.
What’s the difference between external debt and government debt?
External debt covers liabilities to nonresidents across sectors (government, banks, corporates). Government debt is broader by creditor residence and often includes domestic debt held by residents.
Why focus on short-term external debt share?
Short maturities increase rollover frequency. When global rates rise or markets close, refinancing becomes harder and more expensive, which can force abrupt adjustment.
Can FX reserves “offset” external debt?
Reserves are not a direct offset, but they can provide liquidity for critical imports, banking stress, and short-term external payments during volatility. The key is adequacy relative to near-term needs.
Why use 2024 data for a 2025 ranking?
International debt series are compiled with a reporting lag. Using the latest common year creates a comparable 2025 snapshot rather than mixing different vintages across countries.
Full ranking (Top 100)
Search, sort, and filter the table. By default (with JavaScript enabled) the view starts at Top 20 — the full Top 100 remains in the page source.
| Rank | Economy | External debt (% of GNI) | Short-term share (% of total) |
|---|---|---|---|
| 1 | Luxembourg | 3,983.17% — | 27.27% |
| 2 | Malta | 797.06% — | 20.25% |
| 3 | Cyprus | 670.48% — | 24.53% |
| 4 | Ireland | 522.34% — | 40.01% |
| 5 | Hong Kong | 469.47% — | 59.86% |
| 6 | Singapore | 399.86% — | 62.89% |
| 7 | Netherlands | 335.47% — | 23.60% |
| 8 | Seychelles | 302.28% — | 29.10% |
| 9 | United Kingdom | 267.77% — | 70.71% |
| 10 | France | 240.08% — | 43.88% |
| 11 | Belgium | 235.33% — | 41.77% |
| 12 | Switzerland | 234.52% — | 51.00% |
| 13 | Lebanon | 233.88% — | n/a |
| 14 | Greece | 232.71% — | 31.49% |
| 15 | Finland | 195.43% — | 30.39% |
| 16 | Sweden | 162.21% — | 32.73% |
| 17 | Spain | 156.18% — | 37.46% |
| 18 | Mongolia | 155.37% — | 5.49% |
| 19 | Norway | 151.89% — | 35.83% |
| 20 | Austria | 151.37% — | 29.36% |
| 21 | Germany | 141.74% — | 35.54% |
| 22 | Canada | 141.18% — | 37.54% |
| 23 | Portugal | 141.14% — | 40.90% |
| 24 | Denmark | 137.32% — | 29.92% |
| 25 | Hungary | 132.59% — | 9.81% |
| 26 | Montenegro | 121.41% — | n/a |
| 27 | Mauritius | 119.47% — | 62.27% |
| 28 | Italy | 116.10% — | 33.36% |
| 29 | Zambia | 109.08% — | 11.64% |
| 30 | Japan | 108.78% — | 73.10% |
| 31 | Ukraine | 103.59% — | 12.17% |
| 32 | Suriname | 100.55% — | 5.30% |
| 33 | Slovakia | 96.34% — | 36.09% |
| 34 | United States | 94.56% — | 31.91% |
| 35 | Estonia | 93.94% — | 29.78% |
| 36 | Australia | 93.30% — | 27.39% |
| 37 | Rwanda | 91.64% — | 3.83% |
| 38 | New Zealand | 88.27% — | 22.63% |
| 39 | Jordan | 87.67% — | 37.03% |
| 40 | Slovenia | 84.42% — | 35.88% |
| 41 | Dominica | 84.20% — | 30.26% |
| 42 | Djibouti | 83.69% — | 14.22% |
| 43 | Nicaragua | 79.11% — | 7.35% |
| 44 | North Macedonia | 76.88% — | 21.60% |
| 45 | Lithuania | 74.55% — | 49.92% |
| 46 | Georgia | 74.42% — | 19.27% |
| 47 | Namibia | 74.25% — | 13.32% |
| 48 | Tunisia | 74.24% — | 37.12% |
| 49 | Chile | 74.18% — | 7.99% |
| 50 | Iceland | 71.66% — | 11.58% |
| 51 | Malaysia | 71.54% — | 42.65% |
| 52 | El Salvador | 70.88% — | 10.57% |
| 53 | Kyrgyzstan | 69.07% — | 14.69% |
| 54 | Jamaica | 67.63% — | 16.20% |
| 55 | Sri Lanka | 64.97% — | 11.55% |
| 56 | Paraguay | 64.66% — | n/a |
| 57 | Armenia | 64.42% — | 22.17% |
| 58 | Croatia | 63.96% — | 32.00% |
| 59 | Tr.&Tobago | 62.72% — | 10.75% |
| 60 | Czechia | 62.67% — | 36.04% |
| 61 | Uzbekistan | 59.74% — | 8.15% |
| 62 | Moldova | 59.50% — | 23.73% |
| 63 | Fiji | 59.36% — | n/a |
| 64 | Kazakhstan | 56.36% — | 11.82% |
| 65 | Uruguay | 55.81% — | 18.70% |
| 66 | Romania | 55.22% — | 10.19% |
| 67 | Liberia | 51.39% — | n/a |
| 68 | Poland | 50.45% — | 17.80% |
| 69 | Tajikistan | 50.37% — | 11.74% |
| 70 | Colombia | 48.47% — | 9.99% |
| 71 | Ecuador | 48.17% — | 0.64% |
| 72 | Belize | 48.10% — | n/a |
| 73 | Bosnia & Herz. | 48.10% — | 20.60% |
| 74 | Burkina Faso | 47.55% — | n/a |
| 75 | Papua N.G. | 46.97% — | n/a |
| 76 | Saint Lucia | 46.51% — | 6.64% |
| 77 | Bulgaria | 46.12% — | 20.14% |
| 78 | Belarus | 45.79% — | 28.10% |
| 79 | Ivory Coast | 45.66% — | n/a |
| 80 | Cambodia | 45.32% — | 20.56% |
| 81 | South Africa | 44.01% — | 27.56% |
| 82 | Domin. Rep. | 43.89% — | n/a |
| 83 | Morocco | 42.37% — | 10.88% |
| 84 | Argentina | 40.78% — | 11.88% |
| 85 | Egypt | 40.49% — | 19.98% |
| 86 | Albania | 40.01% — | 12.08% |
| 87 | Madagascar | 39.71% — | n/a |
| 88 | Turkey | 38.70% — | 33.83% |
| 89 | Honduras | 38.67% — | 11.27% |
| 90 | Bahamas | 36.65% — | n/a |
| 91 | Thailand | 36.57% — | 36.52% |
| 92 | Kenya | 36.20% — | n/a |
| 93 | South Korea | 35.88% — | 21.78% |
| 94 | Pakistan | 35.07% — | 7.29% |
| 95 | Uganda | 35.02% — | 2.65% |
| 96 | Ant.& Barb. | 34.91% — | 6.73% |
| 97 | Samoa | 33.76% — | 17.26% |
| 98 | Bolivia | 33.66% — | 3.05% |
| 99 | Mexico | 31.89% — | 10.61% |
| 100 | Solomon Isl. | 31.39% — | 5.23% |
Scatter: external debt vs FX reserves (sample)
Sample uses FX reserves (total reserves incl. gold, current USD) for countries where values are available in the same snapshot period. X-axis uses a logarithmic scale (USD billions).
- Luxembourg — debt 3,983.17% | reserves 2.98 bn
- Malta — debt 797.06% | reserves 1.22 bn
- Cyprus — debt 670.48% | reserves 1.79 bn
- Ireland — debt 522.34% | reserves 12.90 bn
- Slovakia — debt 96.34% | reserves 11.29 bn
- Montenegro — debt 121.41% | reserves 1.57 bn
- Mongolia — debt 155.37% | reserves 4.92 bn
- Lithuania — debt 74.55% | reserves 6.17 bn
- Iceland — debt 71.66% | reserves 5.81 bn
- Moldova — debt 59.50% | reserves 5.45 bn
- Nicaragua — debt 79.11% | reserves 5.45 bn
- Jamaica — debt 67.63% | reserves 4.87 bn
- Bahamas — debt 36.65% | reserves 2.51 bn
- Belize — debt 48.10% | reserves 0.47 bn
- Samoa — debt 33.76% | reserves 0.45 bn
- Saint Lucia — debt 46.51% | reserves 0.42 bn
- Ant.& Barb. — debt 34.91% | reserves 0.36 bn
- Dominica — debt 84.20% | reserves 0.18 bn
- Solomon Isl. — debt 31.39% | reserves 0.69 bn
- Seychelles — debt 302.28% | reserves 0.68 bn
How to interpret external debt (% of GNI)
External debt is a gross stock measure: it counts outstanding liabilities to nonresidents across sectors. That makes it useful for identifying economies that rely heavily on external funding — but it also means the ratio can be amplified by cross-border financial intermediation, special-purpose entities, and multinational treasury operations.
Key reading rule: A very high ratio is most informative when it is paired with (1) high short-term share, (2) large FX mismatch, and (3) limited FX liquidity buffers.
That combination is where external debt turns into rollover risk and currency stress under tighter global financial conditions.
Risk channels that matter most
- Currency mismatch: liabilities in foreign currency vs revenues in local currency can amplify FX shocks.
- Refinancing wall: higher short-term share means more frequent rollovers and greater sensitivity to market closures.
- Debt service squeeze: rising global rates and wider spreads lift interest costs and drain FX liquidity.
- Private-sector stress: external corporate borrowing can turn into public stress through banking systems and contingent liabilities.
- Confidence dynamics: abrupt risk repricing (“sudden stops”) can force sharp adjustment even before debt hits extreme levels.
What to watch through 2025
- Global rate path: slower-than-expected easing keeps rollover costs elevated.
- Dollar strength: raises local-currency debt burdens and can tighten credit conditions for importers.
- Eurobond access: markets can remain open for some issuers while staying closed for frontier credits.
- Reserve adequacy: not just the level, but usability (liquidity, swap lines, and policy credibility).
- Composition shifts: movement toward shorter maturities or more FX-linked structures increases fragility.
Policy takeaways
- Lengthen maturity and reduce rollover frequency where possible; build predictable funding calendars.
- Strengthen FX liquidity buffers (reserves, contingent credit lines) for short-term payment needs.
- Improve transparency on public and quasi-public external liabilities (including SOEs and guarantees).
- Deepen local-currency markets to reduce reliance on FX borrowing over time.
- Macroprudential guardrails to limit unhedged external borrowing in the banking/corporate sector.
Sources
- World Bank WDI metadata — External debt stocks (% of GNI) (DT.DOD.DECT.GN.ZS)
- World Bank DataBank — International Debt Statistics (IDS)
- TheGlobalEconomy — External debt ranking (based on World Bank series)
- TheGlobalEconomy — Short-term external debt share ranking
- World Bank WDI metadata — Total reserves, including gold (FI.RES.TOTL.CD; IMF-linked source metadata)
- TheGlobalEconomy — Total reserves ranking (current USD)
- IMF — Quarterly External Debt Statistics (QEDS)
Reference year used in ranking tables: 2024 (proxy for 2025 snapshot), depending on latest availability per series.