Top 100 Countries by Budget Deficit (% of GDP), 2025
This page ranks countries by the IMF measure of general government net lending / borrowing as a share of GDP, expressed here in plain language as budget deficit where the balance is negative. For broad cross-country coverage, the table uses the latest widely comparable IMF snapshot, which is still centered mainly on 2024 actual values and is presented here as the nearest full-country reference set for a 2025 comparison page.
Use the ratio as a fiscal-stress indicator, not as a scorecard. A deficit of −8% of GDP does not automatically mean imminent crisis. What matters is whether that gap sits inside a country with low debt, deep domestic funding, strong growth, reserve buffers, and policy credibility—or inside one already constrained by refinancing pressure, weak revenue, conflict, or external imbalance.
Top 10 countries with the deepest budget deficits in the current snapshot
The top of the table does not reflect a single fiscal pattern. It mixes war finance, microstate volatility, post-crisis adjustment, commodity dependence, and structurally weak budget balances.
Timor-Leste sits far above the rest of the ranking, which usually points to a fiscal model where public spending is running far ahead of the domestic non-oil revenue base.
Kiribati illustrates how a very small revenue base can produce unusually large fiscal swings when public expenditure, external grants, and capital programs do not move in step.
Ukraine belongs to a separate wartime category, where defense, resilience, and emergency support dominate the fiscal picture.
The Maldives combines heavy infrastructure and debt-service pressure with a tourism-led economy that can be sensitive to shocks.
Bolivia remains one of the clearer structural deficit stories in Latin America rather than a one-off crisis spike.
Zimbabwe combines macro instability, limited policy credibility, and a weak fiscal base, which makes even a mid-table deficit ratio harder to finance than the headline alone may suggest.
Sri Lanka is still carrying the legacy of a severe macro crisis, so the deficit has to be read alongside debt restructuring and adjustment.
Egypt’s deficit is not just about primary spending. Interest costs and refinancing pressure are central to the story.
In a small island economy, reconstruction, infrastructure, or disaster-related spending can lift the deficit sharply because the GDP denominator is modest and revenues are narrow.
Brunei reminds readers that resource-backed economies can still run sizable deficits when expenditure commitments stay high relative to cyclical revenues.
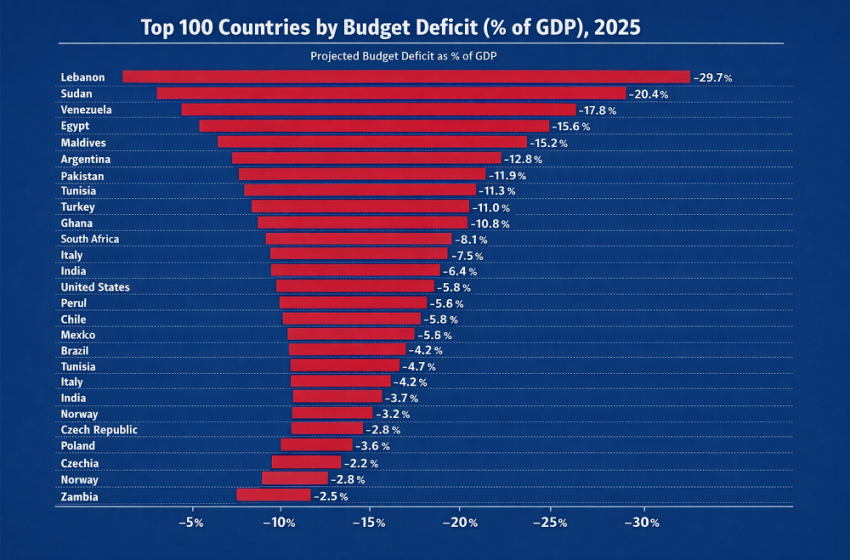
Chart 1. Top 20 budget deficits by % of GDP
The chart uses absolute deficit size, so the longest bar marks the deepest financing gap.
Full Top 100 table
All 100 rows are embedded directly in the HTML source. Search and sorting only help navigation.
| Rank | Country | Budget deficit | Fiscal context |
|---|---|---|---|
| 1 | Timor-Leste | −41.13% | Resource fund drawdown |
| 2 | Kiribati | −22.39% | Small-island volatility |
| 3 | Ukraine | −18.74% | War and emergency finance |
| 4 | Maldives | −17.88% | Tourism and debt pressure |
| 5 | Bolivia | −10.44% | Structural budget strain |
| 6 | Zimbabwe | −10.40% | Macro instability |
| 7 | Sri Lanka | −10.22% | Post-crisis adjustment |
| 8 | Egypt | −10.14% | Interest and financing burden |
| 9 | Saint Vincent and the Grenadines | −10.04% | Small-island capital cycle |
| 10 | Brunei | −9.92% | Commodity-revenue cycle |
| 11 | Algeria | −9.28% | Commodity-revenue cycle |
| 12 | Israel | −9.04% | Security and emergency spending |
| 13 | Malawi | −8.03% | Low-income fiscal stress |
| 14 | Romania | −7.79% | EU fiscal slippage |
| 15 | Syria | −7.79% | Conflict-related distortion |
| 16 | India | −7.78% | Large-economy fiscal gap |
| 17 | Bahrain | −7.65% | Commodity-revenue cycle |
| 18 | United States | −7.63% | Large-economy fiscal gap |
| 19 | Jordan | −7.55% | Structural budget strain |
| 20 | Senegal | −7.51% | Investment and financing pressure |
| 21 | China | −7.43% | Large-economy fiscal gap |
| 22 | Burundi | −7.38% | Low-income fiscal stress |
| 23 | Rwanda | −7.28% | Investment-led deficit |
| 24 | Brazil | −6.93% | Large-economy fiscal gap |
| 25 | Pakistan | −6.75% | Debt and financing pressure |
| 26 | Trinidad and Tobago | −6.72% | Commodity-revenue cycle |
| 27 | Vanuatu | −6.72% | Small-island volatility |
| 28 | Guyana | −6.23% | Fast-growth transition |
| 29 | South Africa | −6.23% | Structural budget strain |
| 30 | Botswana | −6.12% | Commodity-revenue cycle |
| 31 | Zambia | −6.10% | Debt restructuring pressure |
| 32 | Japan | −6.09% | Mature-economy deficit |
| 33 | Tuvalu | −6.04% | Small-island volatility |
| 34 | France | −5.96% | Mature-economy deficit |
| 35 | Tunisia | −5.95% | Debt and financing pressure |
| 36 | Mexico | −5.90% | Large-economy fiscal gap |
| 37 | Slovakia | −5.89% | European fiscal pressure |
| 38 | Myanmar | −5.79% | Conflict and instability |
| 39 | Burkina Faso | −5.69% | Security spending pressure |
| 40 | Poland | −5.66% | European fiscal pressure |
| 41 | Turkey | −5.19% | Macro and policy strain |
| 42 | Kenya | −5.04% | Investment and financing pressure |
| 43 | Moldova | −5.04% | Security and external shock |
| 44 | Iraq | −5.01% | Commodity-revenue cycle |
| 45 | North Macedonia | −4.98% | European fiscal pressure |
| 46 | Hungary | −4.95% | European fiscal pressure |
| 47 | Uganda | −4.93% | Investment-led deficit |
| 48 | Togo | −4.88% | Investment and financing pressure |
| 49 | Libya | −4.78% | Conflict-related distortion |
| 50 | Armenia | −4.75% | Regional security pressure |
| 51 | Ghana | −4.72% | Debt adjustment pressure |
| 52 | Nepal | −4.69% | Low-revenue budget gap |
| 53 | Belgium | −4.66% | Mature-economy deficit |
| 54 | Bangladesh | −4.64% | Public investment pressure |
| 55 | Bhutan | −4.61% | Hydropower investment cycle |
| 56 | Nigeria | −4.55% | Revenue weakness |
| 57 | El Salvador | −4.48% | Debt and financing pressure |
| 58 | Djibouti | −4.47% | Debt and logistics buildout |
| 59 | Hong Kong | −4.46% | Cyclical revenue weakness |
| 60 | Colombia | −4.39% | Structural budget strain |
| 61 | Eritrea | −4.36% | Low-income fiscal stress |
| 62 | Morocco | −4.27% | Investment and social spending |
| 63 | Panama | −4.26% | Revenue-cycle pressure |
| 64 | United Kingdom | −4.25% | Mature-economy deficit |
| 65 | Mozambique | −4.25% | Debt and financing pressure |
| 66 | Fiji | −4.23% | Small-island tourism cycle |
| 67 | Saint Kitts and Nevis | −4.13% | Small-island capital cycle |
| 68 | Niger | −4.06% | Security and development strain |
| 69 | Ivory Coast | −4.05% | Investment-led deficit |
| 70 | Italy | −3.99% | Mature-economy deficit |
| 71 | Malta | −3.99% | Revenue-cycle pressure |
| 72 | Papua New Guinea | −3.92% | Commodity-revenue cycle |
| 73 | Gabon | −3.89% | Commodity-revenue cycle |
| 74 | Philippines | −3.87% | Public investment pressure |
| 75 | New Zealand | −3.84% | Mature-economy deficit |
| 76 | Guinea-Bissau | −3.79% | Low-income fiscal stress |
| 77 | Madagascar | −3.76% | Low-income fiscal stress |
| 78 | Costa Rica | −3.71% | Structural budget strain |
| 79 | Benin | −3.70% | Investment-led deficit |
| 80 | Finland | −3.68% | Mature-economy deficit |
| 81 | Mali | −3.60% | Security spending pressure |
| 82 | Malaysia | −3.59% | Public investment pressure |
| 83 | Uzbekistan | −3.54% | State-led investment |
| 84 | Yemen | −3.54% | Conflict-related distortion |
| 85 | Latvia | −3.44% | European fiscal pressure |
| 86 | Austria | −3.37% | Mature-economy deficit |
| 87 | Peru | −3.21% | Revenue-cycle pressure |
| 88 | Central African Republic | −3.08% | Conflict and fragility |
| 89 | Iran | −3.08% | Sanctions and revenue strain |
| 90 | Montenegro | −3.06% | Small-economy investment cycle |
| 91 | Dominican Republic | −3.05% | Public investment pressure |
| 92 | Saudi Arabia | −3.03% | Commodity-revenue cycle |
| 93 | Guinea | −3.00% | Mining and investment cycle |
| 94 | Mauritius | −3.00% | Small-economy transition |
| 95 | Uruguay | −2.99% | Moderate structural gap |
| 96 | Estonia | −2.98% | European fiscal pressure |
| 97 | Spain | −2.95% | Mature-economy deficit |
| 98 | Bulgaria | −2.93% | European fiscal pressure |
| 99 | Tanzania | −2.90% | Public investment pressure |
| 100 | Sierra Leone | −2.89% | Low-income fiscal stress |
Table note: latest broadly comparable IMF country snapshot, primarily 2024 actual balances compiled on the same indicator basis and used here as the nearest full-coverage reference for a 2025 ranking page.
Methodology
The metric used throughout is the IMF fiscal balance concept of general government net lending / borrowing, percent of GDP. Negative values indicate a deficit and positive values indicate a surplus. The ranking is ordered from the deepest negative balance to the mildest deficit inside the top 100.
For country coverage, the page uses the latest broadly comparable IMF fiscal snapshot available across a large cross-section of economies. In practice, that means the Top 100 table is built mostly on 2024 actual values, because that is where broad coverage is strongest and most consistent. The page is labelled 2025 because it is intended as a current comparison page for 2025 users, built on the nearest full-country IMF reference point rather than on a shorter or more fragmented one-year sample.
Several limitations are worth keeping in mind. Fiscal years differ across countries; conflict-affected economies can have weaker measurement quality; GDP rebasing can change the denominator; and the same deficit number can imply very different risk depending on debt stock, financing structure, reserve cover, inflation, and market access. That is why the ranking should be read together with debt, interest burden, and external-balance indicators rather than in isolation.
Insights and conclusions
1. The largest deficits belong to different fiscal stories. The table mixes conflict and emergency finance, microstate volatility, post-crisis repair, and structurally weak budget positions in larger economies. Treating all of them as the same kind of deficit is the fastest way to misread the ranking.
2. Small countries can look dramatic because the denominator is small. Kiribati, Saint Vincent and the Grenadines, Vanuatu, Tuvalu, and small island or frontier economies can move sharply in the ranking when one investment phase, reconstruction cycle, or revenue swing hits a modest GDP base.
3. A commodity economy can still run a deep deficit. Algeria, Brunei, Bahrain, Iraq, Gabon, Papua New Guinea, and Saudi Arabia show that hydrocarbons or mining do not automatically produce fiscal balance when spending commitments are sticky or revenues are cyclical.
4. Large economies matter differently from microstates. A deficit near 7% of GDP in the United States, China, India, Brazil, or Mexico has broader macro significance because it affects much larger debt markets, financing volumes, and policy expectations.
5. The same ratio can hide very different levels of danger. An advanced economy with deep local-currency funding may live with a 4–6% deficit far more easily than a frontier or fragile economy with weaker institutions, higher inflation, and narrow financing channels.
What this means for the reader
The ranking becomes more useful once it is tied to a practical decision.
- For investors: a large deficit can point to heavier bond issuance, refinancing risk, interest-cost pressure, or a future adjustment through taxes and spending restraint.
- For businesses: persistent fiscal strain can affect procurement timing, subsidy policy, exchange-rate stability, and the probability of tax changes.
- For migration and relocation decisions: deep fiscal stress can influence public-service quality, pension politics, infrastructure spending, and the durability of social programs.
- For policy watchers: deficit data become much more powerful when read next to debt-to-GDP, general government interest payments, current account balance, reserve adequacy, and inflation.
Use the ranking to see where fiscal pressure is concentrated, then judge the risk through debt, funding conditions, inflation, and the external position.
FAQ
What does budget deficit as a share of GDP actually mean?
It measures how large the government financing gap is relative to the size of the economy. A deficit of 5% of GDP means the public sector is spending the equivalent of 5% of annual output more than it collects.
Why are the numbers negative?
The IMF fiscal balance indicator is expressed as net lending or borrowing. Negative means net borrowing, which is the same thing as a budget deficit in everyday language.
Why can a 5% deficit be manageable in one country and dangerous in another?
Because the ratio says nothing by itself about debt stock, funding currency, interest costs, reserve buffers, inflation, or market confidence. Those surrounding conditions determine how sustainable the deficit is.
Why are some very small countries so high in the ranking?
Because a narrow tax base and a small GDP denominator can make one investment cycle, disaster-recovery program, or spending package move the ratio by several percentage points very quickly.
Why is this a 2025 page if many values are from 2024?
Because the page uses the latest IMF snapshot that still provides broad country coverage on a comparable basis. A narrower 2025-only cut would leave the ranking less complete and less consistent across countries.
Does a high deficit automatically mean a sovereign debt crisis is near?
No. Some deficits are temporary, cyclical, or manageable. Others are a sign of a deeper structural mismatch between spending and sustainable revenue. The wider macro setting decides which is which.
Sources
- IMF World Economic Outlook database portal: https://data.imf.org/en/datasets/IMF.RES%3AWEO
- IMF DataMapper dataset hub: https://www.imf.org/external/datamapper/datasets/WEO
- IMF DataMapper indicator page for general government net lending/borrowing: https://www.imf.org/external/datamapper/GGXCNL_NGDP%40WEO/EURO/EU/USA/JPN/CHN
- IMF Fiscal Monitor dataset hub: https://www.imf.org/external/datamapper/datasets/FM
Source note: values are harmonized from IMF fiscal-balance references and rounded to two decimals for readability.