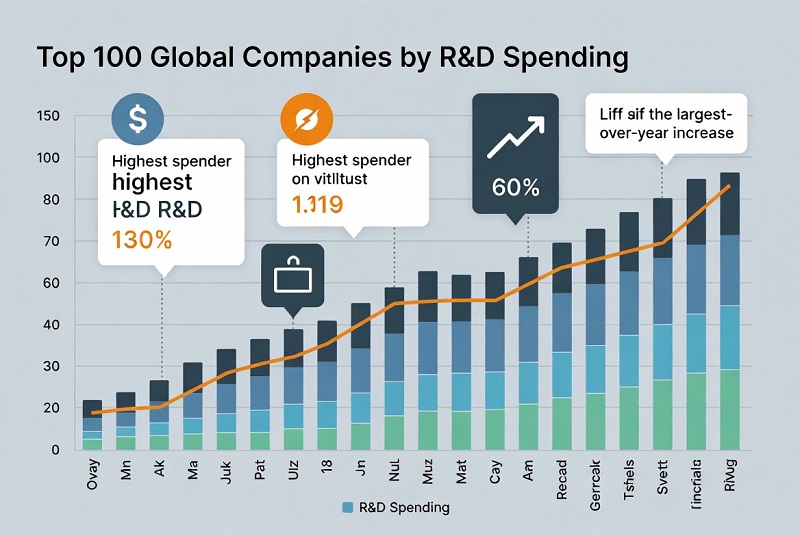
Top 100 Global Companies by R&D Spending
Corporate R&D investment: who spends the most (FY2024)
This page ranks the largest corporate investors in research and development using the EU Industrial R&D Investment Scoreboard 2025 (World 2000 database). The Scoreboard compiles R&D investment from published corporate accounts and harmonises it into a comparable framework.
FY2024 in the Scoreboard is not strictly calendar-year 2024. Depending on reporting calendars, year-ends can fall between late 2024 and mid‑2025 while still being labelled FY2024.
What stands out in the Top 100
Total Top‑100 R&D investment (FY2024)
€774.7bn
USD equivalent ≈ $804.8bn (FX: 1 EUR = 1.0389 USD (ECB reference rate, 31 Dec 2024))
Concentration within the Top 100
Top‑5: 27.74%
Top‑10: 40.56% · Top‑20: 54.99% of the Top‑100 total shown here.
YoY change (FY2024 vs prior year)
Median: 7.0%
R&D‑weighted average: 10.7% (large spenders drive the average).
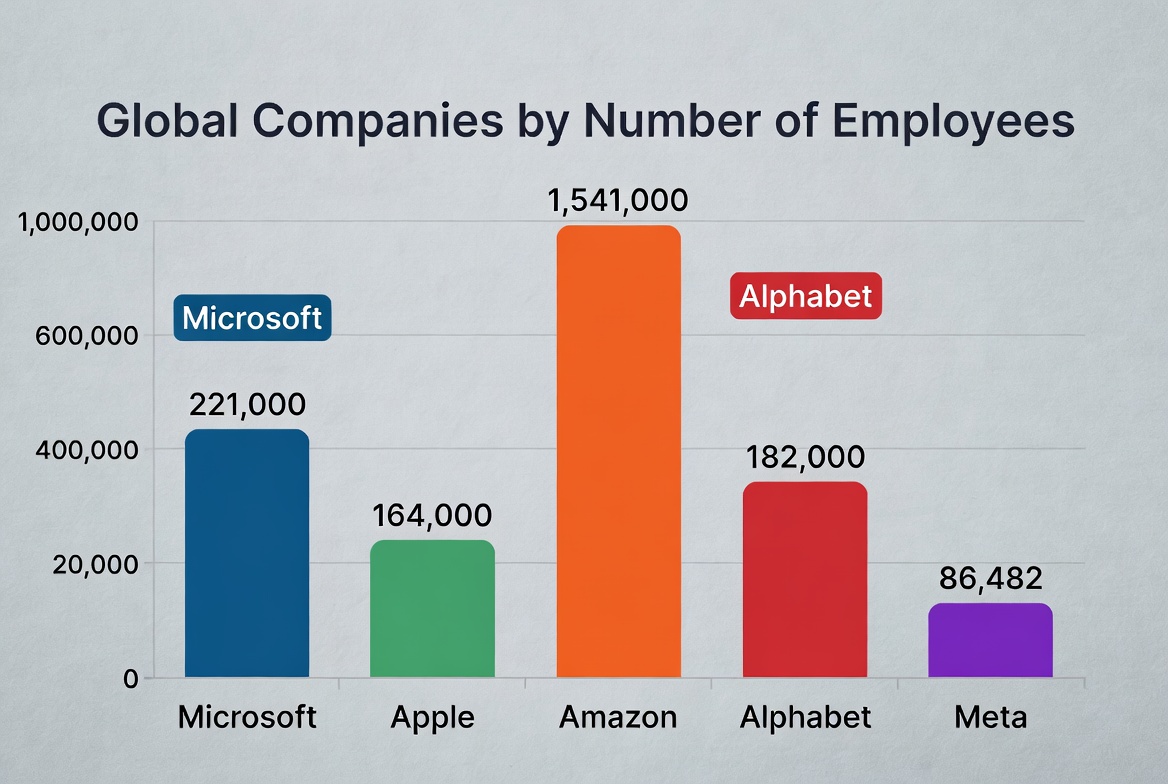
The Scoreboard notes that the top five investors (Amazon, Alphabet, Meta, Microsoft, Apple) now account for roughly 15% of total R&D investment across the global Top‑2000 sample.
Top 10 snapshot (FY2024)
Top 10 table
| Rank | Company | HQ | Sector | R&D (EUR, m) | R&D (USD, m) | YoY |
|---|---|---|---|---|---|---|
| 1 | AMAZON.COM, INC. | US | ICT services | €65,318.3m | $67,859.2m | +10.3% |
| 2 | ALPHABET INC. | US | ICT services | €46,131.5m | $47,926.0m | +9.6% |
| 3 | META PLATFORMS, INC. | US | ICT services | €41,985.8m | $43,619.0m | +19.5% |
| 4 | MICROSOFT CORPORATION | US | ICT services | €31,271.5m | $32,488.0m | +10.1% |
| 5 | APPLE INC. | US | ICT producers | €30,195.4m | $31,370.0m | +4.9% |
| 6 | HUAWEI INVESTMENT & HOLDING CO., LTD. | CN | ICT producers | €22,941.2m | $23,833.6m | +10.5% |
| 7 | SAMSUNG ELECTRONICS CO.,LTD. | KR | ICT producers | €22,842.5m | $23,731.0m | +23.5% |
| 8 | VOLKSWAGEN AG | DE | Automobiles & Parts | €20,998.0m | $21,815.0m | +6.5% |
| 9 | JOHNSON & JOHNSON | US | Health industries | €16,586.8m | $17,232.0m | +14.2% |
| 10 | INTEL CORP | US | ICT producers | €15,926.5m | $16,546.0m | +3.1% |
Chart 1. Top 20 companies by R&D investment (FY2024)
Bars show R&D investment in € billions (converted from € millions). The table fallback stays visible if the chart cannot be drawn.
| Rank | Company | HQ | Sector | R&D (EUR, m) |
|---|---|---|---|---|
| 1 | AMAZON.COM, INC. | US | ICT services | €65,318.3m |
| 2 | ALPHABET INC. | US | ICT services | €46,131.5m |
| 3 | META PLATFORMS, INC. | US | ICT services | €41,985.8m |
| 4 | MICROSOFT CORPORATION | US | ICT services | €31,271.5m |
| 5 | APPLE INC. | US | ICT producers | €30,195.4m |
| 6 | HUAWEI INVESTMENT & HOLDING CO., LTD. | CN | ICT producers | €22,941.2m |
| 7 | SAMSUNG ELECTRONICS CO.,LTD. | KR | ICT producers | €22,842.5m |
| 8 | VOLKSWAGEN AG | DE | Automobiles & Parts | €20,998.0m |
| 9 | JOHNSON & JOHNSON | US | Health industries | €16,586.8m |
| 10 | INTEL CORP | US | ICT producers | €15,926.5m |
| 11 | MERCK & CO., INC. | US | Health industries | €14,613.5m |
| 12 | ROCHE HOLDING AG | CH | Health industries | €13,856.8m |
| 13 | NVIDIA CORP | US | ICT producers | €12,430.5m |
| 14 | ASTRAZENECA PLC | GB | Health industries | €12,032.9m |
| 15 | ELI LILLY AND COMPANY | US | Health industries | €10,579.1m |
| 16 | PFIZER INC | US | Health industries | €10,335.9m |
| 17 | MERCEDES-BENZ GROUP AG | DE | Automobiles & Parts | €9,698.0m |
| 18 | ORACLE CORP | US | ICT services | €9,490.8m |
| 19 | BRISTOL-MYERS SQUIBB COMPANY | US | Health industries | €9,415.7m |
| 20 | TENCENT HOLDINGS LIMITED | CN | ICT services | €9,321.3m |
Methodology (how the Scoreboard defines “R&D investment”)
The Scoreboard is not a survey. It is built from publicly available audited financial statements and annual reports, then harmonised into a single dataset for benchmarking.
- Headline metric. “R&D investment” aims to approximate a company’s monetary investment in R&D. Where disclosures allow, the Scoreboard may adjust reported figures (for example, capitalised development, depreciation of capitalised development, and third‑party funded R&D). Where disclosures are insufficient, the dataset can rely on the “face value” reported in accounts.
- Currency. Financials are published in euros. Foreign-currency values are converted using a year‑end exchange rate for the edition (closing date 31.12.2024). This page also shows a USD equivalent using the same year‑end reference rate (1 EUR = 1.0389 USD (ECB reference rate, 31 Dec 2024)).
- Fiscal-year comparability. FY2024 is a Scoreboard label and can cover different reporting calendars across firms. For cross-checking with primary filings, the relevant accounting period must match the Scoreboard’s fiscal-year mapping.
- Data note. The World2000 machine extract can include naming variants for the same issuer (for example, legal-suffix differences). In this Top‑100 view, such cases are flagged as “name variant” in the table to avoid confusion.
How to read the ranking
- Scale vs growth are different signals. A firm can be a top spender with modest YoY growth, while a smaller spender can grow rapidly from a lower base.
- Sector structure matters. Semiconductors, life sciences, and automotive platforms naturally sustain high R&D totals because development cycles are long and capital-intensive; cloud and software platforms scale R&D with infrastructure and product breadth.
- R&D is an input, not an outcome. High investment supports pipelines and capability-building, but it does not guarantee commercial success or shareholder returns on its own.
FAQ
Why does Amazon rank #1 in this Scoreboard edition?
In the 2025 Scoreboard, Amazon appears in the World2000 ranking with an estimated R&D investment value, which places it at the top of the FY2024 list.
Is “R&D investment” the same as “R&D expense” in the income statement?
Not necessarily. The Scoreboard’s R&D investment metric can incorporate adjustments (e.g., how capitalised development is treated) to better represent monetary investment in R&D. For some companies it matches reported R&D closely; for others it can differ depending on disclosures and accounting.
Are these numbers comparable across countries?
They are comparable in the Scoreboard’s harmonised framework, but readers should be cautious: accounting rules, disclosure depth, treatment of development costs, and fiscal-year timing can differ across jurisdictions and companies.
Why show both EUR and USD?
The Scoreboard publishes in EUR, so EUR is the reference. USD is provided for convenience using the same year‑end rate so that readers can compare magnitudes in a familiar currency without mixing inconsistent FX conventions.
Does higher R&D always mean a company is more innovative?
Higher R&D investment indicates greater resource commitment, but innovation also depends on execution, product-market fit, IP strategy, and time-to-market. A smaller spender can still deliver breakthrough outcomes; the ranking is about input scale.
What does the “Share” toggle mean in the Top‑100 table?
“Share” is each company’s share of the Top‑100 total R&D investment shown in this page (not a share of global R&D).
Full Top 100 table (FY2024) — with search, sort and filters
Use the tools below to search companies, filter by HQ region (simplified) or sector, sort by R&D scale vs YoY growth, and switch between EUR units and each firm’s share of the Top‑100 total.
| Rank | Company | HQ | Sector | R&D (EUR, m) / Share | R&D (USD, m) | YoY | Δ rank |
|---|---|---|---|---|---|---|---|
| 1 | AMAZON.COM, INC. | US | ICT services | €65,318.3m 8.43% | $67,859.2m — | +10.3% | 0 |
| 2 | ALPHABET INC. | US | ICT services | €46,131.5m 5.96% | $47,926.0m — | +9.6% | 0 |
| 3 | META PLATFORMS, INC. | US | ICT services | €41,985.8m 5.42% | $43,619.0m — | +19.5% | 0 |
| 4 | MICROSOFT CORPORATION | US | ICT services | €31,271.5m 4.04% | $32,488.0m — | +10.1% | +1 |
| 5 | APPLE INC. | US | ICT producers | €30,195.4m 3.90% | $31,370.0m — | +4.9% | −1 |
| 6 | HUAWEI INVESTMENT & HOLDING CO., LTD. | CN | ICT producers | €22,941.2m 2.96% | $23,833.6m — | +10.5% | 0 |
| 7 | SAMSUNG ELECTRONICS CO.,LTD. | KR | ICT producers | €22,842.5m 2.95% | $23,731.0m — | +23.5% | 0 |
| 8 | VOLKSWAGEN AG | DE | Automobiles & Parts | €20,998.0m 2.71% | $21,815.0m — | +6.5% | 0 |
| 9 | JOHNSON & JOHNSON | US | Health industries | €16,586.8m 2.14% | $17,232.0m — | +14.2% | 0 |
| 10 | INTEL CORP | US | ICT producers | €15,926.5m 2.06% | $16,546.0m — | +3.1% | 0 |
| 11 | MERCK & CO., INC. | US | Health industries | €14,613.5m 1.89% | $15,182.2m — | +16.3% | 0 |
| 12 | ROCHE HOLDING AG | CH | Health industries | €13,856.8m 1.79% | $14,395.9m — | +6.4% | 0 |
| 13 | NVIDIA CORPname variant | US | ICT producers | €12,430.5m 1.60% | $12,914.1m — | +48.9% | 0 |
| 14 | ASTRAZENECA PLC | GB | Health industries | €12,032.9m 1.55% | $12,501.5m — | +13.4% | 0 |
| 15 | ELI LILLY AND COMPANY | US | Health industries | €10,579.1m 1.37% | $10,990.7m — | +12.7% | 0 |
| 16 | PFIZER INC | US | Health industries | €10,335.9m 1.33% | $10,738.1m — | +2.6% | 0 |
| 17 | MERCEDES-BENZ GROUP AG | DE | Automobiles & Parts | €9,698.0m 1.25% | $10,075.2m — | +5.9% | 0 |
| 18 | ORACLE CORP | US | ICT services | €9,490.8m 1.23% | $9,859.9m — | +7.7% | 0 |
| 19 | BRISTOL-MYERS SQUIBB COMPANY | US | Health industries | €9,415.7m 1.22% | $9,782.0m — | +3.8% | 0 |
| 20 | TENCENT HOLDINGS LIMITED | CN | ICT services | €9,321.3m 1.20% | $9,684.0m — | +4.2% | 0 |
| 21 | BAYERISCHE MOTOREN WERKE AG | DE | Automobiles & Parts | €9,078.0m 1.17% | $9,431.1m — | +1.4% | 0 |
| 22 | BROADCOM INC. | US | ICT producers | €8,961.4m 1.16% | $9,310.0m — | +77.2% | +5 |
| 23 | NOVARTIS AG | CH | Health industries | €8,953.7m 1.16% | $9,302.0m — | +1.9% | −2 |
| 24 | GENERAL MOTORS COMPANY | US | Automobiles & Parts | €8,855.5m 1.14% | $9,200.0m — | -7.1% | −1 |
| 25 | QUALCOMM INC | US | ICT producers | €8,560.0m 1.10% | $8,893.3m — | +14.5% | 0 |
| 26 | TOYOTA MOTOR CORPORATION | JP | Automobiles & Parts | €8,135.0m 1.05% | $8,451.6m — | +10.3% | 0 |
| 27 | ABBVIE INC. | US | Health industries | €8,003.7m 1.03% | $8,314.3m — | +10.8% | +1 |
| 28 | ROBERT BOSCH GESELLSCHAFT MIT BESCHRAENKTER HAFTUNG | DE | Automobiles & Parts | €7,954.0m 1.03% | $8,263.1m — | +3.7% | −1 |
| 29 | FORD MOTOR CO | US | Automobiles & Parts | €7,700.5m 0.99% | $8,000.0m — | +7.6% | 0 |
| 30 | IBM CORP | US | ICT services | €7,684.1m 0.99% | $7,983.0m — | +3.4% | 0 |
| 31 | HYUNDAI MOTOR COMPANY | KR | Automobiles & Parts | €7,611.3m 0.98% | $7,907.6m — | +5.5% | 0 |
| 32 | HONDA MOTOR CO., LTD. | JP | Automobiles & Parts | €7,571.5m 0.98% | $7,866.3m — | +24.0% | 0 |
| 33 | SIEMENS AG | DE | Industrials | €7,110.0m 0.92% | $7,386.7m — | +8.3% | +2 |
| 34 | BOE TECHNOLOGY GROUP CO., LTD. | CN | ICT producers | €7,018.6m 0.91% | $7,291.8m — | +7.6% | −2 |
| 35 | STELLANTIS N.V. | NL | Automobiles & Parts | €6,928.0m 0.89% | $7,197.3m — | -8.4% | +1 |
| 36 | TSMC | TW | ICT producers | €6,667.6m 0.86% | $6,927.1m — | +7.3% | −1 |
| 37 | BYD COMPANY LIMITED | CN | Automobiles & Parts | €6,594.3m 0.85% | $6,851.0m — | +35.6% | +2 |
| 38 | BEIJING AUTOMOTIVE GROUP CO., LTD. | CN | Automobiles & Parts | €6,548.3m 0.85% | $6,803.2m — | +8.4% | −2 |
| 39 | SONY GROUP CORPORATION | JP | ICT producers | €6,452.9m 0.83% | $6,704.1m — | +4.6% | 0 |
| 40 | SAIC MOTOR CORPORATION LIMITED | CN | Automobiles & Parts | €6,300.6m 0.81% | $6,545.8m — | +1.8% | 0 |
| 41 | INTUIT INC. | US | ICT services | €6,192.2m 0.80% | $6,433.2m — | +9.1% | 0 |
| 42 | CHINA STATE CONSTRUCTION ENGINEERING CORPORATION LIMITED | CN | Construction & Materials | €5,823.0m 0.75% | $6,049.6m — | +4.9% | 0 |
| 43 | DONGFENG MOTOR CORPORATION | CN | Automobiles & Parts | €5,750.0m 0.74% | $5,973.7m — | 0.0% | 0 |
| 44 | AMGEN INCORPORATED | US | Health industries | €5,744.1m 0.74% | $5,967.6m — | +25.4% | +5 |
| 45 | BASF SE | DE | Construction & Materials | €5,605.0m 0.72% | $5,823.1m — | +2.0% | 0 |
| 46 | SAP SE | DE | ICT services | €5,586.0m 0.72% | $5,803.4m — | -15.4% | −1 |
| 47 | BOEING COMPANY | US | Aerospace & Defence | €5,286.1m 0.68% | $5,491.9m — | +2.6% | −1 |
| 48 | NOVO NORDISK A/S | DK | Health industries | €5,098.2m 0.66% | $5,296.5m — | +29.4% | +6 |
| 49 | TAIWAN SEMICONDUCTOR MANUFACTURING COMPANY LIMITED | TW | ICT producers | €5,061.8m 0.65% | $5,258.7m — | +7.3% | −1 |
| 50 | SANOFI | FR | Health industries | €5,060.0m 0.65% | $5,256.8m — | +9.5% | 0 |
| 51 | GSK PLC | GB | Health industries | €4,921.8m 0.64% | $5,113.2m — | +8.5% | 0 |
| 52 | ABB LTD | CH | Industrials | €4,865.0m 0.63% | $5,054.2m — | +12.0% | 0 |
| 53 | DELL TECHNOLOGIES INC. | US | ICT producers | €4,846.7m 0.63% | $5,035.2m — | +5.0% | 0 |
| 54 | TATA CONSULTANCY SERVICES LIMITED | IN | ICT services | €4,809.1m 0.62% | $4,997.1m — | +6.2% | 0 |
| 55 | NOKIA OYJ | FI | ICT producers | €4,377.0m 0.57% | $4,547.3m — | +9.4% | +1 |
| 56 | MODERNA, INC. | US | Health industries | €4,352.7m 0.56% | $4,522.1m — | -4.5% | −2 |
| 57 | CHINA MOBILE LIMITED | CN | ICT services | €4,314.5m 0.56% | $4,482.5m — | -3.9% | 0 |
| 58 | ERICSSON (L.M.) TELEFONAKTIEBOLAG | SE | ICT producers | €4,184.0m 0.54% | $4,346.9m — | +2.7% | 0 |
| 59 | AIRBUS SE | FR | Aerospace & Defence | €4,098.0m 0.53% | $4,257.4m — | +7.6% | 0 |
| 60 | BAYER AG | DE | Health industries | €4,040.0m 0.52% | $4,197.1m — | +1.0% | 0 |
| 61 | NESTLE SA | CH | Health industries | €3,953.7m 0.51% | $4,107.3m — | +6.0% | 0 |
| 62 | TATA MOTORS LIMITED | IN | Automobiles & Parts | €3,714.3m 0.48% | $3,858.9m — | +24.2% | +7 |
| 63 | CHINA COMMUNICATIONS CONSTRUCTION COMPANY LIMITED | CN | Construction & Materials | €3,677.0m 0.47% | $3,820.4m — | -4.8% | −1 |
| 64 | BHP GROUP LIMITED | AU | Energy | €2,569.0m 0.33% | $2,669.0m — | +6.8% | 0 |
| 65 | INCYTE CORPORATIONname variant | US | Health industries | €2,514.7m 0.32% | $2,612.6m — | +59.5% | +9 |
| 66 | CHINA RAILWAY GROUP LIMITED | CN | Construction & Materials | €2,461.2m 0.32% | $2,556.9m — | -11.3% | −1 |
| 67 | ZTE CORPORATION | CN | ICT producers | €2,443.0m 0.32% | $2,538.1m — | -9.8% | 0 |
| 68 | BAIDU, INC. | CN | ICT services | €2,438.2m 0.31% | $2,533.0m — | -8.5% | −1 |
| 69 | CHINA RAILWAY CONSTRUCTION CORPORATION LIMITED | CN | Construction & Materials | €2,416.4m 0.31% | $2,510.3m — | -3.8% | 0 |
| 70 | CHINA PETROLEUM & CHEMICAL CORPORATION | CN | Energy | €2,367.3m 0.31% | $2,459.5m — | +6.9% | 0 |
| 71 | BAOSHAN IRON & STEEL COMPANY LIMITED | CN | Construction & Materials | €2,357.5m 0.30% | $2,449.4m — | +27.7% | +3 |
| 72 | XIAOMI CORPORATION | CN | ICT producers | €2,349.6m 0.30% | $2,441.3m — | +31.3% | +3 |
| 73 | SCHNEIDER ELECTRIC SE | FR | Industrials | €2,336.0m 0.30% | $2,426.9m — | +6.2% | 0 |
| 74 | GE HEALTHCARE TECHNOLOGIES INC. | US | Health industries | €2,329.1m 0.30% | $2,419.8m — | +9.5% | 0 |
| 75 | SALESFORCE, INC. | US | ICT services | €2,318.7m 0.30% | $2,409.4m — | +4.6% | 0 |
| 76 | L'OREAL | FR | Health industries | €2,292.0m 0.30% | $2,381.2m — | +10.6% | 0 |
| 77 | COMCAST CORPORATION | US | ICT services | €2,287.0m 0.30% | $2,376.0m — | +6.8% | 0 |
| 78 | NTT DATA GROUP CORPORATION | JP | ICT services | €2,279.3m 0.29% | $2,368.9m — | +9.8% | 0 |
| 79 | NATIONAL GRID PLC | GB | Energy | €2,268.0m 0.29% | $2,356.3m — | +7.7% | 0 |
| 80 | RIO TINTO LIMITED | AU | Energy | €2,260.0m 0.29% | $2,347.0m — | +6.0% | 0 |
| 81 | INFINEON TECHNOLOGIES AG | DE | ICT producers | €2,252.0m 0.29% | $2,339.6m — | +9.7% | 0 |
| 82 | VINCI | FR | Construction & Materials | €2,246.0m 0.29% | $2,333.4m — | +2.0% | 0 |
| 83 | HITACHI, LTD. | JP | Industrials | €2,238.0m 0.29% | $2,325.1m — | +7.4% | 0 |
| 84 | MITSUBISHI ELECTRIC CORPORATION | JP | ICT producers | €2,233.0m 0.29% | $2,320.0m — | +5.3% | 0 |
| 85 | DENSO CORPORATION | JP | Automobiles & Parts | €2,228.2m 0.29% | $2,314.9m — | +7.1% | 0 |
| 86 | PANASONIC HOLDINGS CORPORATION | JP | ICT producers | €2,220.0m 0.29% | $2,306.5m — | +4.2% | 0 |
| 87 | LG ELECTRONICS INC. | KR | ICT producers | €2,218.9m 0.29% | $2,305.3m — | +5.5% | 0 |
| 88 | BAE SYSTEMS PLC | GB | Aerospace & Defence | €2,210.0m 0.29% | $2,296.4m — | +8.5% | 0 |
| 89 | CANON INC. | JP | ICT producers | €2,206.0m 0.28% | $2,292.3m — | +4.6% | 0 |
| 90 | NVIDIA CORPORATIONname variant | US | ICT producers | €2,200.0m 0.28% | $2,286.0m — | +10.0% | 0 |
| 91 | MITSUBISHI HEAVY INDUSTRIES, LTD. | JP | Industrials | €2,196.0m 0.28% | $2,281.9m — | +8.0% | 0 |
| 92 | SAMSUNG SDI CO., LTD. | KR | ICT producers | €2,190.0m 0.28% | $2,275.9m — | +12.0% | 0 |
| 93 | NXP SEMICONDUCTORS N.V. | NL | ICT producers | €2,188.0m 0.28% | $2,273.9m — | +6.4% | 0 |
| 94 | KDDI CORPORATION | JP | ICT services | €2,180.0m 0.28% | $2,265.7m — | +5.0% | 0 |
| 95 | FUJITSU LIMITED | JP | ICT services | €2,177.0m 0.28% | $2,262.6m — | +7.0% | 0 |
| 96 | ABBOTT LABORATORIES | US | Health industries | €2,174.0m 0.28% | $2,259.4m — | +6.0% | 0 |
| 97 | EDWARDS LIFESCIENCES CORPORATION | US | Health industries | €2,168.0m 0.28% | $2,253.4m — | +8.0% | 0 |
| 98 | HONEYWELL INTERNATIONAL INC. | US | Industrials | €2,160.0m 0.28% | $2,245.0m — | +7.0% | 0 |
| 99 | TEXAS INSTRUMENTS INCORPORATED | US | ICT producers | €2,155.0m 0.28% | $2,240.0m — | +6.0% | 0 |
| 100 | INCYTE CORPORATIONname variant | US | Health industries | €2,514.7m 0.32% | $2,612.6m — | +59.5% | +9 |
Region is a simplified grouping by HQ country (for navigation and filtering only). “Name variant” flags indicate issuer naming variants observed in the machine extract.
Chart 2. R&D scale vs YoY growth (scatter)
Each point is a company line from the Top‑100 extract. X = R&D investment (€bn). Y = YoY change (%).
Scatter chart unavailable. Quick read: median YoY is 7.0%, and the R&D‑weighted average is 10.7% (large spenders lift the average).
How to interpret the ranking
The Scoreboard’s Top‑100 list is a view of corporate R&D inputs: it shows where large, sustained research and development budgets sit in the global economy. Interpretation improves when you separate three things: absolute scale, growth rate, and sector structure.
- Do not over-interpret rank changes. A small change in reported R&D can move firms several positions in the mid‑table where values are tightly clustered.
- Accounting and disclosure matter. Capitalised development and different disclosure practices can affect comparability even after harmonisation.
- Use the list as a map. For analysts and policymakers, it is a practical way to see where private-sector innovation capacity is concentrated by industry and geography.
Chart 3. R&D by sector (Top‑100 total)
Totals are sums of FY2024 R&D investment (EUR) for companies in each sector within the Top‑100 extract.
| Sector | Total R&D (€bn) |
|---|---|
| ICT services | €245.785bn |
| ICT producers | €185.122bn |
| Health industries | €151.541bn |
| Automobiles & Parts | €125.665bn |
| Construction & Materials | €24.586bn |
| Industrials | €20.905bn |
| Aerospace & Defence | €11.594bn |
| Energy | €9.464bn |
Policy takeaways
- Innovation capacity is concentrated. A small set of firms and sectors set the pace for frontier technologies; shocks to these ecosystems can ripple globally.
- Scale and resilience depend on supply chains. Semiconductor and AI infrastructure investment highlights why capability-building is tied to energy, skills, and critical inputs.
- Measurement needs transparency. Cross-company comparability benefits from consistent disclosure of R&D composition (capitalised vs expensed) and third‑party funded components.
- Link incentives to outcomes carefully. High R&D budgets do not automatically translate into productivity or diffusion; complementary policy (competition, standards, procurement, talent) matters.
Sources
Official sources used for the dataset and for spot-checking with primary corporate filings.
- EU Industrial R&D Investment Scoreboard 2025 (JRC)Landing page with overview, key findings, and links to the Scoreboard release.
- Scoreboard data downloads (IRI/JRC)Official download page for the World 2000 and EU 800 datasets.
- Scoreboard 2025 report (JRC)Report record page (includes the PDF; methodology and definitions).
- ECB EUR/USD reference rate (31 Dec 2024)Year‑end reference FX rate used for the EUR→USD conversion shown on this page.
- Apple Form 10‑K (FY2024)Primary annual filing used for cross‑checking reported R&D and accounting period.
- Intel Form 10‑K (FY2024)Primary annual filing used for cross‑checking reported R&D and fiscal year mapping.
- Johnson & Johnson annual filing (FY2024)Primary filing for cross‑checking R&D disclosure and period timing.
- Samsung consolidated report (FY2024 PDF)Company report used for cross‑checking KRW-based R&D reporting.
- Huawei Annual Report 2024Company report used for cross‑checking disclosed R&D and accounting treatment.
- Toyota Form 20‑F (FY2025 filing PDF)Primary filing used for cross‑checking R&D disclosure and fiscal-year alignment.
- Volkswagen Annual Report 2024 — R&D sectionCompany R&D section used for spot-checking reported R&D and definitions.
- Meta Form 10‑K (FY2024)Primary annual filing used for spot-checking reported R&D and period coverage.
Download: Top 100 Global Companies by R&D Spending (FY2024) — dataset + charts
One ZIP package with the Top-100 table (CSV + Excel) and chart images (PNG) used in this ranking page.
-
Data tables Top-100 (CSV + XLSX) and a Top-10 extract, with EUR and USD values, YoY %, and share of Top-100 total.
-
Charts (PNG) Top-20 bar chart, scatter (scale vs YoY), and sector totals chart — ready to reuse in posts or socials.
-
README Short notes on metric definition (Scoreboard “R&D investment”), FX treatment, and share calculation.