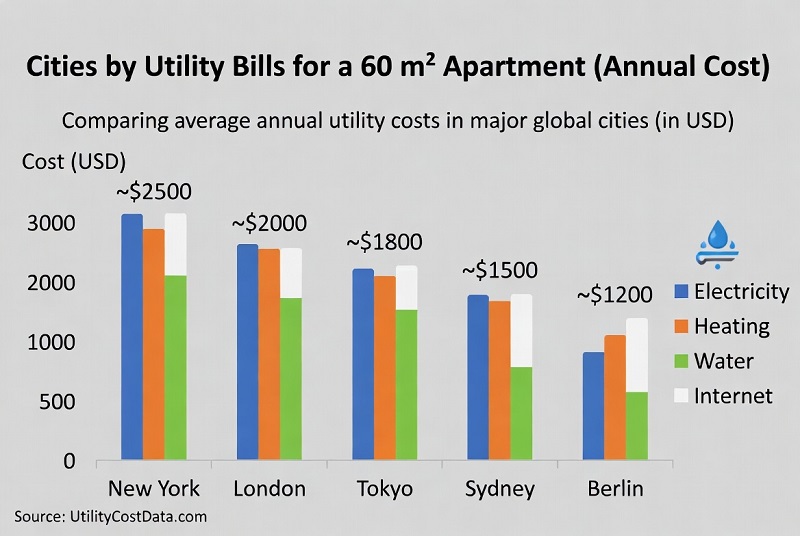
Top Countries by Utility Cost for a 60 m² Apartment (Annual Energy Benchmark, 2024)
A “utility bill” is not a single globally standardized metric. Some countries include fixed standing charges, district heating fees, and municipal services (water and waste) in different places: on utility invoices, in local taxes, or bundled into rent. Because there is no single harmonised government dataset that reports a full, all-in apartment utility bill across dozens of countries, this page uses official household energy price statistics and a transparent, replicable consumption model to create a comparable benchmark.
What it is: a country-to-country benchmark based on official household electricity prices (and gas where available),
converted into an annual cost for a standard apartment-sized household profile.
What it is not: a promise of your exact invoice or a complete “utilities” bundle that includes water/waste, district heating, or HOA/building fees.
Use it to compare countries consistently, then validate locally for your city and building type.
Jump to
Method & assumptions · Top 10 charts · Full tables · Primary sources
FAQ (7 questions)
Short answers to the most common questions about how this benchmark is computed and how to interpret it.
1) What exactly is being ranked?
2) Which official data sources are used?
3) What consumption is assumed for a ≈60 m² apartment?
4) Are taxes and levies included in the prices?
5) Why can my real bill be higher or lower than the benchmark?
6) Which year does this reflect and how are averages computed?
7) How are currencies handled for cross-country comparison?
What is included + the calculation model
This ranking is built to avoid “invented” country totals. It uses official household energy price statistics and a transparent consumption model. The result is an energy utilities benchmark for a standard ≈60 m² apartment — not a promise of your exact bill.
Included: household electricity (all countries in the electricity table) and, where available, household piped natural gas
(dual-fuel scenario). Prices include taxes and levies in the official series.
Not included: water and waste tariffs, district heating charges, building service/HOA fees, and address-specific standing charges
that are not available in a single harmonised official dataset across dozens of countries.
| Model input | Value used | Notes |
|---|---|---|
| Electricity consumption | 3,500 kWh/year | Matches Eurostat’s published household consumption band 2,500–5,000 kWh. |
| Gas consumption (dual-fuel) | 30 GJ/year ≈ 8,333 kWh | A modest heating/hot-water proxy within Eurostat’s household band (20–200 GJ). |
| Reference period | 2024 average | Eurostat: mean of 2024S1 and 2024S2. UK DESNZ/IEA: 2024 annual value (pence per kWh). |
| Currency | USD | Converted using 2024 annual average ECB reference rates published by the Central Bank of Malta. |
Interpretation: this is an energy-only utilities benchmark. If your apartment uses district heating (not gas), or if water/waste are large line items, your real “utilities” can be materially higher than the benchmark.
Top 10 countries — electricity-only vs dual-fuel
The bars below use black labels (≥16px) and are rendered as plain HTML so they remain visible even if external chart libraries fail.
Electricity-only (3,500 kWh/year) — Top 10
Dual-fuel energy (3,500 kWh electricity + 30 GJ gas) — Top 10
How to read: electricity-only ranks reflect household electricity price levels under the official consumption band. Dual-fuel ranks are more sensitive to gas prices and the assumed heating/hot-water proxy.
Full ranking tables
Electricity-only table uses Eurostat household electricity prices for reporting countries and adds UK DESNZ/IEA electricity prices for non-Eurostat countries included in that official dataset (e.g., United Kingdom, United States, Japan). Where a country appears in both, Eurostat is used.
Electricity-only ranking (Top 44)
| Rank | Country | USD/kWh (2024 avg) | Est. annual (3,500 kWh) |
|---|---|---|---|
| 1 | Germany | $0.43 | $1,495.28 |
| 2 | Denmark | $0.40 | $1,415.16 |
| 3 | United Kingdom | $0.39 | $1,362.47 |
| 4 | Czechia | $0.36 | $1,265.89 |
| 5 | Belgium | $0.36 | $1,262.86 |
| 6 | Cyprus | $0.35 | $1,229.71 |
| 7 | Italy | $0.35 | $1,209.45 |
| 8 | Liechtenstein | $0.34 | $1,192.40 |
| 9 | France | $0.31 | $1,093.52 |
| 10 | Ireland | $0.31 | $1,067.57 |
| 11 | Austria | $0.28 | $978.92 |
| 12 | Portugal | $0.27 | $956.95 |
| 13 | Spain | $0.26 | $917.55 |
| 14 | Latvia | $0.26 | $913.95 |
| 15 | Finland | $0.26 | $910.73 |
| 16 | Sweden | $0.26 | $906.37 |
| 17 | Netherlands | $0.25 | $884.40 |
| 18 | Luxembourg | $0.22 | $806.38 |
| 19 | Norway | $0.22 | $803.73 |
| 20 | Switzerland | $0.21 | $752.76 |
| 21 | Lithuania | $0.20 | $752.10 |
| 22 | Greece | $0.21 | $750.04 |
| 23 | Japan | $0.21 | $736.64 |
| 24 | New Zealand | $0.21 | $724.58 |
| 25 | Estonia | $0.24 | $716.71 |
| 26 | Slovenia | $0.22 | $776.17 |
| 27 | Poland | $0.20 | $686.05 |
| 28 | Slovakia | $0.18 | $643.28 |
| 29 | Romania | $0.18 | $624.09 |
| 30 | United States | $0.16 | $575.27 |
| 31 | Croatia | $0.16 | $518.61 |
| 32 | Serbia | $0.12 | $414.83 |
| 33 | Montenegro | $0.13 | $463.61 |
| 34 | Bosnia and Herzegovina | $0.10 | $333.00 |
| 35 | Bulgaria | $0.13 | $455.33 |
| 36 | Korea | $0.13 | $456.69 |
| 37 | Canada | $0.13 | $461.66 |
| 38 | Albania | $0.12 | $428.78 |
| 39 | North Macedonia | $0.11 | $397.46 |
| 40 | Iceland | $0.17 | $594.11 |
| 41 | Malta | $0.14 | $492.91 |
| 42 | Hungary | $0.12 | $402.71 |
| 43 | Georgia | $0.08 | $267.65 |
| 44 | Türkiye | $0.06 | $209.88 |
Dual-fuel energy ranking (Top 30)
Dual-fuel totals are computed for countries where both Eurostat electricity and Eurostat gas prices are available for 2024S1 and 2024S2.
| Rank | Country | Est. annual total | Gas share |
|---|---|---|---|
| 1 | Liechtenstein | $2,604.87 | 54% |
| 2 | Germany | $2,593.87 | 42% |
| 3 | Denmark | $2,558.85 | 45% |
| 4 | Sweden | $2,553.81 | 65% |
| 5 | Italy | $2,438.82 | 50% |
| 6 | Netherlands | $2,392.94 | 63% |
| 7 | Ireland | $2,248.24 | 53% |
| 8 | France | $2,233.60 | 51% |
| 9 | Czechia | $2,219.27 | 43% |
| 10 | Austria | $2,158.69 | 55% |
| 11 | Portugal | $2,110.56 | 55% |
| 12 | Belgium | $2,031.34 | 38% |
| 13 | Latvia | $1,727.07 | 47% |
| 14 | Spain | $1,710.83 | 46% |
| 15 | Slovenia | $1,623.02 | 52% |
| 16 | Lithuania | $1,594.43 | 53% |
| 17 | Norway | $1,547.44 | 48% |
| 18 | Greece | $1,410.42 | 52% |
| 19 | Luxembourg | $1,362.26 | 41% |
| 20 | Croatia | $1,115.31 | 53% |
| 21 | Romania | $1,103.32 | 43% |
| 22 | Bulgaria | $983.67 | 48% |
| 23 | Slovakia | $975.93 | 34% |
| 24 | Estonia | $1,372.99 | 48% |
| 25 | Albania | $768.63 | 45% |
| 26 | Serbia | $856.79 | 52% |
| 27 | Bosnia and Herzegovina | $806.53 | 59% |
| 28 | Hungary | $668.79 | 40% |
| 29 | Georgia | $424.59 | 37% |
| 30 | Türkiye | $379.45 | 45% |
| Rank | Country | Electricity | Gas |
|---|---|---|---|
| 1 | Liechtenstein | $1,192.40 | $1,412.48 |
| 2 | Germany | $1,495.28 | $1,098.59 |
| 3 | Denmark | $1,415.16 | $1,143.69 |
| 4 | Sweden | $906.37 | $1,647.44 |
| 5 | Italy | $1,209.45 | $1,229.38 |
| 6 | Netherlands | $884.40 | $1,508.53 |
| 7 | Ireland | $1,067.57 | $1,180.67 |
| 8 | France | $1,093.52 | $1,140.08 |
| 9 | Czechia | $1,265.89 | $953.38 |
| 10 | Austria | $978.92 | $1,179.77 |
| 11 | Portugal | $956.95 | $1,153.61 |
| 12 | Belgium | $1,262.86 | $768.47 |
| 13 | Latvia | $913.95 | $813.12 |
| 14 | Spain | $917.55 | $793.28 |
| 15 | Slovenia | $774.73 | $848.30 |
| 16 | Lithuania | $752.10 | $842.33 |
| 17 | Norway | $803.73 | $743.71 |
| 18 | Greece | $750.04 | $660.38 |
| 19 | Luxembourg | $806.38 | $555.88 |
| 20 | Croatia | $518.61 | $596.70 |
| 21 | Romania | $624.09 | $479.23 |
| 22 | Bulgaria | $455.33 | $528.34 |
| 23 | Slovakia | $643.28 | $332.65 |
| 24 | Estonia | $716.71 | $656.28 |
| 25 | Albania | $428.78 | $339.85 |
| 26 | Serbia | $414.83 | $441.96 |
| 27 | Bosnia and Herzegovina | $333.00 | $473.53 |
| 28 | Hungary | $402.71 | $266.08 |
| 29 | Georgia | $267.65 | $156.94 |
| 30 | Türkiye | $209.88 | $169.57 |
Reality check: apartment bills can be higher where standing charges are large, where district heating replaces gas, or where water/waste are billed separately. Use the tables as a consistent cross-country baseline, then validate locally for your building type and heating system.
What the primary sources are
These are the direct primary sources used to compute the rankings. Each is an official publication or official data table.
-
Eurostat — Electricity price statistics (households, incl. taxes/levies).
€/kWh household electricity prices by country and semester; benchmark averages 2024S1 and 2024S2 for the household band 2,500–5,000 kWh.
https://ec.europa.eu/eurostat/statistics-explained/index.php/Electricity_price_statistics -
Eurostat — Natural gas price statistics (households, incl. taxes/levies).
€/kWh household natural gas prices by country and semester; dual-fuel scenario averages 2024S1 and 2024S2 within the household band 20–200 GJ.
https://ec.europa.eu/eurostat/statistics-explained/index.php/Natural_gas_price_statistics -
UK Government (DESNZ) — International domestic energy prices.
Official UK government page hosting downloadable data tables; Table 5.5.1 reports domestic electricity prices in the IEA in pence per kWh (including taxes).
https://www.gov.uk/government/statistical-data-sets/international-domestic-energy-prices -
UK Government (DESNZ) — Table 5.5.1 (XLSX).
The specific spreadsheet used for non-Eurostat electricity prices (United Kingdom, United States, Japan, Canada, Korea, New Zealand).
https://assets.publishing.service.gov.uk/media/68da5c568c1db6022d0c9e55/table_551.xlsx -
Central Bank of Malta — 2024 annual average ECB reference exchange rates of the Euro.
Used to convert €/kWh into USD/kWh and to derive GBP→USD conversion via GBP per EUR and USD per EUR annual averages (2024).
https://mtca.gov.mt/docs/default-source/documents/legislative-developments/2025/2024-annual-average-exchange-rates-pdf.pdf