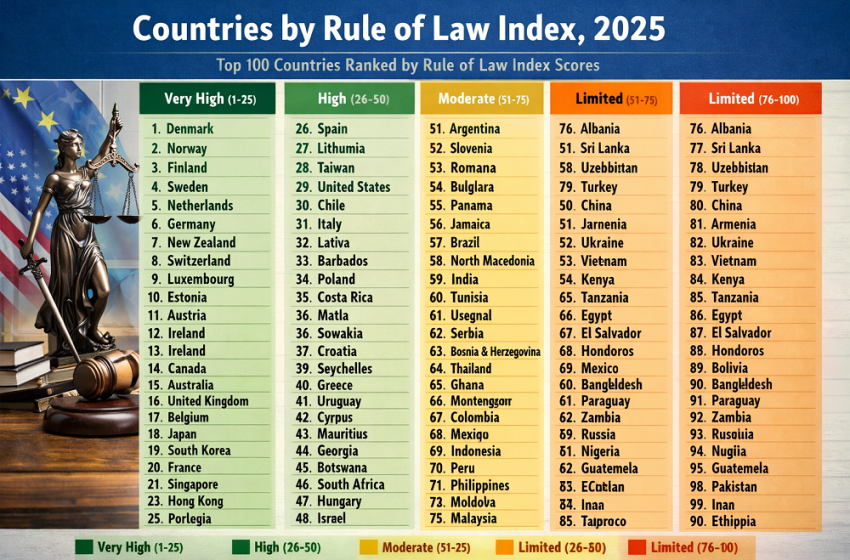
Top 100 Countries by Rule of Law Index, 2025
The 2025 World Justice Project Rule of Law Index is a practical cross-country benchmark for institutional quality. It helps answer questions that matter outside academic debate: whether courts can resolve disputes without political pressure, whether regulators act predictably, whether rights are enforceable in practice, and whether public power is constrained by rules rather than by discretion.
The 2025 edition covers 143 countries and jurisdictions on a 0 to 1 scale, where higher is better. Denmark remains first, followed by Norway, Finland, Sweden, and New Zealand. That top tier matters because it usually reflects more than a generic “clean country” reputation: contracts are easier to enforce, public administration is more consistent, and the gap between formal law and day-to-day enforcement is narrower than in the global median. For investors, founders, relocation-minded readers, and compliance teams, that difference is often more important than headlines about growth or politics alone.
Top 10 countries in the 2025 ranking
The top of the table is dominated by countries that have spent decades building institutional reliability, not just public order. The common pattern is broader than low corruption alone: strong executive constraints, courts that retain public credibility, administrative systems that usually work without arbitrary interference, and civil justice channels that remain usable for ordinary people and businesses. That is why a relatively small group of countries keeps appearing near the top year after year.
Denmark
The global leader again, combining judicial independence, clean administration, and strong checks on power.
Norway
A consistently top-performing Nordic system with very strong governance and low corruption risk.
Finland
Exceptional institutional quality, though 2025 still showed a slight score decline.
Sweden
A high-capacity state with strong civil liberties and public-sector integrity.
New Zealand
The best-ranked non-European country in the global table.
Germany
A large advanced economy that pairs legal predictability with strong administrative capacity.
Luxembourg
Very high performance across open government, order, and justice delivery.
Ireland
Strong upward movement in 2025 and a resilient common-law institutional base.
Netherlands
Still top-10 despite a sharper yearly decline than most peers.
Estonia
One of the clearest Central and Eastern European success stories in the Index.
Table 1. Top 10 by Rule of Law score
| Rank | Country | Score | Annual change |
|---|---|---|---|
| 1 | Denmark | 0.90 | -0.2% |
| 2 | Norway | 0.89 | -0.2% |
| 3 | Finland | 0.87 | -0.5% |
| 4 | Sweden | 0.85 | -0.5% |
| 5 | New Zealand | 0.83 | 0.0% |
| 6 | Germany | 0.83 | -0.1% |
| 7 | Luxembourg | 0.83 | 0.0% |
| 8 | Ireland | 0.82 | 0.4% |
| 9 | Netherlands | 0.82 | -0.7% |
| 10 | Estonia | 0.82 | 0.2% |
Higher scores indicate stronger performance across the eight rule-of-law factors used by WJP.
Chart 1. Top 20 countries by Rule of Law Index score
The top 20 is tight. The distance from rank 5 to rank 20 is much smaller than many readers expect, which is why small year-on-year shifts can move a country several positions even when the underlying score changes only slightly.
Full Top 100 table
This table is fully embedded in the HTML, so all country rows remain visible and readable even without JavaScript. With JavaScript enabled, readers can search by country, switch between Top 10, Top 20, and Top 100, or re-sort by score and annual change. The most useful way to read it is not only to look at the first five rows, but to compare clusters: the Nordic and northwestern European leaders, the advanced common-law systems just below them, the stronger Central and Eastern European reformers, and the middle-ranked countries where score momentum and absolute institutional quality can diverge sharply.
| Rank | Country | Score | Annual change |
|---|---|---|---|
| 1 | Denmark | 0.90 | -0.2% |
| 2 | Norway | 0.89 | -0.2% |
| 3 | Finland | 0.87 | -0.5% |
| 4 | Sweden | 0.85 | -0.5% |
| 5 | New Zealand | 0.83 | 0.0% |
| 6 | Germany | 0.83 | -0.1% |
| 7 | Luxembourg | 0.83 | 0.0% |
| 8 | Ireland | 0.82 | 0.4% |
| 9 | Netherlands | 0.82 | -0.7% |
| 10 | Estonia | 0.82 | 0.2% |
| 11 | Australia | 0.80 | -0.2% |
| 12 | Austria | 0.79 | 0.1% |
| 13 | Canada | 0.79 | -0.4% |
| 14 | United Kingdom | 0.78 | -0.1% |
| 15 | Japan | 0.78 | -0.3% |
| 16 | Singapore | 0.78 | 0.1% |
| 17 | Belgium | 0.78 | 0.0% |
| 18 | Lithuania | 0.77 | 0.1% |
| 19 | South Korea | 0.74 | 0.4% |
| 20 | Czechia | 0.74 | -0.1% |
| 21 | Latvia | 0.73 | 0.1% |
| 22 | France | 0.72 | -0.1% |
| 23 | Uruguay | 0.72 | -0.2% |
| 24 | Hong Kong SAR | 0.72 | -0.5% |
| 25 | Spain | 0.71 | -0.6% |
| 26 | Slovenia | 0.68 | -0.9% |
| 27 | United States | 0.68 | -2.8% |
| 28 | Costa Rica | 0.68 | 0.0% |
| 29 | Portugal | 0.67 | -0.5% |
| 30 | Cyprus | 0.67 | 0.3% |
| 31 | Malta | 0.67 | -0.2% |
| 32 | Poland | 0.66 | 0.4% |
| 33 | Barbados | 0.66 | 0.3% |
| 34 | Italy | 0.66 | -0.5% |
| 35 | Chile | 0.66 | -0.3% |
| 36 | Slovakia | 0.64 | -2.3% |
| 37 | United Arab Emirates | 0.64 | 0.7% |
| 38 | Antigua and Barbuda | 0.64 | 0.1% |
| 39 | Rwanda | 0.63 | -0.1% |
| 40 | St. Kitts and Nevis | 0.63 | -0.5% |
| 41 | Qatar | 0.62 | New entry |
| 42 | St. Vincent and the Grenadines | 0.62 | -0.2% |
| 43 | St. Lucia | 0.62 | -0.3% |
| 44 | Romania | 0.61 | -1.2% |
| 45 | Namibia | 0.61 | -0.5% |
| 46 | Croatia | 0.61 | -0.5% |
| 47 | Mauritius | 0.60 | 0.0% |
| 48 | Greece | 0.60 | -0.8% |
| 49 | Grenada | 0.60 | -0.8% |
| 50 | Botswana | 0.60 | 1.0% |
| 51 | Bahamas | 0.58 | -0.9% |
| 52 | Georgia | 0.58 | -2.4% |
| 53 | Kuwait | 0.58 | -0.7% |
| 54 | Dominica | 0.58 | 0.1% |
| 55 | Montenegro | 0.57 | 0.4% |
| 56 | Malaysia | 0.57 | 0.0% |
| 57 | Jamaica | 0.57 | -0.1% |
| 58 | Senegal | 0.56 | 1.6% |
| 59 | Kosovo | 0.56 | 0.4% |
| 60 | South Africa | 0.56 | -0.7% |
| 61 | Bulgaria | 0.55 | -1.0% |
| 62 | Jordan | 0.55 | 0.6% |
| 63 | Ghana | 0.54 | -0.5% |
| 64 | North Macedonia | 0.54 | 1.3% |
| 65 | Argentina | 0.54 | -1.0% |
| 66 | Kazakhstan | 0.54 | 0.0% |
| 67 | Mongolia | 0.53 | -0.4% |
| 68 | Moldova | 0.53 | -1.1% |
| 69 | Indonesia | 0.52 | -0.7% |
| 70 | Bosnia and Herzegovina | 0.52 | 0.1% |
| 71 | Malawi | 0.52 | 0.1% |
| 72 | Nepal | 0.52 | -0.3% |
| 73 | Panama | 0.52 | 0.2% |
| 74 | Sri Lanka | 0.51 | 1.1% |
| 75 | Trinidad and Tobago | 0.51 | -0.1% |
| 76 | Dominican Republic | 0.50 | 2.1% |
| 77 | Thailand | 0.50 | 1.0% |
| 78 | Brazil | 0.50 | 1.1% |
| 79 | Hungary | 0.50 | -2.0% |
| 80 | Guyana | 0.50 | -0.1% |
| 81 | Uzbekistan | 0.50 | 0.5% |
| 82 | Belize | 0.50 | 0.3% |
| 83 | Vietnam | 0.50 | -0.2% |
| 84 | Suriname | 0.49 | 0.3% |
| 85 | Tunisia | 0.49 | -2.7% |
| 86 | India | 0.49 | -1.7% |
| 87 | Albania | 0.49 | 1.2% |
| 88 | Algeria | 0.49 | -1.1% |
| 89 | Gambia | 0.49 | -0.8% |
| 90 | Ukraine | 0.48 | -0.7% |
| 91 | Morocco | 0.48 | 0.4% |
| 92 | China | 0.48 | 0.8% |
| 93 | Peru | 0.48 | -1.2% |
| 94 | Benin | 0.47 | -0.9% |
| 95 | Colombia | 0.47 | -1.8% |
| 96 | Serbia | 0.47 | -1.8% |
| 97 | Philippines | 0.46 | 0.4% |
| 98 | Tanzania | 0.46 | -1.2% |
| 99 | Ecuador | 0.46 | -1.4% |
| 100 | Paraguay | 0.45 | -1.0% |
Source: World Justice Project, Rule of Law Index 2025. Update basis: official 2025 edition covering 143 countries and jurisdictions. Annual change reflects the year-on-year movement in the overall WJP score, not a change in rank position.
Chart 2. Score level vs annual change
This scatter plot compares score level with annual change for a selected set of countries. That matters because level and momentum are not the same thing. A country can have a respectable score but be drifting in the wrong direction, while another can post short-term improvement from a much weaker base and still remain far from the institutional frontier. Looking at both dimensions together produces a more realistic reading than rank position alone.
The pattern is mixed. Several top-performing systems stayed near the frontier despite small declines, while a handful of middle-ranked countries posted stronger short-term gains. That should not be mistaken for rapid convergence. Improving from 0.50 to 0.51 is meaningful, but it does not eliminate structural gaps in courts, enforcement, rights protection, or executive accountability. The chart is most useful as a momentum signal, not as proof that institutional distance has suddenly closed.
Methodology
The World Justice Project builds this index from a broad measurement framework rather than from one legal or political statistic. The 2025 edition covers 143 countries and jurisdictions and scores each on eight factors: constraints on government powers, absence of corruption, open government, fundamental rights, order and security, regulatory enforcement, civil justice, and criminal justice. These factors are further broken into 44 sub-factors, and the final score runs from 0 to 1, with higher values indicating stronger rule-of-law performance.
That breadth is one reason the index is more informative than a narrow corruption or crime ranking. WJP says the 2025 edition draws on more than 215,000 household surveys and more than 4,100 legal practitioner and expert surveys, covering about 95% of the world’s population. That mix matters because it combines formal institutional assessment with lived experience. In other words, the ranking is designed to capture not only whether legal rules exist on paper, but whether ordinary people and businesses can actually experience those rules in daily life.
The limits are just as important. The overall score compresses a lot of institutional reality into one number, so it cannot fully capture regional disparities inside large countries, sudden sector-specific reforms, or the difference between a country that is broadly predictable and one that is predictable only in selected areas. WJP’s conceptual framework also acknowledges informal justice, but that dimension is excluded from the aggregated ranking because it is not systematically comparable across countries. Annual percentage changes should be read carefully, especially near the top where scores are tightly clustered. The index is best used as a serious governance benchmark alongside country-specific information on courts, sector regulation, political risk, property-rights enforcement, and administrative quality.
Insights and takeaways
- Institutional strength remains unusually concentrated. The very top of the ranking is still occupied by a narrow group of advanced democracies that combine judicial independence, administrative competence, low corruption, and relatively high public trust. That concentration is a reminder that strong rule of law is difficult to build and even harder to sustain across multiple institutions at once.
- High scores come from balance, not from one good headline. Countries do not reach the top merely by being orderly or merely by being clean. The leaders tend to perform well across several dimensions at the same time: executive checks, open government, rights protection, regulatory consistency, and workable civil and criminal justice systems. This is why a country that looks efficient in one area can still rank materially lower overall.
- Yearly movement should be read as a signal, not as a full story. Small changes in the top tier can move a country several places because the scores are tightly packed. A decline of less than one percent does not mean institutional breakdown, but repeated small declines can point to gradual erosion in checks and balances, civic space, or justice delivery.
- Improvement from the middle of the table is real, but it is not instant convergence. Countries such as the Dominican Republic, Senegal, and North Macedonia posted visible gains in 2025. That matters because it may signal reform momentum. But readers should not confuse improvement in direction with closeness to the institutional frontier. A country can be improving and still remain far below the standards that matter for highly predictable contract enforcement or judicial independence.
- Advanced economies are not automatically safe from drift. The United States ranked 27th with a -2.8% annual change. That makes the ranking useful not only for identifying leaders, but also for spotting deterioration inside countries that are still rich, influential, and often assumed to be institutionally stable by default.
- Eastern Europe shows why regional averages can mislead. Estonia remains a genuine institutional frontrunner, Czechia stays in the global top 20, and several nearby states sit much lower. For relocation, business planning, or political-risk reading, this is a reminder that geographic proximity does not guarantee similar legal and administrative reality.
What this means for the reader
For investors: the score is most useful as a screen for enforcement quality. Higher-ranked countries usually offer a more predictable environment for contracts, procurement, permits, court timelines, and protection against arbitrary state action. That does not remove commercial risk, but it often reduces the institutional friction that can turn manageable projects into expensive disputes.
For relocation decisions: this ranking is one of the better tools for moving beyond lifestyle marketing. It helps frame daily-life questions that people actually feel over time: how public agencies behave, whether administrative decisions can be challenged, whether courts are trusted, and whether rights are enforceable when a problem becomes serious.
For founders and cross-border operators: a stronger rule-of-law environment often makes it easier to manage licensing, banking relationships, contracts with suppliers, employment disputes, and regulatory communication. A lower-tax jurisdiction can still be the harder place to operate if approvals are inconsistent or enforcement is politically uneven.
For readers comparing countries more intelligently: do not treat the ranking as a final verdict. Use it to narrow the field and then go one level deeper. If you care about investment, look at courts, procurement, and regulatory enforcement. If you care about relocation, pay close attention to rights protection, public administration, and everyday legal recourse. If you care about governance quality over time, watch the direction of travel as much as the current rank.
FAQ
What does the Rule of Law Index actually measure?
It measures how rule of law is experienced in practice, not just how a constitution or statute book looks on paper. The overall score combines eight factors: constraints on government powers, absence of corruption, open government, fundamental rights, order and security, regulatory enforcement, civil justice, and criminal justice. That is why the index is useful for real-world comparison: it captures whether institutions actually function, not only whether formal rules exist.
Why are Nordic countries so often near the top?
Because they tend to score well across the full institutional package rather than in only one area. They usually combine independent courts, relatively clean public administration, credible executive checks, strong civil liberties, and justice systems that people can realistically use. High ranking here is usually the result of durable institutional balance, not a single reform or a short-term political cycle.
Is this basically the same as a corruption ranking?
No. Corruption is only one part of the index. A country may reduce petty corruption and still perform weakly on judicial independence, rights protection, or regulatory fairness. That is exactly why the WJP framework is more analytically useful than looking at corruption alone. It tests whether power is constrained and whether justice systems are usable, not only whether bribery is lower.
Why should investors and business owners care about it?
Because rule of law often shapes the hidden cost of doing business. Stronger scores usually point to more reliable contract enforcement, more predictable licensing, clearer property-rights protection, lower risk of arbitrary action, and better odds that a commercial dispute can be resolved without political interference. Those conditions do not guarantee profits, but they often make planning and execution far easier.
Can a country have a decent economy but still rank weakly here?
Yes. A country can grow quickly, attract capital, or look dynamic on paper while still having court delays, uneven enforcement, weak checks on government, or limited rights protection. Growth and institutional quality overlap, but they are not the same thing. That is why this ranking is helpful: it tests the legal and governance foundation underneath the economic story.
Why is a small annual decline like -0.5% worth watching?
Because the top of the table is tightly packed, and small score changes can signal real movement in institutional quality. A single minor decline is not proof of deep deterioration, but repeated declines may indicate stress in areas such as civic space, government accountability, or access to justice. In governance analysis, drift often starts gradually before it becomes obvious in headlines.
How should readers use this ranking wisely?
Use it as a serious first screen, not as a final country verdict. For business, look beyond the overall rank to issues like civil justice, regulatory enforcement, and constraints on government powers. For relocation, pay closer attention to rights protection, administrative fairness, and whether public institutions can be trusted when a dispute matters. The smartest use of the ranking is comparative and layered, not simplistic.
Sources
- World Justice Project Rule of Law Index 2025 report — official global report, scores, rankings, and factor-level discussion.
- WJP 2025 global rankings page — official interactive rankings by country and factor.
- WJP Methodology Snapshot 2025 — technical overview of factors, sub-factors, and survey design.
- WJP methodology FAQ — plain-language explanation of what the index measures and what it does not.
- WJP 2025 global press release — official summary of global decline, top improvers, and top decliners.
- WJP Ukraine profile — official country page for Ukraine in the 2025 edition.
- WJP United States insights page — official country page with the U.S. 2025 score and factor positions.