Top 100 Cities by Utility Bills for a 60 m² Apartment (Annual Cost)
Utility bills are one of the least predictable “fixed” costs of living in a rented or owned apartment. Two similar 60 m² flats can produce very different annual totals because the invoice is not only about energy use: it also reflects network charges, taxes and levies, standing fees, heating system type, local climate, and the energy-efficiency of the building stock.
This page ranks the Top 100 cities with the highest combined “basic utilities” costs, expressed as an estimated annual bill for a ≈60 m² apartment. “Basic utilities” are treated as a bundled monthly amount covering electricity, heating, cooling, water, and garbage. The intent is not to predict your exact bill, but to provide a comparable benchmark for budgeting, relocation analysis, and market research.
Important disclosure: the city ranking is based on a crowd-reported cost-of-living dataset (resident-reported “basic utilities” totals). It is a practical benchmark, not an official tariff publication and not a legal definition of what a landlord must include. The 60 m² estimate is a normalization step (see methodology) and can deviate when fixed charges dominate. For budgeting, treat numbers as a planning baseline and apply a ±15% band unless you have building-specific bills. Annual cost here is computed as 12× the monthly benchmark and does not model seasonal peaks.
Best use case: compare cities on a common apartment size (≈60 m²) and stress-test annual budgets, then validate with local utility providers, heating type, building energy efficiency, and whether hot water / heating are included in rent.
What this ranking measures (and what it does not)
“Utilities” can mean different things on rental listings. In some cities it means “electricity only”; in others it includes district heating, water, garbage collection, and climate control. To make cities comparable, this ranking uses a consistent bundled definition of basic utilities for an apartment—a single monthly value that includes:
- Electricity (typical household electricity and fixed charges captured in the benchmark).
- Heating and cooling (the dominant residential climate-control costs in that city’s typical setup).
- Water (where it is typically paid by residents and captured in the bundled utilities benchmark).
- Garbage / waste collection (standard municipal or service fees where they are typically paid by residents).
Common items typically not included in this benchmark
- Internet and mobile plans, streaming/TV packages, and household subscriptions.
- Building maintenance / HOA / condo fees (these may be separate line items or bundled into rent depending on the market).
- One-time deposits, connection fees, penalties, and special waste services.
Standardization to ≈60 m² and annualization
The underlying dataset reports the monthly “basic utilities” value for an 85 m² apartment. Because the target here is a ≈60 m² flat, we apply a transparent scaling step and then convert the monthly benchmark to an annual total. This is a normalization model for comparison—not a substitute for a real bill from your provider.
Monthly (60 m²) = Monthly (85 m²) × (60/85) ≈ Monthly (85 m²) × 0.706
Annual (60 m²) = Monthly (60 m²) × 12
Accuracy note: bills do not scale perfectly with floor area because many tariffs include fixed standing charges. Area scaling can underestimate costs in cities where fixed fees dominate and can deviate in climates with heavy seasonal heating/cooling. A practical way to use this page is to apply a ±15% planning band unless you have building-specific invoices. For example, the Top-100 median is about $2,832.05 per year for ≈60 m²; a ±15% band is roughly $2,407.24 to $3,256.86.
Replicability (data pull details)
- Snapshot date: February 26, 2026.
- Source item: “Basic Utilities for 85 m² Apartment (Electricity, Heating, Cooling, Water, Garbage)” (city price rankings).
- Currency view: USD (for consistent cross-city comparison).
- Ranking rule: select the 100 cities with the highest monthly utilities value in the snapshot; derive ≈60 m² monthly and annual estimates using the formulas above.
Key insights from the Top 100 (snapshot: Feb 26, 2026)
The Top 100 list clusters where energy prices, network charges, and climate-driven heating demand combine into a high monthly bill. In this snapshot, many high-cost cities are in Europe—especially in Germany and the United Kingdom—reflecting the combined effect of pricing structure (including fixed fees), taxes/levies, and housing/climate conditions.
What stands out immediately
- Highest estimated annual bill (≈60 m²): $5,301.23 in Erfurt, Germany.
- Lowest within the Top 100 (≈60 m²): $2,319.59 per year (still high by global standards).
- Country concentration: Germany contributes 28 of 100 cities; the United Kingdom contributes 20.
- Range inside the Top 100: $2,319.59 → $5,301.23 per year, showing that even “bottom of Top 100” cities remain expensive.
Distribution snapshot (Top 100 only)
Values below are computed from the Top 100 annual estimates for ≈60 m² in this snapshot and should be read as approximate. Because this list already represents the high-cost segment, the distribution is tighter than an “all cities” view.
| Statistic (Top 100) | Annual utilities (≈60 m²) | Meaning |
|---|---|---|
| Mean | $2,873.96 | Average annual bill across the 100 highest-cost cities in this snapshot. |
| Median | $2,832.05 | The middle city (rank #50/51) by annual utilities cost. |
| 10th percentile | $2,385.61 | Lower edge of the Top 100 (still expensive relative to global norms). |
| 90th percentile | $3,410.04 | Upper edge of the Top 100, close to the “extreme” tier. |
| Interquartile range (25th–75th) | $2,517.36 → $3,104.43 | The middle 50% of cities fall within this band (IQR ≈ $587.07). |
| Std. deviation | $446.80 | Typical dispersion around the mean inside the Top 100 segment. |
| Range (min → max) | $2,319.59 → $5,301.23 | How wide the “most expensive” band is within the covered city set. |
Country mix (Top 8 by count)
The table below shows which countries contribute the most cities to the Top 100 list in this snapshot. Treat this as a coverage and concentration signal rather than a definitive national tariff ranking.
| Country | Cities in Top 100 | Share of Top 100 |
|---|---|---|
| Germany | 28 | 28% |
| United Kingdom | 20 | 20% |
| Poland | 9 | 9% |
| United States | 6 | 6% |
| Switzerland | 5 | 5% |
| Austria | 5 | 5% |
| Netherlands | 4 | 4% |
| France | 4 | 4% |
Next: the Top 10 visualization highlights the extreme end of the distribution. After that, the full Top 100 table lists every city.
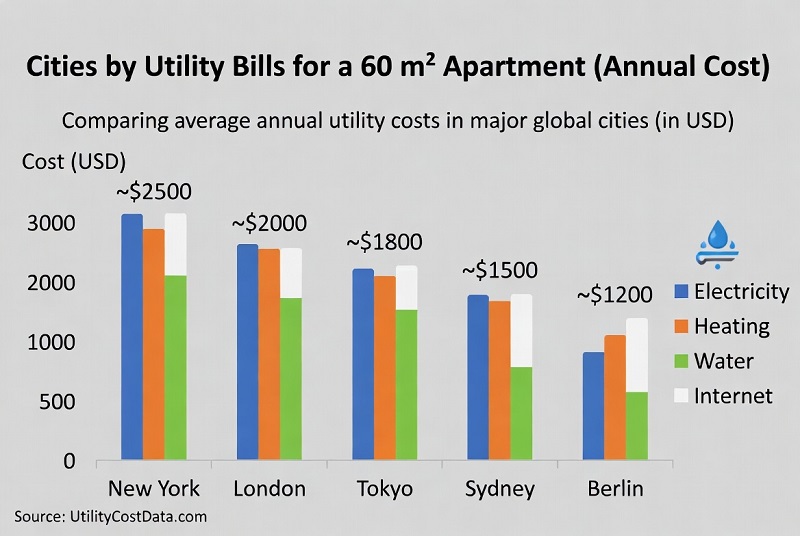
Top 10 most expensive cities for annual utilities (≈60 m²)
This visualization shows the 10 cities with the highest estimated annual cost for basic utilities in a ≈60 m² apartment in the current dataset snapshot. Values are derived from the monthly utilities benchmark and normalized from 85 m² to 60 m² (60/85), then annualized (×12).
Reading the chart: the ranking uses a bundled “basic utilities” value (electricity + heating + cooling + water + garbage). Cities can reach similar totals for different reasons: high standing charges, higher unit prices, heavy heating demand, or a mix of all three. Use this as a comparative benchmark, then validate with building-specific bills.
FAQ: how to interpret the Top 100 utilities ranking
This FAQ answers the most common interpretation questions for a city-level utilities ranking, including what is included, how the 60 m² normalization works, and how renters should use the results.
What counts as “basic utilities” in this ranking?
Why are costs reported for 85 m² and then converted to 60 m²?
How accurate is the 60 m² estimate?
Does the number include building maintenance or condo fees?
Why do Germany and the UK appear so often in the Top 100?
Can I compare cities if I pay in local currency?
How should renters and movers use this ranking?
Quick renter checklist: ask whether heating and hot water are included in rent; identify the heating system type (district heating, gas, electric, heat pump); check building insulation/energy rating where available; and request a recent winter bill or annual statement for the specific unit.
Full Top 100 list (estimated utilities for ≈60 m²)
The table below lists the 100 cities with the highest monthly “basic utilities” values in the dataset snapshot, converted into estimated monthly and annual utilities for ≈60 m² using the 60/85 scaling ratio. Values are shown in USD for cross-city comparability.
| Rank | City | Est. monthly (60 m²) | Est. annual (60 m²) |
|---|---|---|---|
| 1 | Erfurt, Germany | $441.77 | $5,301.23 |
| 2 | Villach, Austria | $326.52 | $3,918.24 |
| 3 | George Town, Cayman Islands | $320.39 | $3,844.63 |
| 4 | Pisa, Italy | $312.24 | $3,746.83 |
| 5 | Dortmund, Germany | $311.48 | $3,737.76 |
| 6 | Frankfurt, Germany | $301.71 | $3,620.57 |
| 7 | Salzburg, Austria | $290.68 | $3,488.20 |
| 8 | Essen, Germany | $287.88 | $3,454.54 |
| 9 | Munich, Germany | $287.78 | $3,453.35 |
| 10 | Karlsruhe, Germany | $285.71 | $3,428.50 |
| 11 | Cologne, Germany | $284.00 | $3,407.99 |
| 12 | Berlin, Germany | $280.73 | $3,368.77 |
| 13 | Aachen, Germany | $277.30 | $3,327.55 |
| 14 | London, United Kingdom | $271.77 | $3,261.19 |
| 15 | Graz, Austria | $271.60 | $3,259.14 |
| 16 | Gdynia, Poland | $269.08 | $3,228.97 |
| 17 | Guildford, United Kingdom | $266.46 | $3,197.49 |
| 18 | Wroclaw, Poland | $264.15 | $3,169.82 |
| 19 | Hanover, Germany | $262.47 | $3,149.59 |
| 20 | Dresden, Germany | $262.41 | $3,148.91 |
| 21 | Nuremberg, Germany | $260.87 | $3,130.38 |
| 22 | Hamburg, Germany | $259.93 | $3,119.21 |
| 23 | Bremen, Germany | $259.89 | $3,118.79 |
| 24 | Dusseldorf, Germany | $259.83 | $3,117.95 |
| 25 | Oxford, United Kingdom | $259.44 | $3,113.27 |
| 26 | Aberdeen, United Kingdom | $258.46 | $3,101.49 |
| 27 | Bonn, Germany | $255.51 | $3,066.14 |
| 28 | Leipzig, Germany | $254.78 | $3,057.35 |
| 29 | Edinburgh, United Kingdom | $254.35 | $3,052.15 |
| 30 | Wiesbaden, Germany | $252.61 | $3,031.30 |
| 31 | Prague, Czech Republic | $252.13 | $3,025.55 |
| 32 | Riga, Latvia | $251.47 | $3,017.68 |
| 33 | Augsburg, Germany | $250.39 | $3,004.72 |
| 34 | Bristol, United Kingdom | $249.50 | $2,994.02 |
| 35 | San Juan, Puerto Rico | $249.36 | $2,992.35 |
| 36 | Vienna, Austria | $248.05 | $2,976.56 |
| 37 | Darmstadt, Germany | $246.54 | $2,958.43 |
| 38 | Stuttgart, Germany | $246.33 | $2,956.68 |
| 39 | Cambridge, United Kingdom | $245.66 | $2,947.89 |
| 40 | Mainz, Germany | $245.43 | $2,945.21 |
| 41 | Lodz, Poland | $245.32 | $2,943.96 |
| 42 | Kosice, Slovakia | $243.79 | $2,925.44 |
| 43 | Tallinn, Estonia | $243.53 | $2,922.41 |
| 44 | Sheffield, United Kingdom | $243.16 | $2,917.93 |
| 45 | Chemnitz, Germany | $240.59 | $2,887.11 |
| 46 | Sacramento, CA, United States | $239.20 | $2,870.44 |
| 47 | Oslo, Norway | $237.89 | $2,854.68 |
| 48 | Glasgow, United Kingdom | $236.91 | $2,842.88 |
| 49 | Warsaw, Poland | $236.58 | $2,838.99 |
| 50 | Trondheim, Norway | $236.58 | $2,838.99 |
| 51 | Heidelberg, Germany | $235.43 | $2,825.11 |
| 52 | Gdansk, Poland | $234.69 | $2,816.23 |
| 53 | Brno, Czech Republic | $231.72 | $2,780.64 |
| 54 | Kiel, Germany | $231.19 | $2,774.30 |
| 55 | Strasbourg, France | $230.91 | $2,770.89 |
| 56 | Lausanne, Switzerland | $230.89 | $2,770.72 |
| 57 | Buffalo, NY, United States | $230.87 | $2,770.47 |
| 58 | Birmingham, United Kingdom | $230.17 | $2,762.06 |
| 59 | Krakow (Cracow), Poland | $229.68 | $2,756.14 |
| 60 | Ljubljana, Slovenia | $229.61 | $2,755.29 |
| 61 | Milton Keynes, United Kingdom | $228.34 | $2,740.07 |
| 62 | Brescia, Italy | $224.46 | $2,693.56 |
| 63 | Amsterdam, Netherlands | $222.23 | $2,666.72 |
| 64 | Cardiff, United Kingdom | $222.11 | $2,665.20 |
| 65 | Lugano, Switzerland | $218.90 | $2,626.81 |
| 66 | Linz, Austria | $217.49 | $2,609.88 |
| 67 | Basel, Switzerland | $215.94 | $2,591.22 |
| 68 | Tartu, Estonia | $215.29 | $2,583.48 |
| 69 | Luxembourg, Luxembourg | $214.68 | $2,576.17 |
| 70 | Tel Aviv-Yafo, Israel | $214.33 | $2,571.93 |
| 71 | Stockholm, Sweden | $213.78 | $2,565.39 |
| 72 | Brighton, United Kingdom | $211.17 | $2,534.08 |
| 73 | Poznan, Poland | $210.42 | $2,525.00 |
| 74 | Leeds, United Kingdom | $210.15 | $2,521.76 |
| 75 | Mannheim, Germany | $210.07 | $2,520.79 |
| 76 | Lyon, France | $208.92 | $2,507.08 |
| 77 | Rotterdam, Netherlands | $208.28 | $2,499.38 |
| 78 | Lexington, KY, United States | $207.33 | $2,487.95 |
| 79 | Grenoble, France | $207.25 | $2,487.02 |
| 80 | Liverpool, United Kingdom | $207.05 | $2,484.71 |
| 81 | Southampton, United Kingdom | $206.39 | $2,476.62 |
| 82 | Ramat Gan, Israel | $206.34 | $2,476.02 |
| 83 | Utrecht, Netherlands | $206.25 | $2,474.95 |
| 84 | Padova, Italy | $205.60 | $2,467.15 |
| 85 | Anchorage, AK, United States | $205.56 | $2,466.73 |
| 86 | Geneva, Switzerland | $204.81 | $2,457.73 |
| 87 | Freiburg im Breisgau, Germany | $203.56 | $2,442.68 |
| 88 | Seattle, WA, United States | $201.11 | $2,413.34 |
| 89 | Reading, United Kingdom | $200.86 | $2,410.33 |
| 90 | Manchester, United Kingdom | $198.86 | $2,386.37 |
| 91 | Leiden, Netherlands | $198.23 | $2,378.78 |
| 92 | Galway, Ireland | $198.09 | $2,377.12 |
| 93 | Leicester, United Kingdom | $197.88 | $2,374.53 |
| 94 | Erlangen, Germany | $197.71 | $2,372.74 |
| 95 | Omaha, NE, United States | $197.65 | $2,371.76 |
| 96 | Szczecin, Poland | $196.92 | $2,363.01 |
| 97 | Zug, Switzerland | $195.77 | $2,349.64 |
| 98 | Bordeaux, France | $195.65 | $2,347.98 |
| 99 | Katowice, Poland | $195.50 | $2,346.03 |
| 100 | Nottingham, United Kingdom | $193.30 | $2,319.59 |
Interpretation: this is a ranking of combined apartment utilities, not only electricity. Two cities with similar totals can still have very different compositions (for example, one is heating-dominant, another is driven by fixed network charges).
Why utility bills vary so much across cities
A “utility bill” is the visible output of a deeper system. When you compare two cities, you are comparing a stack: wholesale energy costs, retail tariff design, grid/network charges, taxes and levies, and the physical reality of climate and buildings. City averages can remain high even when wholesale prices fall if fixed components, taxes, or network costs dominate the final bill.
1) Climate and heating/cooling demand (the load multiplier)
In many apartments, heating is the largest annual driver. Cold winters and long heating seasons increase total utilities sharply, especially in older, less insulated buildings. In warmer climates, cooling can replace heating as the seasonal driver—often with electricity-based tariffs. Because this page annualizes a monthly benchmark, it captures the typical level but does not simulate seasonal peaks.
2) Tariff design: fixed standing charges vs consumption-based pricing
Tariffs often blend fixed charges (connection/network fees) with per-kWh pricing. Higher fixed fees reduce month-to-month volatility but increase the “effective price” for small households and smaller apartments. This is why the 85→60 m² conversion is a helpful benchmark but not a perfect scaling rule.
3) Taxes, levies, and network costs
Household energy bills can include policy components (taxes/levies) and grid components (transmission/distribution charges). Official statistical publications often separate these components, showing that the “final price paid by households” is not just the energy commodity. Where network upgrades, reliability investments, or policy levies are significant, city-level totals can stay elevated.
4) Building stock and energy efficiency
Two 60 m² apartments in the same city can have very different bills depending on insulation, windows, heating system efficiency, hot-water production, and whether the unit is in a modern building or older stock. In cities with a larger share of older buildings, the typical utilities benchmark can be pulled upward.
5) What is bundled into “utilities” in local practice
Some markets bill garbage and water separately; others embed them into municipal bills; some buildings include heating/hot water in rent. A city-level utilities benchmark is useful because it reflects what residents commonly report paying, but lease structures can still change the number for a specific address.
Official context: in the EU, Eurostat tracks household electricity and gas prices (including taxes and levies) and highlights large cross-country differences. In the United States, the EIA publishes electricity price indicators over time. These sources help explain why some regions repeatedly cluster at the high end, even though the city ranking itself is based on resident-reported totals.
Limits of this Top 100 and how to interpret it responsibly
A ranking is only as good as its definitions. This Top 100 answers a practical budgeting question: “How expensive are typical basic utilities in the highest-cost cities—scaled to a 60 m² apartment and expressed per year?” It is designed to be comparable across cities, but it is not a substitute for local tariffs or your building’s invoices.
Coverage and sample effects
- The list covers cities present in the dataset snapshot with sufficient contributions for the utilities item.
- City ranks can shift when the underlying sample changes or when local prices move quickly after tariff resets.
- The Top 100 is therefore “Top 100 within the covered city set” for the snapshot date.
Model limits (85 m² → 60 m² and monthly → annual)
- Area scaling is a practical normalization, but fixed charges can make a 60 m² bill higher than proportional scaling suggests.
- Annual cost is computed as 12× the monthly benchmark; it does not model winter peaks or summer cooling spikes.
- For planning, apply a ±15% band unless you have unit-specific bills.
What to check before you rely on a city benchmark
- Lease structure: is heating/hot water included in rent or billed separately?
- System type: district heating vs gas vs electric vs heat pump can change the bill profile.
- Building efficiency: insulation level and windows strongly affect heating/cooling demand.
- Tariff design: fixed charges vs per-unit rates influence how costs scale with size and consumption.
Used correctly, the Top 100 provides a strong signal about where utilities can behave like a major annual budget line for a 60 m² apartment. Used incorrectly, it becomes a promise about a specific unit’s invoice. The difference is validation.
Data sources
Primary ranking data are derived from a city-level “basic utilities” price item that bundles electricity, heating, cooling, water, and garbage. Supporting context is provided by official statistical sources that track household energy price components and cross-country variation.
- Numbeo — City price rankings (Basic Utilities, 85 m² apartment): dataset used to rank cities and compute the ≈60 m² annual estimates (crowd-reported cost-of-living inputs). https://www.numbeo.com/cost-of-living/city_price_rankings?itemId=30
- Numbeo — Item definition (“Prices by City”, Basic Utilities): clarifies what “basic utilities” includes in the dataset item. https://www.numbeo.com/cost-of-living/prices_by_city.jsp?displayCurrency=USD&itemId=30
- Numbeo — Methodology overview: explains collection approach, filtering, and how city-level price items are built. https://www.numbeo.com/common/motivation_and_methodology.jsp
- Eurostat — Electricity price statistics (households; incl. taxes/levies): official context on how household electricity prices vary and how taxes/levies contribute. https://ec.europa.eu/eurostat/statistics-explained/index.php/Electricity_price_statistics
- Eurostat — Household electricity prices (news release, 1st half of 2025): headline statistical release for recent household price levels and comparisons. https://ec.europa.eu/eurostat/web/products-eurostat-news/w/ddn-20251029-2
- Eurostat — Household gas prices (news release, 1st half of 2025): companion release for gas prices and cross-country ranges. https://ec.europa.eu/eurostat/web/products-eurostat-news/w/ddn-20251029-1
- U.S. EIA — Electricity monthly update: time-series context on U.S. electricity price indicators. https://www.eia.gov/electricity/monthly/update/end-use.php