
Top 100 Countries by PM2.5 Air Pollution (Annual
Climate, Weather & Environmental Risks PM2.5 is “fine particulate matter” — particles small enough to reach deep into the lungs.
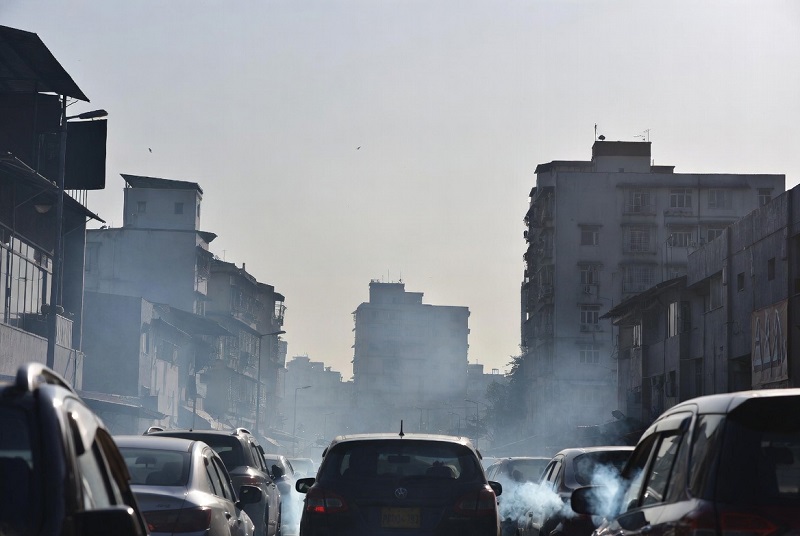
Climate, Weather & Environmental Risks PM2.5 is “fine particulate matter” — particles small enough to reach deep into the lungs.
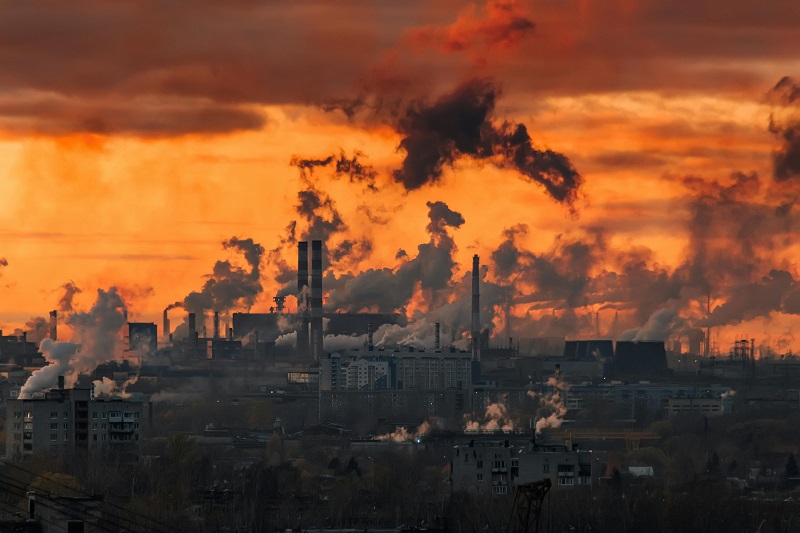
2025 edition • latest full-year data available: 2024 • unit: tonnes CO₂ per person Annual CO₂ emissions per capita: what
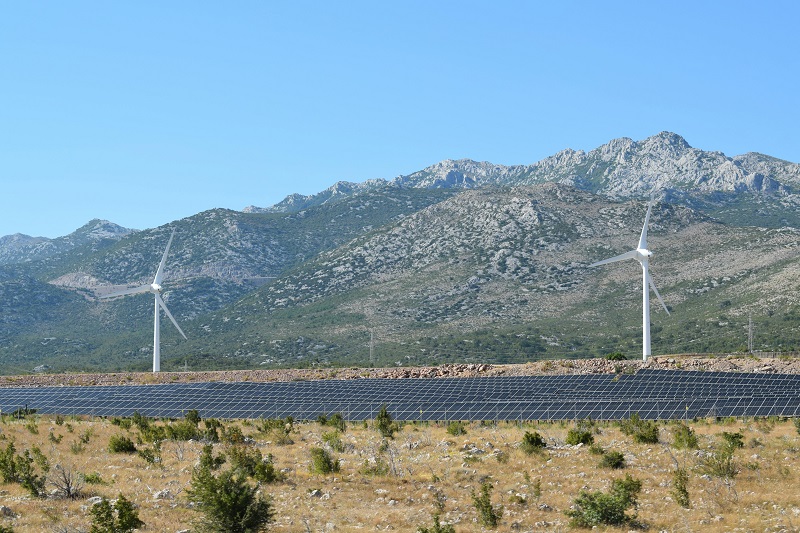
Metric focus: electricity generation mix Latest full-year country data: 2024 (published/updated in 2025) Renewable electricity share in 2025: why “power
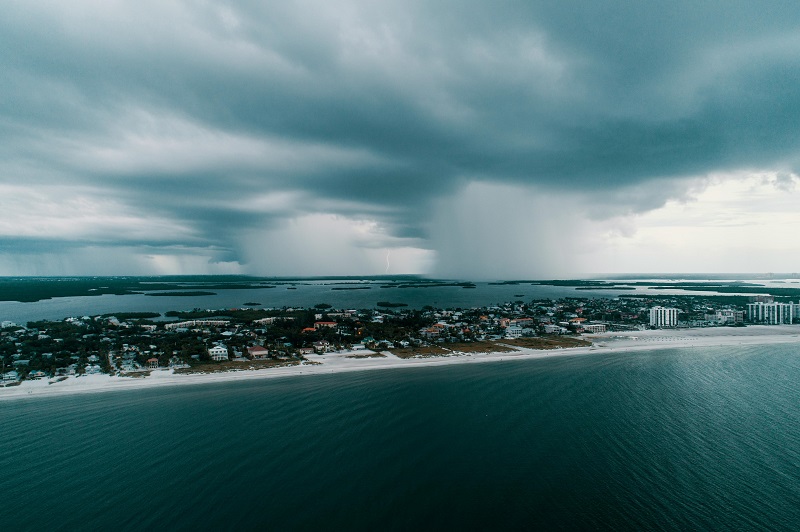
Climate Risk Index 2025: a composite view of heat, floods and storms (0–100) “Climate risk” is often confused with “how

Metric focus: exposure (not probability) Horizon: 2050 Units: people exposed (approx.) How to read “exposure” in a 2050 sea-level-rise ranking

Extreme-weather event frequency: what the Top 100 ranking measures The ranking Top 100 Countries by Frequency of Extreme Weather Events
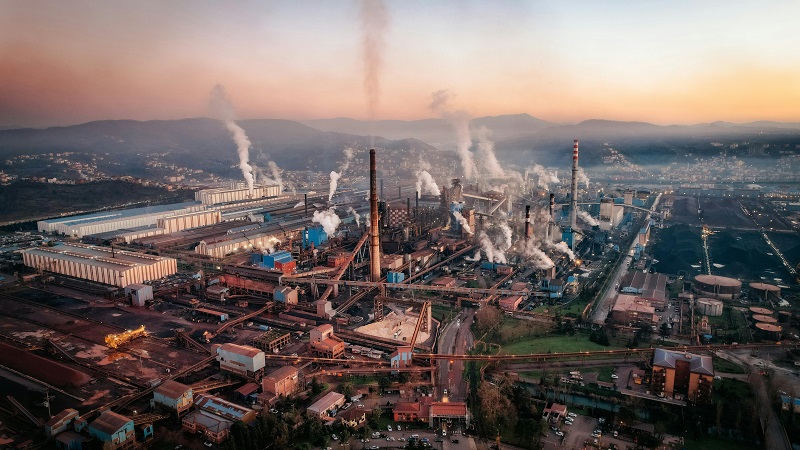
Metric: Annual mean PM2.5 (µg/m³), calendar year 2025 (provisional) PM2.5 City Ranking 2025: Annual Exposure Beats “Smog Peaks” PM2.5 refers

Climate Normals vs “Now”: Why 1991–2020 Still Matters When We Talk About 2025 This ranking focuses on average annual near-surface
