Top 10 Blueberry Producing Countries in 2025
Global blueberry production remains highly concentrated in 2025 (latest full-year data used as proxy)
Blueberries are now a truly global crop, but production is still dominated by a small set of countries with scale, strong agronomy, and export-oriented supply chains. Using the latest complete production figures (2023) as a practical proxy for a 2025 snapshot, the top 10 producers account for about ~88% of world output.
Top 10 blueberry-producing countries (2025 snapshot using 2023 data)
The leaders combine scale (large planted area), yield improvements (varietal breeding, substrate systems, protected cultivation), and logistics that can reliably place berries into high-value markets. Within the top group, two different models stand out: large domestic-market producers (China, U.S.) and export-first systems (Peru, Morocco).
Rapid area expansion and improved varieties pushed China to the top position, with production concentrated in key growing provinces and supported by strong domestic demand.
A diversified producer with both fresh and processed supply chains. Output is distributed across multiple states and seasons, supporting a mature domestic market and steady export flows.
Export-led growth remains the defining feature: Peru has built a high-efficiency pipeline from farms to ports, with a strong focus on counter-seasonal supply to Northern Hemisphere markets.
A long-established exporter with deep market relationships. The competitive edge depends on quality consistency, orchard renewal, and logistics in a crowded global export season.
Spain’s success is tied to intensive systems and early-season windows into European demand, supported by modern varieties and high-performing grower organisations.
Mexico supplies proximity-based freshness advantages into North American markets, with production systems optimized for timing and consistent export-grade quality.
Canada’s blueberry sector spans wild blueberries and cultivated highbush systems. Comparisons across years can shift depending on whether datasets combine both categories.
A major European producer with scale in processing and fresh supply. Productivity gains depend on modern planting material, labour availability, and post-harvest infrastructure.
Morocco’s rise reflects a strong export pipeline into Europe, favorable early-season timing, and rapid adoption of modern production techniques.
South Africa is a growing Southern Hemisphere supplier. Growth depends on export-grade quality, cold chain reliability, and market access during key windows.
Table 1. Top 10 blueberry-producing countries
| Rank | Country | Production (tonnes) | Share of world |
|---|---|---|---|
| 1 | China | 563,000 | 31.63% |
| 2 | United States | 283,000 | 15.90% |
| 3 | Peru | 234,000 | 13.15% |
| 4 | Chile | 132,000 | 7.42% |
| 5 | Spain | 71,000 | 3.99% |
| 6 | Mexico | 67,000 | 3.76% |
| 7 | Canada | 63,000 | 3.54% |
| 8 | Poland | 62,000 | 3.48% |
| 9 | Morocco | 56,000 | 3.15% |
| 10 | South Africa | 35,000 | 1.97% |
Reference world total (latest full year): ≈ 1,780,000 tonnes. Top 10 sum ≈ 1,566,000 tonnes (≈ 87.98% of global output).
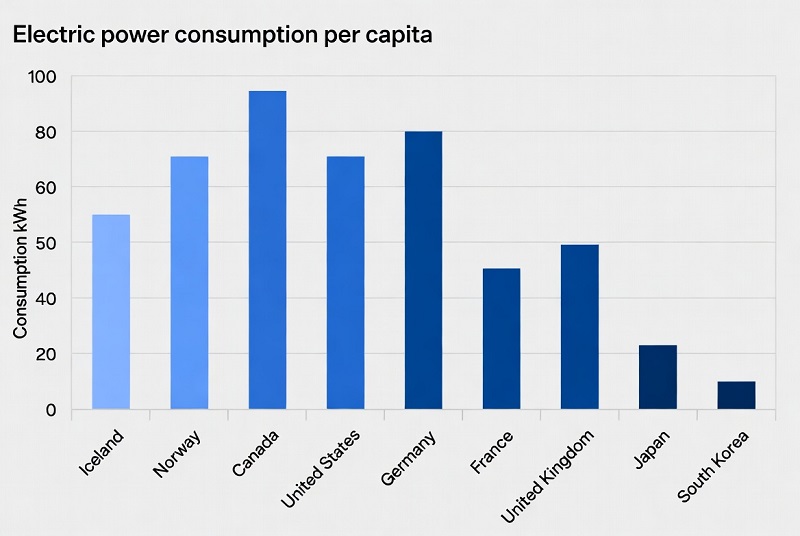
Chart 1. Production levels across the Top 10
Top 10 production (tonnes)
- China — 563,000
- United States — 283,000
- Peru — 234,000
- Chile — 132,000
- Spain — 71,000
- Mexico — 67,000
- Canada — 63,000
- Poland — 62,000
- Morocco — 56,000
- South Africa — 35,000
Values are shown in tonnes and reflect the latest complete production year used as a proxy for a 2025 snapshot.
Methodology
This ranking uses the latest complete year of comparable production statistics (2023) as a proxy for a 2025 snapshot. In agricultural datasets, the most recent full-year data often lags the calendar year because national reporting, harmonisation, and cross-country validation take time. Countries are ranked by total blueberry production volume (tonnes). Shares are computed against a global total of ≈ 1.78 million tonnes for the same reference year.
- Indicator: total blueberry production (tonnes), not exports.
- Processing: values rounded for readability; shares recalculated using the stated global total.
- Comparability limits: definitions can differ (wild vs cultivated; fresh vs processing channels); revisions can occur as national series are updated.
- Interpretation: production volume captures supply capacity, while market power also depends on logistics, seasonality, and quality grades.
Key insights from the 2025 production map
- Concentration remains high: the top 10 produce ~88% of global blueberries, meaning shocks in a small set of origins can move global supply.
- China’s scale is now decisive: with ~32% of world output, marginal yield shifts or regional climate events can meaningfully change global totals.
- Exports are not the same as production: Peru’s system is built around export logistics and timing, so it can lead trade outcomes even when ranked below larger domestic-market producers.
- Seasonality is a strategy: Chile, Peru, Morocco, and South Africa compete by hitting high-value windows rather than simply maximizing annual tonnage.
- Data nuance matters: in markets with both wild and cultivated supply (notably Canada), year-to-year comparisons can differ depending on dataset scope.
What this means for readers
For consumers, concentrated production helps explain why prices can react quickly to weather events, logistics disruptions, or sudden demand shifts. For growers and agribusiness, the top producers illustrate two winning models: (1) large-scale domestic demand with steady supply chains, and (2) export-first strategies that optimize seasonality, cold chain reliability, and market access. For investors and analysts, the production ranking is best read alongside export data, planted area trends, and varietal transitions that influence quality and shelf life.
FAQ: blueberry production rankings
Why is China ranked #1?
China combines rapid area expansion with improving yields and a large domestic market. Those factors push total annual output above all other producers in the latest complete-year data.
If the U.S. has advanced farming, why isn’t it #1?
The U.S. remains a top-tier producer, but China’s expansion has been faster in recent years. Rankings reflect total tonnage, not farm technology or berry quality.
Peru is a top exporter — why is it only #3 in production?
Exports depend on timing, logistics, and market access as much as volume. Peru’s system is optimized for counter-seasonal export windows, which can produce outsized trade impact relative to its tonnage ranking.
Do these numbers include wild blueberries?
Depending on the statistical source, wild and cultivated blueberries can be reported separately or combined. This is one reason cross-year comparisons for some countries require extra care.
Is “production” the same as “available for export”?
No. Domestic consumption, processing, and post-harvest losses mean exportable supply is typically smaller than production. Export leaders can differ from production leaders.
How should I interpret “share of world”?
It shows how much of global production comes from a given country in the reference year. Higher shares suggest greater influence on global supply conditions, but not necessarily greater export dominance.
Interactive producer table (units vs share) and growth-vs-scale view
Use the controls to search, sort, filter by region and income group, and switch the value column between absolute tonnes and share of global production. YoY here is shown as a simple 2021→2023 change where the reference pair is available.
Table 2. Producers (proxy snapshot)
| Rank | Country | Value | YoY |
|---|---|---|---|
| 1 |
China
Region: Asia · Income: Upper-middle
|
563,00031.63% | +18.0% |
| 2 |
United States
Region: Americas · Income: High
|
283,00015.90% | −19.0% |
| 3 |
Peru
Region: Americas · Income: Upper-middle
|
234,00013.15% | +3.0% |
| 4 |
Chile
Region: Americas · Income: High
|
132,0007.42% | — |
| 5 |
Spain
Region: Europe · Income: High
|
71,0003.99% | — |
| 6 |
Mexico
Region: Americas · Income: Upper-middle
|
67,0003.76% | — |
| 7 |
Canada
Region: Americas · Income: High
|
63,0003.54% | −57.0% |
| 8 |
Poland
Region: Europe · Income: High
|
62,0003.48% | — |
| 9 |
Morocco
Region: MENA · Income: Lower-middle
|
56,0003.15% | — |
| 10 |
South Africa
Region: Africa · Income: Upper-middle
|
35,0001.97% | — |
YoY is shown as a 2021→2023 change where the pair is available (China, U.S., Peru, Canada). Canada’s YoY can be sensitive to whether wild and cultivated datasets are combined. All values are treated as the latest complete-year proxy for a 2025 snapshot.
Figure 2. Scale vs growth signal (production vs 2021→2023 change)
This chart places the largest producers by production scale on the horizontal axis and the 2021→2023 change (where available) on the vertical axis. It illustrates a common pattern: large producers can move in opposite directions depending on domestic market dynamics, yield cycles, and dataset definitions.
Scatter points (x = production tonnes, y = 2021→2023 change)
- China — x: 563,000 · y: +18.0%
- United States — x: 283,000 · y: −19.0%
- Peru — x: 234,000 · y: +3.0%
- Canada — x: 63,000 · y: −57.0%
The scatter is a compact diagnostic view, not a full trend model. It is most useful for comparing the direction of change among countries with comparable reporting definitions.
How to interpret the 2025 blueberry production hierarchy
Production rankings show where supply capacity is concentrated, but they do not fully explain pricing, export power, or farm profitability. In blueberries, the biggest strategic differentiators are seasonality windows, quality grades, and cold chain execution. That is why a country can punch above its weight in exports even when it ranks below larger domestic producers.
What the ranking suggests about market structure
The top 10 produce ~88% of global blueberries, which creates a supply landscape where a limited number of origins can shape global availability. When weather or logistics disrupts just one of the large producers, downstream markets can feel it quickly.
- Scale leaders: China and the U.S. anchor global volume and influence total supply.
- Export specialists: Peru (and increasingly Morocco) show how logistics and timing can translate into strong market presence.
- Window competition: Southern Hemisphere suppliers compete by hitting high-demand periods in Northern Hemisphere markets.
- Europe’s role: Spain and Poland illustrate both early-season fresh supply and processing capacity within European demand corridors.
A practical way to read the table is to separate structural leaders (large domestic demand plus scale) from window leaders (export-focused systems that win on timing). Over time, productivity improvements and varietal transitions can matter as much as area expansion, because shelf life, firmness, and flavor consistency often decide which origins earn premium pricing.
Policy and business takeaways
- For producing countries: productivity gains (yield + pack-out rates) often matter more than expanding area, because quality and post-harvest performance determine market access.
- For exporters: cold chain, inspection efficiency, and port reliability can be decisive—especially in peak seasonal windows.
- For buyers and retailers: diversification across origins reduces risk; reliance on a narrow set of suppliers can amplify price volatility.
- For consumers: price swings are often tied to seasonal overlap, weather shocks, and shipping constraints rather than a steady long-run demand shift.
Primary sources (official and widely used reference datasets)
Global harmonised agricultural production statistics by country and commodity; commonly used for cross-country comparisons.
https://www.fao.org/faostat/en/#data/QCL
Official U.S. agricultural statistics, including berries in relevant releases and datasets.
https://www.nass.usda.gov/
Country and commodity market reports, including trade dynamics, seasonality, and export channels.
https://www.fas.usda.gov/data
Official Canadian statistics; useful for cross-checking production series and understanding reporting scope.
https://www.statcan.gc.ca/en/start
EU statistical office; reference for agricultural context and related production/trade indicators within the EU.
https://ec.europa.eu/eurostat/
Figures in this page use the latest complete-year production totals provided in the brief as a proxy for a 2025 snapshot. For formal analysis, consult the underlying datasets directly and confirm the exact commodity definition and coverage for each country series.