


Countries by Sovereign Credit Rating — 2026 snapshot
What this ranking measures
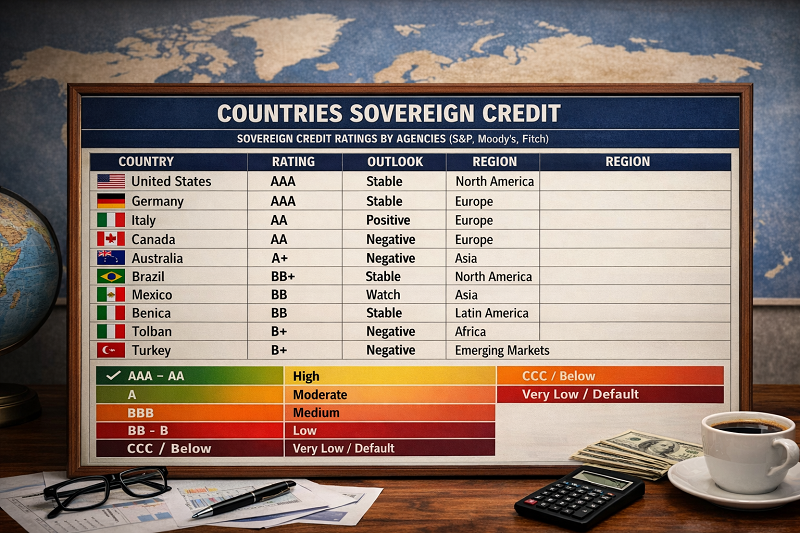
A sovereign credit rating is an opinion about a government’s ability and willingness to meet its long-term debt obligations in full and on time. Markets use sovereign ratings to tier risk: stronger tiers usually mean cheaper borrowing costs, broader investor demand, and more resilient access to funding during stress.
Thank you for reading this post, don't forget to subscribe!How the composite score works (0–100)
For comparability, agency letter grades are mapped onto a unified 0–100 scale. In this snapshot, the score shown is the Trading Economics (TE) composite published alongside agency grades (S&P, Moody’s, and DBRS Morningstar where available). “NR” means a grade is not available in the snapshot dataset for that agency.
- Top (100–86): typical “AAA / AA” territory in unified scale Top
- Strong (85–71): high-quality “A / high BBB” territory Strong
- IG edge (70–55): around the investment-grade boundary IG edge
- Speculative (54–38): below investment grade (risk premia become more sensitive) Speculative
- High risk (37–0): distressed / very high risk territory High risk
Investment grade is typically BBB− / Baa3 and above. Below that is speculative grade.
Top-10 best rated sovereigns (by composite score)
Generated from the same snapshot dataset as the full table (Part 2). Ties are kept in a fixed, transparent order.
Top-10 table (compact)
| Rank | Country | Composite (0–100) | Ratings (S&P · Moody’s · DBRS) + Fitch |
|---|---|---|---|
| 1 | Australia | 100.0 | AAA · Aaa · AAA · Fitch: NR |
| 2 | Canada | 100.0 | AAA · Aaa · AAA · Fitch: NR |
| 3 | Denmark | 100.0 | AAA · Aaa · AAA · Fitch: NR |
| 4 | Germany | 100.0 | AAA · Aaa · AAA · Fitch: NR |
| 5 | Liechtenstein | 100.0 | AAA · NR · NR · Fitch: NR |
| 6 | Luxembourg | 100.0 | AAA · Aaa · AAA · Fitch: NR |
| 7 | Netherlands | 100.0 | AAA · Aaa · AAA · Fitch: NR |
| 8 | Switzerland | 100.0 | AAA · Aaa · AAA · Fitch: NR |
| 9 | Norway | 99.0 | AAA · Aaa · AAA · Fitch: NR |
| 10 | Sweden | 99.0 | AAA · Aaa · AAA · Fitch: NR |
Top-20 by composite score
Higher score = stronger credit tier.
- Australia — 100.0
- Canada — 100.0
- Denmark — 100.0
- Germany — 100.0
- Liechtenstein — 100.0
- Luxembourg — 100.0
- Netherlands — 100.0
- Switzerland — 100.0
- Norway — 99.0
- Sweden — 99.0
- Singapore — 98.0
- European Union — 97.0
- United States — 97.0
- Finland — 96.0
- New Zealand — 96.0
- Austria — 95.0
- Taiwan — 90.0
- United Arab Emirates — 90.0
- Hong Kong — 88.0
- Ireland — 88.0
Insights from this snapshot
- Top-tier ratings are concentrated. The highest scores cluster in a narrow set of advanced economies and a few highly rated financial hubs.
- The investment-grade boundary is a market fault line. Many mandates, index rules, and collateral frameworks treat IG vs non-IG as a hard cutoff, amplifying repricing near the boundary.
- Ratings move slowly; yields can move fast. Agencies emphasize medium-term fundamentals, while bond yields can reprice rapidly on inflation surprises, politics, liquidity, or global risk sentiment.
What this means for readers
If you track country risk for investing, business expansion, or interpreting macro headlines, the composite score is a fast tiering tool. Higher-rated sovereigns tend to have cheaper funding, deeper bond markets, and more stable access to external financing. For households and companies, sovereign risk can indirectly influence borrowing costs, currency pressure, and the likelihood of abrupt policy tightening. For internationally mobile professionals, ratings are not a quality-of-life metric, but they can be a useful signal about macro stability and crisis risk.
Methodology (plain-English)
Snapshot date: February 15, 2026. Ratings and market data can change; treat this as a point-in-time register. Inputs: public long-term sovereign ratings from major agencies where available in the snapshot dataset (S&P, Moody’s, DBRS Morningstar). Score: the 0–100 composite score shown here follows a unified mapping concept (letter grades mapped to a common scale), as published in the snapshot source list. Missing data: “NR” indicates a rating is not available for that agency in the snapshot dataset. Limits: agency methodologies differ; coverage varies by country; outlooks can be subjective; and ratings can react to revisions, political events, or changes in debt structure. Ratings are opinions, not guarantees.
FAQ
Why do “top-tier” sovereigns matter so much in markets?
During risk-off episodes, demand often concentrates in a narrow “safe asset” set. That concentration can widen the pricing gap between top-tier issuers and the rest, affecting spreads, liquidity, and refinancing conditions.
Is a composite score the same as an agency’s official opinion?
No. A composite is a convenience for comparison and screening. It aggregates information from different scales into a common metric. For decision-making, investors typically review each agency’s rationale and the underlying macro and fiscal fundamentals.
What does “NR” (not rated / not available) mean?
“NR” does not automatically mean “high risk.” It can reflect limited issuance, an issuer’s choice not to maintain a rating relationship, or data availability constraints. It simply means fewer standardized reference points in this snapshot.
Why can yields rise even if ratings don’t change?
Bond yields can move quickly due to inflation surprises, political shocks, liquidity conditions, or global risk appetite. Ratings are typically designed to reflect medium-term credit fundamentals and may adjust with a lag.
What’s the practical difference between investment grade and speculative grade?
Many investment mandates, bond indices, and collateral frameworks use the IG boundary as an eligibility rule. Falling below the boundary can shrink the investor base and raise refinancing costs—sometimes abruptly.
How should I use this ranking responsibly?
Use it to compare tiers, not to treat small differences as precise. Combine ratings with market signals (yields, FX pressure, reserves, fiscal metrics), and always check the snapshot date and recent rating actions before drawing conclusions.
Full ranking table (Top-100) + filters
Use search and grade filters to explore the sovereign credit rating list. Default view shows Top-20, but all 100 rows are present in the HTML.
Snapshot reference: mid-February 2026 (country rating register last updated Feb 15, 2026).
| Rank | Country | Composite (0–100) | Ratings (S&P · Moody’s · DBRS · Fitch) |
|---|---|---|---|
| 1 | AustraliaIG | 100.0 | S&P: AAA · Moody’s: Aaa · DBRS: AAA · Fitch: NR |
| 2 | CanadaIG | 100.0 | S&P: AAA · Moody’s: Aaa · DBRS: AAA · Fitch: NR |
| 3 | DenmarkIG | 100.0 | S&P: AAA · Moody’s: Aaa · DBRS: AAA · Fitch: NR |
| 4 | GermanyIG | 100.0 | S&P: AAA · Moody’s: Aaa · DBRS: AAA · Fitch: NR |
| 5 | LiechtensteinIG | 100.0 | S&P: AAA · Moody’s: NR · DBRS: NR · Fitch: NR |
| 6 | LuxembourgIG | 100.0 | S&P: AAA · Moody’s: Aaa · DBRS: AAA · Fitch: NR |
| 7 | NetherlandsIG | 100.0 | S&P: AAA · Moody’s: Aaa · DBRS: AAA · Fitch: NR |
| 8 | SwitzerlandIG | 100.0 | S&P: AAA · Moody’s: Aaa · DBRS: AAA · Fitch: NR |
| 9 | NorwayIG | 99.0 | S&P: AAA · Moody’s: Aaa · DBRS: AAA · Fitch: NR |
| 10 | SwedenIG | 99.0 | S&P: AAA · Moody’s: Aaa · DBRS: AAA · Fitch: NR |
| 11 | SingaporeIG | 98.0 | S&P: AAA · Moody’s: Aaa · DBRS: AAA · Fitch: NR |
| 12 | European UnionIG | 97.0 | S&P: AA+ · Moody’s: Aaa · DBRS: AAA · Fitch: NR |
| 13 | United StatesIG | 97.0 | S&P: AA+ · Moody’s: Aa1 · DBRS: AAA · Fitch: NR |
| 14 | FinlandIG | 96.0 | S&P: AA+ · Moody’s: Aa1 · DBRS: AA (high) · Fitch: NR |
| 15 | New ZealandIG | 96.0 | S&P: AA+ · Moody’s: Aaa · DBRS: AAA · Fitch: NR |
| 16 | AustriaIG | 95.0 | S&P: AA+ · Moody’s: Aa1 · DBRS: AAA · Fitch: NR |
| 17 | TaiwanIG | 90.0 | S&P: AA+ · Moody’s: Aa3 · DBRS: NR · Fitch: NR |
| 18 | United Arab EmiratesIG | 90.0 | S&P: AA · Moody’s: Aa2 · DBRS: NR · Fitch: NR |
| 19 | Hong KongIG | 88.0 | S&P: AA+ · Moody’s: Aa3 · DBRS: NR · Fitch: NR |
| 20 | IrelandIG | 88.0 | S&P: AA · Moody’s: Aa3 · DBRS: AA · Fitch: NR |
| 21 | QatarIG | 88.0 | S&P: AA · Moody’s: Aa2 · DBRS: NR · Fitch: NR |
| 22 | BelgiumIG | 87.0 | S&P: AA · Moody’s: Aa3 · DBRS: AA · Fitch: NR |
| 23 | Isle of ManIG | 87.0 | S&P: N/A · Moody’s: Aa3 · DBRS: NR · Fitch: NR |
| 24 | MacauIG | 87.0 | S&P: NR · Moody’s: Aa3 · DBRS: NR · Fitch: NR |
| 25 | United KingdomIG | 87.0 | S&P: AA · Moody’s: Aa3 · DBRS: AA · Fitch: NR |
| 26 | South KoreaIG | 86.0 | S&P: AA · Moody’s: Aa2 · DBRS: NR · Fitch: NR |
| 27 | Cayman IslandsIG | 85.0 | S&P: NR · Moody’s: Aa3 · DBRS: NR · Fitch: NR |
| 28 | Czech RepublicIG | 85.0 | S&P: AA- · Moody’s: Aa3 · DBRS: AA · Fitch: NR |
| 29 | FranceIG | 83.0 | S&P: A+ · Moody’s: Aa3 · DBRS: AA · Fitch: NR |
| 30 | KuwaitIG | 81.0 | S&P: AA- · Moody’s: A1 · DBRS: NR · Fitch: NR |
| 31 | EstoniaIG | 80.0 | S&P: NR · Moody’s: A1 · DBRS: AA (low) · Fitch: NR |
| 32 | Saudi ArabiaIG | 80.0 | S&P: A+ · Moody’s: Aa3 · DBRS: NR · Fitch: NR |
| 33 | ChinaIG | 78.0 | S&P: A+ · Moody’s: A1 · DBRS: A · Fitch: NR |
| 34 | IcelandIG | 78.0 | S&P: A+ · Moody’s: A1 · DBRS: NR · Fitch: NR |
| 35 | SloveniaIG | 78.0 | S&P: AA · Moody’s: A3 · DBRS: AA (low) · Fitch: NR |
| 36 | BermudaIG | 77.0 | S&P: A+ · Moody’s: A2 · DBRS: A (high) · Fitch: NR |
| 37 | JapanIG | 77.0 | S&P: A+ · Moody’s: A1 · DBRS: A (high) · Fitch: NR |
| 38 | LithuaniaIG | 76.0 | S&P: A · Moody’s: A2 · DBRS: A (high) · Fitch: NR |
| 39 | MaltaIG | 75.0 | S&P: A- · Moody’s: A2 · DBRS: A (high) · Fitch: NR |
| 40 | ChileIG | 73.0 | S&P: A · Moody’s: A2 · DBRS: N/A · Fitch: NR |
| 41 | PortugalIG | 73.0 | S&P: A+ · Moody’s: A3 · DBRS: A (high) · Fitch: NR |
| 42 | SlovakiaIG | 73.0 | S&P: A+ · Moody’s: A3 · DBRS: A (low) · Fitch: NR |
| 43 | LatviaIG | 72.0 | S&P: A · Moody’s: A3 · DBRS: A · Fitch: NR |
| 44 | PolandIG | 72.0 | S&P: A- · Moody’s: A2 · DBRS: A · Fitch: NR |
| 45 | SpainIG | 72.0 | S&P: A+ · Moody’s: A3 · DBRS: A (high) · Fitch: NR |
| 46 | CyprusIG | 71.0 | S&P: A- · Moody’s: A3 · DBRS: A · Fitch: NR |
| 47 | IsraelIG | 71.0 | S&P: A · Moody’s: Baa1 · DBRS: NR · Fitch: NR |
| 48 | CroatiaIG | 70.0 | S&P: A- · Moody’s: A3 · DBRS: A · Fitch: NR |
| 49 | AndorraIG | 68.0 | S&P: A- · Moody’s: Baa1 · DBRS: NR · Fitch: NR |
| 50 | MalaysiaIG | 68.0 | S&P: A- · Moody’s: A3 · DBRS: NR · Fitch: NR |
| 51 | ItalyIG | 66.0 | S&P: BBB+ · Moody’s: Baa2 · DBRS: A (low) · Fitch: NR |
| 52 | BotswanaIG | 65.0 | S&P: BBB · Moody’s: Baa1 · DBRS: NR · Fitch: NR |
| 53 | ThailandIG | 65.0 | S&P: BBB+ · Moody’s: Baa1 · DBRS: NR · Fitch: NR |
| 54 | BulgariaIG | 61.0 | S&P: BBB+ · Moody’s: Baa1 · DBRS: BBB (high) · Fitch: NR |
| 55 | PhilippinesIG | 61.0 | S&P: BBB+ · Moody’s: Baa2 · DBRS: NR · Fitch: NR |
| 56 | UruguayIG | 61.0 | S&P: BBB+ · Moody’s: Baa1 · DBRS: BBB · Fitch: NR |
| 57 | IndonesiaIG | 60.0 | S&P: BBB · Moody’s: Baa2 · DBRS: NR · Fitch: NR |
| 58 | KazakhstanIG | 60.0 | S&P: BBB- · Moody’s: Baa1 · DBRS: NR · Fitch: NR |
| 59 | PeruIG | 60.0 | S&P: BBB- · Moody’s: Baa1 · DBRS: N/A · Fitch: NR |
| 60 | HungaryIG | 58.0 | S&P: BBB- · Moody’s: Baa2 · DBRS: BBB · Fitch: NR |
| 61 | MexicoIG | 58.0 | S&P: BBB · Moody’s: Baa2 · DBRS: BBB · Fitch: NR |
| 62 | San MarinoIG | 57.0 | S&P: BBB+ · Moody’s: NR · DBRS: BBB (low) · Fitch: NR |
| 63 | ArubaIG | 56.0 | S&P: BBB+ · Moody’s: Baa3 · DBRS: NR · Fitch: NR |
| 64 | GreeceIG | 56.0 | S&P: BBB · Moody’s: Baa3 · DBRS: BBB · Fitch: NR |
| 65 | IndiaIG | 56.0 | S&P: BBB · Moody’s: Baa3 · DBRS: BBB · Fitch: NR |
| 66 | MauritiusIG | 55.0 | S&P: BBB- · Moody’s: Baa3 · DBRS: NR · Fitch: NR |
| 67 | MontserratIG | 55.0 | S&P: BBB- · Moody’s: NR · DBRS: NR · Fitch: NR |
| 68 | RomaniaIG | 55.0 | S&P: BBB- · Moody’s: Baa3 · DBRS: BB (high) · Fitch: NR |
| 69 | AzerbaijanIG | 53.0 | S&P: – · Moody’s: Baa3 · DBRS: NR · Fitch: NR |
| 70 | OmanIG | 53.0 | S&P: BBB- · Moody’s: Baa3 · DBRS: NR · Fitch: NR |
| 71 | PanamaIG | 53.0 | S&P: BBB- · Moody’s: Baa3 · DBRS: NR · Fitch: NR |
| 72 | ColombiaIG | 52.0 | S&P: BB · Moody’s: Baa3 · DBRS: BB (high) · Fitch: NR |
| 73 | ParaguayIG | 51.0 | S&P: BBB- · Moody’s: Baa3 · DBRS: NR · Fitch: NR |
| 74 | MoroccoIG | 50.0 | S&P: BBB- · Moody’s: Ba1 · DBRS: NR · Fitch: NR |
| 75 | Trinidad and TobagoIG | 50.0 | S&P: BBB- · Moody’s: Ba2 · DBRS: NR · Fitch: NR |
| 76 | GuatemalaIG | 48.0 | S&P: BB+ · Moody’s: Ba1 · DBRS: NR · Fitch: NR |
| 77 | SerbiaIG | 48.0 | S&P: BBB- · Moody’s: Ba2 · DBRS: NR · Fitch: NR |
| 78 | BrazilIG | 46.0 | S&P: BB · Moody’s: Ba1 · DBRS: BB · Fitch: NR |
| 79 | VietnamIG | 46.0 | S&P: BB+ · Moody’s: Ba2 · DBRS: NR · Fitch: NR |
| 80 | GeorgiaIG | 45.0 | S&P: BB · Moody’s: Ba2 · DBRS: NR · Fitch: NR |
| 81 | MacedoniaIG | 45.0 | S&P: BB- · Moody’s: NR · DBRS: NR · Fitch: NR |
| 82 | Costa RicaIG | 43.0 | S&P: BB · Moody’s: Ba2 · DBRS: NR · Fitch: NR |
| 83 | Ivory CoastIG | 43.0 | S&P: BB · Moody’s: Ba2 · DBRS: NR · Fitch: NR |
| 84 | Dominican RepublicIG | 41.0 | S&P: BB · Moody’s: Ba2 · DBRS: NR · Fitch: NR |
| 85 | South AfricaIG | 41.0 | S&P: BB · Moody’s: Ba2 · DBRS: NR · Fitch: NR |
| 86 | UzbekistanIG | 41.0 | S&P: BB · Moody’s: Ba3 · DBRS: NR · Fitch: NR |
| 87 | AlbaniaIG | 40.0 | S&P: BB · Moody’s: Ba3 · DBRS: NR · Fitch: NR |
| 88 | ArmeniaIG | 40.0 | S&P: BB- · Moody’s: Ba3 · DBRS: NR · Fitch: NR |
| 89 | JamaicaIG | 40.0 | S&P: BB · Moody’s: Ba3 · DBRS: NR · Fitch: NR |
| 90 | SeychellesIG | 40.0 | S&P: NR · Moody’s: NR · DBRS: NR · Fitch: NR |
| 91 | TurkeyIG | 40.0 | S&P: BB- · Moody’s: Ba3 · DBRS: BB (high) · Fitch: NR |
| 92 | JordanIG | 38.0 | S&P: BB- · Moody’s: Ba3 · DBRS: NR · Fitch: NR |
| 93 | HondurasIG | 37.0 | S&P: BB- · Moody’s: B1 · DBRS: NR · Fitch: NR |
| 94 | NamibiaIG | 37.0 | S&P: NR · Moody’s: B1 · DBRS: NR · Fitch: NR |
| 95 | BahamasIG | 36.0 | S&P: BB- · Moody’s: B1 · DBRS: NR · Fitch: NR |
| 96 | BeninIG | 36.0 | S&P: BB- · Moody’s: B1 · DBRS: NR · Fitch: NR |
| 97 | BangladeshIG | 35.0 | S&P: B+ · Moody’s: B2 · DBRS: NR · Fitch: NR |
| 98 | FijiIG | 35.0 | S&P: B+ · Moody’s: B1 · DBRS: NR · Fitch: NR |
| 99 | MongoliaIG | 35.0 | S&P: BB- · Moody’s: B1 · DBRS: NR · Fitch: NR |
| 100 | MontenegroIG | 35.0 | S&P: B+ · Moody’s: Ba3 · DBRS: NR · Fitch: NR |
Interpretation: why sovereign ratings matter
Sovereign ratings affect a country’s financial “price of entry.” A stronger rating generally expands the investor base, reduces risk premia, and improves the terms on which a government can borrow. In practice, the channel runs through bond indices, institutional constraints, collateral eligibility, and global risk appetite.
Market access & the cost of debt
Higher-rated sovereigns tend to issue longer maturities at lower spreads, refinance more smoothly, and maintain deeper secondary-market liquidity. Lower-rated issuers often face shorter duration, higher rollover risk, and heavier dependence on local banks or official lenders. When global financial conditions tighten, this gap can widen quickly—sometimes faster than the letter grades move.
Policy takeaways: what moves ratings over time
- Debt affordability: not just debt/GDP, but interest-to-revenue, maturity structure, and rollover profile.
- External buffers: FX reserves, current-account dynamics, and the composition of external debt.
- Institutional credibility: fiscal rules, central-bank independence, and policy predictability.
- Growth fundamentals: productivity, diversification, and the ability to absorb shocks.
- Contingent liabilities: banking-sector risks and state-owned enterprise exposures.
Outlook changes often appear before a rating change and typically reflect a balance of risks rather than a single indicator.
How to read “Not rated” (NR)
“Not rated” does not automatically mean “high risk.” It can reflect an issuer’s choice not to maintain a rating relationship, limited issuance, or disclosure constraints. For users, NR mainly means fewer standardized reference points and usually more reliance on issuer-level due diligence and market signals.
How to use this page responsibly
- Use the composite score to compare tiers; avoid treating small score differences as precise.
- Check recent rating actions and (where available) outlooks for directionality before drawing conclusions.
- Combine ratings with market signals (yields, FX stress, reserves, fiscal data) for a fuller picture.
- Always confirm the snapshot date—ratings and yields can change during fast-moving episodes.
Sources
-
Trading Economics — Rating, by country (S&P · Moody’s · DBRS · TE composite)
Snapshot register used for the Top-100 list and composite scores (last updated Feb 15, 2026).
-
Trading Economics — Government Bond 10Y yields, by country
Point-in-time 10-year yields used for the scatter chart where available (last updated Feb 15, 2026).
-
S&P Global Ratings — Understanding ratings (rating scale)
Primary reference for S&P rating scale and definitions.
-
Moody’s — Rating symbols and definitions (PDF)
Primary reference for Moody’s rating symbols and definitions.
-
Fitch Ratings — Rating definitions
Primary reference for Fitch rating definitions and scale.
-
DBRS Morningstar — Credit ratings scale and risk definitions
Primary reference for DBRS Morningstar rating scale and definitions.
StatRanker (Website)
administrator
