


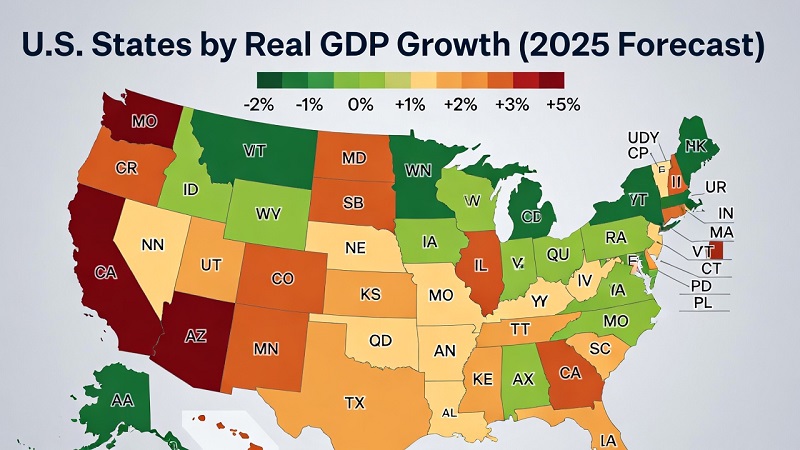
Top 50 U.S. States by Real GDP Growth (%), Latest Year/Quarter
Last updated: January 28, 2026
Thank you for reading this post, don't forget to subscribe!Disclaimer: This page is for educational purposes only and is not investment, financial, tax, or legal advice. Economic statistics can be revised and short-term growth rates can be volatile. Use official sources for decisions.
Real gross domestic product (real GDP) measures the inflation-adjusted value of goods and services produced within a state. Because BEA reports real GDP in chained dollars, the goal is to capture changes in real output (volumes), not price movements. This page ranks all 50 U.S. states by the latest available real GDP growth rate.
Continue exploring
More StatRanker pages connected by topic, category or ranking theme.
Top 100 Countries by Real Wage Growth (2020–2025), 2025 Update
Open rankingTop Countries by GDP Growth (Real, %), 2025
Open rankingCountries Where Wages Beat Inflation: Official Real Wage Growth Ranking, 2020–2025
Open rankingThe growth rates shown are the percent change from the previous quarter, expressed at a seasonally adjusted annual rate (SAAR). SAAR annualizes the quarter’s change as if it continued for four quarters. It helps compare short-term momentum, but it should not be treated as a guarantee or a forecast.
Key takeaways
- Broad-based expansion: all 50 states posted positive real GDP growth in the latest quarter.
- Range of outcomes: growth runs from 6.5% (highest) to 0.4% (lowest) at an annual rate.
- National context: the U.S. real GDP growth rate for the same quarter was 4.4% (annual rate).
- Percent growth ≠ economic size: smaller states can rank high by % without adding the most total output in dollars.
- Revisions are normal: BEA updates estimates as more complete source data becomes available.
Ranking table
Period: 2025 Q3 vs 2025 Q2 • Percent change at annual rate (SAAR) • Rounded to 1 decimal.
| Rank | State | Real GDP growth (%) | Period |
|---|---|---|---|
| 1 | Kansas | 6.5 | 2025 Q3 |
| 2 | South Dakota | 6.2 | 2025 Q3 |
| 3 | Arkansas | 5.8 | 2025 Q3 |
| 4 | Connecticut | 5.6 | 2025 Q3 |
| 5 | Texas | 5.4 | 2025 Q3 |
| 6 | Florida | 5.3 | 2025 Q3 |
| 7 | Georgia | 5.2 | 2025 Q3 |
| 8 | North Carolina | 5.1 | 2025 Q3 |
| 9 | Tennessee | 5.0 | 2025 Q3 |
| 10 | Indiana | 4.9 | 2025 Q3 |
| 11 | Ohio | 4.8 | 2025 Q3 |
| 12 | Michigan | 4.7 | 2025 Q3 |
| 13 | Illinois | 4.6 | 2025 Q3 |
| 14 | Pennsylvania | 4.6 | 2025 Q3 |
| 15 | New York | 4.5 | 2025 Q3 |
| 16 | California | 4.5 | 2025 Q3 |
| 17 | New Jersey | 4.4 | 2025 Q3 |
| 18 | Virginia | 4.4 | 2025 Q3 |
| 19 | Massachusetts | 4.3 | 2025 Q3 |
| 20 | Washington | 4.3 | 2025 Q3 |
| 21 | Arizona | 4.2 | 2025 Q3 |
| 22 | Colorado | 4.2 | 2025 Q3 |
| 23 | Minnesota | 4.1 | 2025 Q3 |
| 24 | Wisconsin | 4.1 | 2025 Q3 |
| 25 | Missouri | 4.0 | 2025 Q3 |
| 26 | Maryland | 4.0 | 2025 Q3 |
| 27 | Oregon | 3.9 | 2025 Q3 |
| 28 | Alabama | 3.9 | 2025 Q3 |
| 29 | Kentucky | 3.8 | 2025 Q3 |
| 30 | Louisiana | 3.8 | 2025 Q3 |
| 31 | Oklahoma | 3.7 | 2025 Q3 |
| 32 | South Carolina | 3.7 | 2025 Q3 |
| 33 | Iowa | 3.6 | 2025 Q3 |
| 34 | Nevada | 3.6 | 2025 Q3 |
| 35 | Utah | 3.5 | 2025 Q3 |
| 36 | Mississippi | 3.5 | 2025 Q3 |
| 37 | Nebraska | 3.4 | 2025 Q3 |
| 38 | Idaho | 3.4 | 2025 Q3 |
| 39 | Montana | 3.3 | 2025 Q3 |
| 40 | New Mexico | 3.3 | 2025 Q3 |
| 41 | West Virginia | 3.2 | 2025 Q3 |
| 42 | Delaware | 3.2 | 2025 Q3 |
| 43 | Rhode Island | 3.1 | 2025 Q3 |
| 44 | New Hampshire | 3.1 | 2025 Q3 |
| 45 | Maine | 3.0 | 2025 Q3 |
| 46 | Alaska | 2.8 | 2025 Q3 |
| 47 | Vermont | 2.6 | 2025 Q3 |
| 48 | Wyoming | 2.4 | 2025 Q3 |
| 49 | Hawaii | 1.8 | 2025 Q3 |
| 50 | North Dakota | 0.4 | 2025 Q3 |
Notes: (1) This table covers the 50 U.S. states only (DC and territories excluded). (2) Quarterly state GDP estimates can be revised as additional source data becomes available.
Commentary on the latest results
The latest quarter shows broad-based economic expansion across all 50 states, with no contractions recorded. When the entire map is positive, the key question becomes how the momentum is distributed rather than whether growth is isolated to a few locations.
The spread in outcomes is meaningful: the leading state reaches a 6.5% annualized pace, while the lowest remains positive at 0.4%. A wide range like this is common in quarterly SAAR data, because state economies differ in industry mix and in their exposure to short-term shocks.
Why quarterly state rankings move
- Industry mix: manufacturing-heavy states can react differently than service-heavy states in the same quarter.
- Timing effects: seasonal adjustment, harvest cycles, large orders, and project timing can shift measured output.
- Commodity sensitivity: resource-dependent states can swing with energy/mining output and prices (even in “real” terms, volumes matter).
- Revisions: BEA updates state estimates as more complete source data arrives, so ranks can change later.
How to use this ranking correctly
1) Read it as a momentum snapshot
A quarterly SAAR ranking is best interpreted as short-term momentum. It helps compare which states accelerated or cooled in the latest quarter, but it is not a long-run trend score.
2) Separate “speed” from “impact”
Percent growth is relative. A smaller state can rank high by percentage without adding the most output in dollars. For impact analysis, pair growth rates with GDP levels (the size of each state economy).
3) Focus on tiers, not tiny rank differences
When many states cluster around similar growth rates, small revisions can reshuffle positions. For decisions, it’s safer to compare groups (top tier, middle tier, bottom tier) and how they change over time.
Limitations
- Quarterly volatility: one quarter can be noisy; multi-quarter context is typically more stable.
- Revisions are normal: BEA revisions can change both growth rates and rankings.
- Real GDP is not a welfare measure: it reflects production, not distribution, prices paid by households, or living standards.
How we calculate and rank states
Data: BEA GDP by state (real GDP, chained dollars).
Metric: Percent change in real GDP from the previous quarter, expressed at a seasonally adjusted annual rate (SAAR).
Formula (SAAR):
Growth % = ((Real GDPcurrent / Real GDPprevious)4 − 1) × 100
Ranking: States are sorted from highest to lowest growth rate. Values are rounded to one decimal.
If BEA revises the quarter, the ranking should be updated to reflect revised official values.
FAQ
What is “real GDP” in BEA’s state data?
Real GDP is an inflation-adjusted measure of production. BEA reports it in chained dollars to better reflect changes in real output volumes rather than price changes.
How is real GDP different from nominal (current-dollar) GDP?
Nominal GDP reflects both output and price changes. Real GDP removes price effects to focus on changes in output.
What does “percent change at annual rate (SAAR)” mean?
SAAR annualizes the quarter-to-quarter change. It answers: “If this quarter’s growth rate continued for four quarters, what would the annual growth be?”
Is SAAR the same as year-over-year growth?
No. SAAR compares the latest quarter with the previous quarter. Year-over-year compares the same quarter across consecutive years.
Why can rankings change sharply from quarter to quarter?
Quarterly estimates can be influenced by seasonal adjustment, timing effects, and short-term swings in major industries. Revisions can also change earlier values.
Are the District of Columbia and U.S. territories included?
No. This ranking covers only the 50 U.S. states. DC and territories are excluded from the Top-50 states list.
Does higher % growth mean a state added more output in dollars?
Not necessarily. % growth is relative. A smaller economy can grow quickly by percentage while adding fewer total dollars of output than a larger economy with slower % growth.
Where can I access the official BEA tables?
Use BEA’s GDP-by-state data page or BEA’s interactive tables (SQGDP1) to view and download the official series.
Sources
Related rankings
More StatRanker pages connected by topic, category or ranking theme.
Top 100 Countries by Real Wage Growth (2020–2025), 2025 Update
Open rankingTop Countries by GDP Growth (Real, %), 2025
Open rankingCountries Where Wages Beat Inflation: Official Real Wage Growth Ranking, 2020–2025
Open rankingTOP 10 Countries by Real Wage Growth (2020–2025)
Open rankingStatRanker (Website)
administrator
