

Multigenerational Households in 2026: Housing Costs, Care Needs and Cultural Drivers
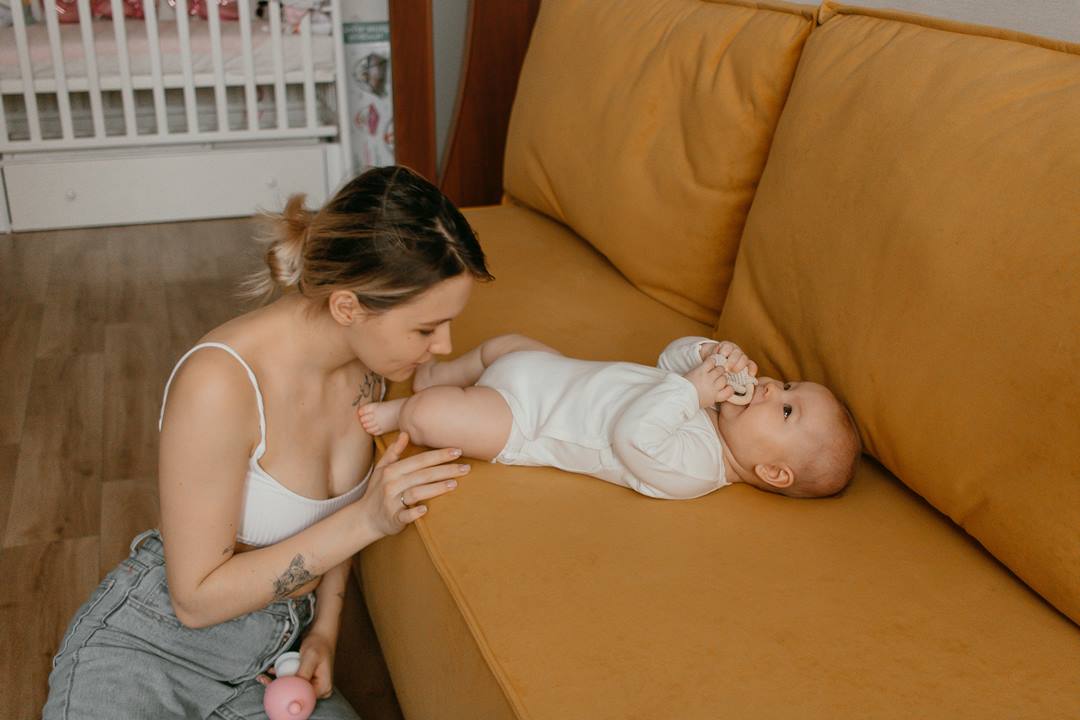
Economic pressure and family support are reshaping multigenerational living
Multigenerational households are becoming more visible because housing costs, delayed household formation, aging relatives, child care pressure and cultural expectations often meet inside the same home.
This 2026 snapshot is based on the latest available 2020–2022 public evidence and a 2025 Statistics Canada release reference. It uses sources from the U.S. Census Bureau, Pew Research Center, Statistics Canada and the United Nations household-arrangements database. It is not a forced global ranking. The table is a compiled evidence dataset because the sources use different definitions, years and units.
Financial pressure is the most frequently reported major reason in the U.S. survey evidence, but multigenerational living is not only about money. Caregiving, long-standing family arrangements, companionship, migration networks and cultural expectations also shape why families share a home.
Continue exploring
More StatRanker rankings on wages, income, housing costs and affordability.
Countries With the Largest and Smallest Number of Households
Open rankingChanging Family Structures: Rise of Single-Parent Households Globally
Open rankingTop 10 countries by share of births outside marriage
Open rankingReading rule: people, households and survey answers are different denominators. The figures below are kept in their original units so that a population estimate is not treated as the same thing as a household count or a survey response. Evidence rows include 7 official values, 8 research estimates, 4 survey responses and 1 database-context row; no official forecasts or modeled projections are added.
Summary cards
Pew Research Center estimated that 59.7 million U.S. residents lived in multigenerational households in 2021, equal to 18% of the population.
The U.S. Census Bureau counted 6.0 million households with three or more generations under one roof in the 2020 Census.
In Pew’s adult survey, financial issues were the most common major reason reported by adults in multigenerational households.
The evidence table separates official counts, research estimates, survey responses and global database context instead of merging them into one artificial score.
Overview: why shared family homes are becoming more visible
A multigenerational household can mean different things depending on the source. A narrow official definition often counts three or more generations of the same family in one home. Broader research definitions may include two adult generations, such as parents living with adult children, or grandparents living with grandchildren.
The economic driver is straightforward. When rent, mortgage payments, utilities, insurance and child care consume a larger share of income, a shared household can reduce pressure on individual adults. Young adults may stay with parents while saving money, while older adults may move closer to family when fixed income, health or mobility make independent living harder.
The cultural driver is equally important. In many families, living with parents, grandparents or adult children is not treated as a failure of independence. It can reflect family obligation, migration networks, respect for older relatives, a preference for raising children near grandparents or a practical way to keep daily support close.
The arrangement can improve resilience, but it is not automatically simple. Shared living can reduce loneliness and spread expenses while also creating stress around privacy, caregiving, household authority and unequal financial responsibility.
Key figures from the strongest available sources
These figures summarize scale, reasons and measurement limits. They are evidence points rather than a country ranking because the underlying units and definitions differ.
| Indicator | Value | Year | Source type |
|---|---|---|---|
| U.S. residents in multigenerational households | 59.7 million; 18% | 2021 | Research estimate using Census data |
| U.S. households with three or more generations | 6.0 million | 2020 | Official Census count |
| Financial issues as a major reason in the U.S. | 40% | 2021 survey | Survey response |
| Canada residents in multigenerational households | 2.4 million; 6.5% | 2021 | Official Census analysis |
Table note: values remain in the units used by the original sources. U.S. and Canadian values should not be read as directly comparable country rates because definitions differ.
Chart: major reasons U.S. adults give for shared living
Pew Research Center’s survey shows that financial pressure is the leading major reason adults give for living in a multigenerational household. Care, long-standing family arrangements and companionship also matter, so the trend is both economic and social.
Chart note: respondents could cite more than one major reason. Bar widths are scaled to the largest value in this set, not to 100% of all adults.
Methodology
This page is a latest-available evidence snapshot, not a global league table. The metric is multigenerational living, but no single international definition exists. The article therefore keeps people counts, household counts, population shares and survey responses separate.
For the United States, two complementary sources are used. The U.S. Census Bureau identifies households with three or more generations under one roof in the 2020 Census. Pew Research Center uses Census Bureau Current Population Survey data to estimate the number and share of people living with multiple generations, including two adult generations and skipped-generation households.
The driver indicators come from Pew Research Center’s October 2021 survey of adults ages 25 and older who live with a parent or grandparent, or with an adult child or grandchild age 25 or older. These answers describe reported motivations; they are not a causal model for every household.
For Canada, the page uses Statistics Canada’s 2021 Census-based analysis. Statistics Canada defines multigenerational households as households composed of three or more generations of the same family, which is narrower than broader two-adult-generation measures.
The United Nations household-arrangements database is used for global context and methodological limits. Its country coverage is broad, but reference years and national definitions vary. That makes it useful for understanding household-arrangement measurement, but not enough for a simple global Top 10 without additional harmonization.
Audit note: no modeled projections, CAGR estimates, averages or cross-source blended totals are added. Values are displayed as reported by the source and rounded only where the source itself reports a rounded public value.
Evidence table: scale, reasons and demographic patterns
Use the filters to compare evidence points by geography, source and status. Each row keeps its original source year, unit and method note, so people counts, household counts, shares and survey responses are not treated as one interchangeable ranking metric.
| Evidence no. | Evidence point | Value | Source / method note |
|---|---|---|---|
| 1 | United States residents living in multigenerational households | 59.7 million; 18% | Research estimate; Pew Research Center; 2021; CPS-based estimate of people living with multiple generations. |
| 2 | United States residents living in multigenerational households, historical comparison | 14.5 million; 7% | Research estimate; Pew Research Center; 1971 baseline used for long-term U.S. trend comparison. |
| 3 | U.S. households with three or more generations under one roof | 6.0 million | Official value; U.S. Census Bureau; 2020 Census; household count, not people count. |
| 4 | U.S. households with three or more generations, previous Census comparison | 5.1 million | Official value; U.S. Census Bureau; 2010 Census comparison against 2020 count. |
| 5 | Share of all U.S. households with three or more generations | 4.7% | Official value; U.S. Census Bureau; 2020 Census; denominator is all households. |
| 6 | Share of U.S. family households with three or more generations | 7.2% | Official value; U.S. Census Bureau; 2020 Census; denominator is family households. |
| 7 | U.S. children under 18 living in a grandparent’s home | 6.1 million; 8.4% | Official value; U.S. Census Bureau; 2020 Census; child-level count and share. |
| 8 | U.S. adults ages 25 to 29 living in multigenerational households | 31% | Research estimate; Pew Research Center; 2021; age-group estimate. |
| 9 | Black and Hispanic Americans living in multigenerational households | 26% each | Research estimate; Pew Research Center; 2021; race and ethnicity estimates reported separately with the same value. |
| 10 | Asian Americans living in multigenerational households | 24% | Research estimate; Pew Research Center; 2021; demographic estimate. |
| 11 | White Americans living in multigenerational households | 13% | Research estimate; Pew Research Center; 2021; demographic estimate. |
| 12 | Foreign-born U.S. residents living in multigenerational households | 26% | Research estimate; Pew Research Center; 2021; nativity comparison. |
| 13 | U.S.-born residents living in multigenerational households | 17% | Research estimate; Pew Research Center; 2021; nativity comparison. |
| 14 | Financial issues as a major reason for shared living | 40% | Survey response; Pew Research Center; October 2021; adults in multigenerational households. |
| 15 | Long-standing household arrangement as a major reason | 28% | Survey response; Pew Research Center; October 2021; respondents could cite multiple reasons. |
| 16 | Adult care or receiving care as a major reason | 25% | Survey response; Pew Research Center; October 2021; care-related motivation. |
| 17 | Living arrangement described as convenient all or most of the time | 58% | Survey response; Pew Research Center; October 2021; household-experience indicator. |
| 18 | Canada residents living in multigenerational households | 2.4 million; 6.5% | Official value; Statistics Canada; 2021 Census; three-generation household definition. |
| 19 | Canada children living in multigenerational households | 905,000; nearly 1 in 10 | Official value; Statistics Canada; 2021 Census; child-level figure in multigenerational households. |
| 20 | UN household-arrangements database coverage | 196 countries and areas; about 98% | Database context; United Nations DESA; 2022 edition; used for global measurement context, not ranking. |
Table note: the evidence table contains 20 confirmed rows. The display order groups scale, demographic patterns, reasons and global measurement context; it is not a value ranking because the units are intentionally mixed.
Insights
The U.S. people-based estimate rose from 14.5 million in 1971 to 59.7 million in 2021, showing that the shift is structural rather than a short-term household adjustment.
Financial pressure leads reported motivations, but the table also shows care, convenience and long-standing family arrangements. The drivers overlap rather than competing with one another.
The Census Bureau’s narrower U.S. household count is much smaller than Pew’s people-based estimate because one source counts homes with three generations, while the other counts people in broader multigenerational arrangements.
The 59.7 million U.S. value is the largest number in the table, but it is not directly comparable with Canada’s 2.4 million figure because population size and definitions differ.
What it means for readers
For families, multigenerational living can lower housing pressure and make care easier to organize. It may help younger adults save, allow older adults to stay close to relatives, reduce paid child care needs and give children more daily contact with grandparents.
The arrangement can also shift costs instead of removing them. One adult may become the default caregiver. Privacy can become limited. Financial responsibilities may feel unfair if bills, ownership, rent, food costs and household labor are not discussed clearly.
For housing policy, the data point to demand for larger units, accessory dwelling options, accessible home modifications and support for unpaid caregivers. A housing market built only around single adults or nuclear families does not match how many households actually operate.
For anyone using the data, the main rule is precision. Before citing a number, check the definition, year, geography, unit and denominator. People, households, family households and survey respondents answer different questions.
FAQ
What counts as a multigenerational household?
It depends on the source. The U.S. Census Bureau discussion focuses on households with three or more generations under one roof. Pew Research Center uses a broader U.S. definition that includes two or more adult generations and skipped-generation households.
Is multigenerational living mostly about money?
Money is a major driver, but it is not the whole story. Pew’s survey found that 40% of adults in U.S. multigenerational households cited financial issues as a major reason, while care, companionship and long-standing arrangements also appeared in the same evidence base.
Why do official sources report different percentages?
Percentages change when the denominator changes. A people-based estimate can be much larger than a household count because one household may include several people. A three-generation definition is narrower than a two-adult-generation definition.
Can shared living reduce financial stress?
It can reduce stress by pooling expenses for housing, utilities, food, child care and elder support. The benefit depends on income, space, caregiving needs and whether household responsibilities are shared fairly.
Why is there no global Top 10 ranking here?
A reliable global ranking would require the same definition, reference year and household denominator across countries. The United Nations database is valuable for context, but national methods and reference dates vary.
What should families discuss before living together?
Families should clarify rent or mortgage contributions, utility costs, food expenses, caregiving duties, privacy, shared rooms, decision-making and exit plans. The arrangement works better when expectations are explicit from the start.
Sources
Used for 2020 U.S. household counts, household shares and children living in grandparents’ homes. Source
Used for U.S. population estimates, long-term trend data, age, race, ethnicity and nativity patterns. Source
Used for reported reasons, convenience and household-experience indicators. Source
Used for Canada’s 2021 Census-based counts and shares. Source
Used for global database coverage, household-arrangement context and comparability limits. Source
Related rankings
More StatRanker rankings on wages, income, housing costs and affordability.
Top 10 countries by divorce rate
Open rankingTop 10 countries by age at first marriage (m/f)
Open rankingChildfree Movement: Why More Couples Are Choosing Not to Have Kids
Open rankingSame-Sex Families: Adoption and Legal Recognition Worldwide
Open ranking
StatRanker (Website)
administrator
