


Why Grocery Bills Outrun Inflation: Hidden Cost Drivers Behind Food Prices
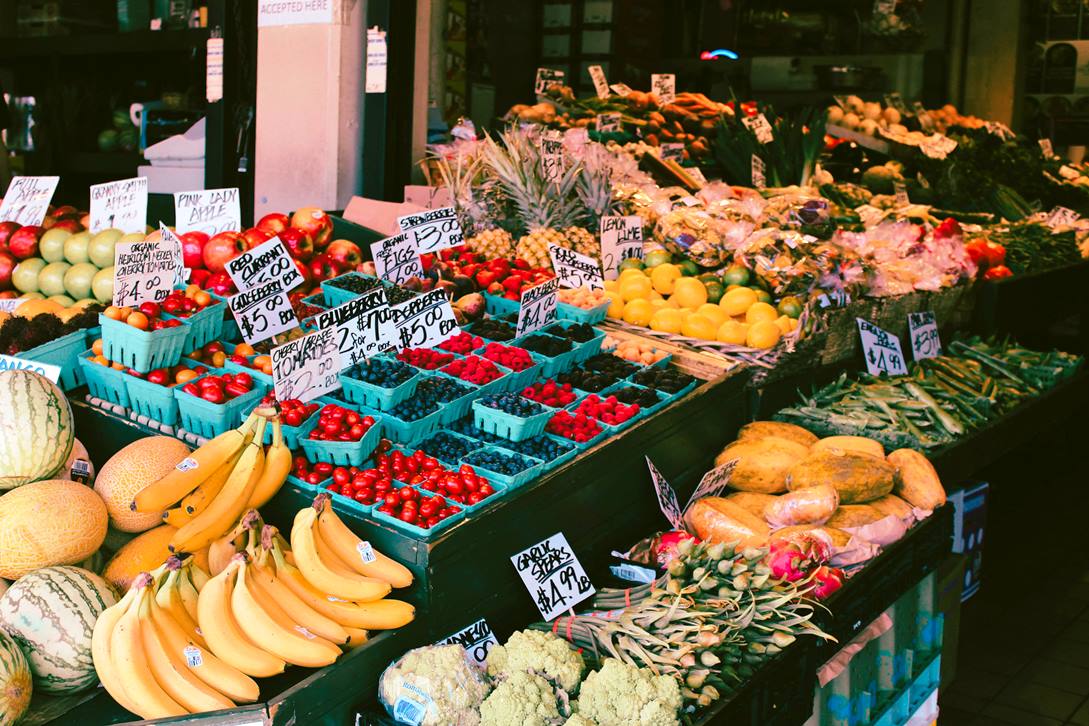
Why grocery bills can rise faster than headline inflation
Food prices can rise faster than headline inflation because food depends on a separate cost chain: farm inputs, processing, packaging, freight, refrigeration, labor, rent, energy, disease losses and global commodity markets. Headline CPI averages many categories, so a calmer headline number can hide pressure in groceries and restaurant meals.
Thank you for reading this post, don't forget to subscribe!This 2026 snapshot uses a compiled research dataset based on BLS CPI, USDA ERS Food Price Outlook, USDA ERS Food Dollar, FAO Food Price Index and World Bank food-security monitoring. The unit is shown row by row because the table combines percent changes, official forecasts, cents per food dollar, index points and country shares.
The table is an indicator map, not a ranking of causes. It includes 9 official values, 3 official forecasts and no modeled projections.
Continue exploring
More StatRanker rankings on wages, income, housing costs and affordability.
US States by Cost of Living in 2026: Latest 2025 Annual Snapshot
Open rankingTop 100 Countries by Food Inflation (%), 2025 — Full Ranking + Context
Open rankingTOP 10 Countries with Highest Food Inflation (2025)
Open rankingFood-price pressure in five numbers
BLS December 2024 to December 2025 comparison: food rose faster than all-items CPI.
Restaurant and prepared-meal prices rose faster than total food in the BLS comparison period.
USDA ERS 2024 marketing share of each domestically produced U.S. food dollar.
USDA ERS prediction for food-at-home prices in 2026.
Five official or international source groups; all values are shown in the HTML table.
Overview: why food feels different from headline CPI
A food price is not only a farm price. A shelf item or restaurant meal includes the cost of transport, processing, packaging, cold storage, insurance, utilities, rent, wages, inventory losses and retail operations. That is why a fall in a raw commodity price does not always turn into a quick fall in the price paid by households.
Inflation rate and price level are different. Inflation measures how fast prices are moving over a period. The price level is what the shopper actually pays. Food inflation can slow while the grocery bill remains high because earlier increases are still built into current prices.
Food is also bought frequently and cannot be postponed like many durable goods. Consumers notice small weekly changes, and category spikes in items such as coffee, beef, eggs, vegetables or prepared meals can shape the household experience more than the average CPI number.
Top table: selected indicators behind food-price pressure
These four indicators are the clearest starting points for reading the full map. They are not ranked by impact because the units differ.
| No. | Indicator | Value | Unit | Source |
|---|---|---|---|---|
| 1 | Food CPI change | 3.1% | percent change | BLS, Dec 2024 to Dec 2025 |
| 2 | All-items CPI change | 2.7% | percent change | BLS, Dec 2024 to Dec 2025 |
| 3 | Marketing share of food dollar | 88.2¢ | cents per food dollar | USDA ERS Food Dollar, 2024 |
| 4 | Food-at-home forecast | 3.2% | forecast percent change | USDA ERS, 2026 forecast |
Table note: values use different units and should not be compared as one numeric ranking.
Chart: post-farm costs inside consumer food prices
USDA ERS Food Dollar data show why consumer prices can stay firm even when some farm or wholesale prices cool. Most of the domestically produced U.S. food dollar is tied to post-farm activity.
Chart note: the food-away-from-home measures use a different food-dollar account from the all-food farm and marketing shares.
Methodology
The metric is food-price pressure relative to headline inflation. Because no single official dataset measures every hidden cost driver, this page uses a compiled research dataset from official and international sources. The table is an indicator map, not a composite score.
Metric
The page compares consumer food-price pressure using CPI changes, official forecasts, Food Dollar cost shares, a global commodity-price index and country-share monitoring.
Unit handling
Each row keeps its original unit: percent change, forecast percent change, cents per food dollar, index points, count of categories or share of countries.
Ordering
Rows are ordered for explanation, not by causal strength. A value of 130.8 index points is not comparable with 88.2 cents or 3.1 percent.
Status
official_value means a published value. official_forecast means a source forecast. No modeled_projection rows are used.
Limits
The table does not estimate retailer margins, household hardship, country rankings or exact pass-through from farm prices to store prices.
BLS values are December 2024 to December 2025 changes. USDA Food Price Outlook rows are May 2026 official forecasts. USDA Food Dollar rows use the 2024 food-dollar update. FAO is the May 2026 Food Price Index level. World Bank is the share of low-income countries with food inflation above 5% between January and March 2026.
Main indicator map: official data behind food-price pressure
The full table keeps every indicator in its source unit. Filters help readers isolate source groups and status types; they do not create new data.
| No. | Indicator | Value | Unit | Source note |
|---|---|---|---|---|
| 1 | Food CPI change | 3.1% | percent change | official_valueBLS, December 2024 to December 2025. Total food rose faster than all-items CPI. |
| 2 | All-items CPI change | 2.7% | percent change | official_valueBLS, December 2024 to December 2025. Broad CPI rose more slowly than food. |
| 3 | Food away from home | 4.1% | percent change | official_valueBLS, December 2024 to December 2025. Restaurant and prepared-food prices rose faster than total food. |
| 4 | Food at home | 2.4% | percent change | official_valueBLS, December 2024 to December 2025. Grocery prices rose more slowly than restaurant prices. |
| 5 | Food-at-home forecast | 3.2% | forecast percent change | official_forecastUSDA ERS May 2026 forecast. Food-at-home prices are predicted to increase 3.2% in 2026. |
| 6 | Food-away forecast | 3.5% | forecast percent change | official_forecastUSDA ERS May 2026 forecast. Food-away-from-home prices are predicted to increase 3.5% in 2026. |
| 7 | Categories above trend | 9 of 15 | category count | official_forecastUSDA ERS May 2026 forecast. Nine food-at-home categories are predicted to grow faster than their 20-year average. |
| 8 | Marketing share | 88.2¢ | cents per food dollar | official_valueUSDA ERS Food Dollar, 2024. Post-farm activity made up 88.2 cents of each domestically produced U.S. food dollar. |
| 9 | Farm share | 11.8¢ | cents per food dollar | official_valueUSDA ERS Food Dollar, 2024. Farm establishments received 11.8 cents per domestically produced U.S. food dollar. |
| 10 | Foodservices share | 65.8¢ | cents per food-away dollar | official_valueUSDA ERS Food Dollar, 2024. Foodservices industry group share of the food-away-from-home dollar. |
| 11 | Foodservice labor | 44.2¢ | cents per food-away dollar | official_valueUSDA ERS Food Dollar, 2024. Labor inside the foodservices share helps explain sticky restaurant prices. |
| 12 | FAO Food Price Index | 130.8 | index points | official_valueFAO, May 2026. The index was broadly stable, with commodity groups moving in different directions. |
| 13 | Low-income country pressure | 45.0% | country share | official_valueWorld Bank, January to March 2026. Share of low-income countries with domestic food inflation above 5%. |
Table note: this compiled research dataset has 13 confirmed rows because food at home was added as a separate BLS line for clarity. The table is not sorted by value because the units are mixed.
Insights
Key insight
Food prices can diverge from headline CPI because the food basket has its own cost chain and is purchased much more frequently than many other CPI items.
Notable pattern
Restaurant prices are more persistent than many grocery categories because wages, rent, utilities and service overhead remain part of each meal price.
Cost concentration
The largest Food Dollar signal is the marketing share, which points to processing, distribution, retailing and food service rather than only farm prices.
Outlier risk
Food inflation is more severe for low-income households and low-income countries because food absorbs a larger share of budgets.
What it means for readers
A lower headline inflation number does not automatically mean cheaper groceries. It may only mean that prices are rising more slowly. The checkout total can still be far above the level households remember from earlier years.
For consumers, the useful distinction is simple: inflation is the speed of increase, while the grocery bill is the price level. A household can feel pressure even after inflation slows if wages, substitutions or store choices do not offset the higher level.
For analysts, food needs separate monitoring because food is essential, politically sensitive and unevenly felt across income groups. The same food-price increase matters more to a household that spends a large share of income on food.
FAQ
Why can food prices rise faster than headline inflation?
Food has a separate cost chain that includes farm inputs, processing, packaging, transport, refrigeration, labor, rent and spoilage. These costs can move differently from the broad CPI basket.
Is food inflation the same as the grocery bill?
No. Food inflation is the rate of price change. The grocery bill is the price level households pay. Inflation can slow while the price level remains high.
Why do restaurant prices stay high?
Food away from home includes wages, rent, utilities, insurance and service overhead. Those costs usually adjust more slowly than some commodity prices.
Why do grocery prices not fall when farm prices fall?
The farm share is only one part of the final price. USDA ERS Food Dollar data show that most of the domestically produced U.S. food dollar is tied to post-farm activity.
Does this page rank the causes of food inflation?
No. It is an indicator map. The values use different units, so they should not be read as one ranked list of causal strength.
Which source should be used for U.S. food inflation?
BLS CPI is the main source for U.S. consumer price changes. USDA ERS adds forecasts and food-system cost detail. FAO and World Bank add global context.
Sources
Source cards list the official pages used for the indicator map.
Used for December 2024 to December 2025 all-items CPI, total food, food at home and food away from home price changes.
Used for 2026 official food-price forecasts and category notes.
Used for 2024 farm share, marketing share, foodservices share and labor share indicators.
Used for the May 2026 global food commodity-price index level.
Used for domestic food-inflation monitoring across income groups.
Related rankings
More StatRanker rankings on wages, income, housing costs and affordability.
Consumer Price Index: How It Is Formed and Why It Matters
Open rankingTop 100 Countries by Inflation Rate (Consumer Prices), Latest Year
Open rankingWhat Drives Price Increases: Inflation Analysis for 2020–2025
Open ranking
StatRanker (Website)
administrator
