

Adult Obesity Rate by U.S. State: 2025 CDC Ranking
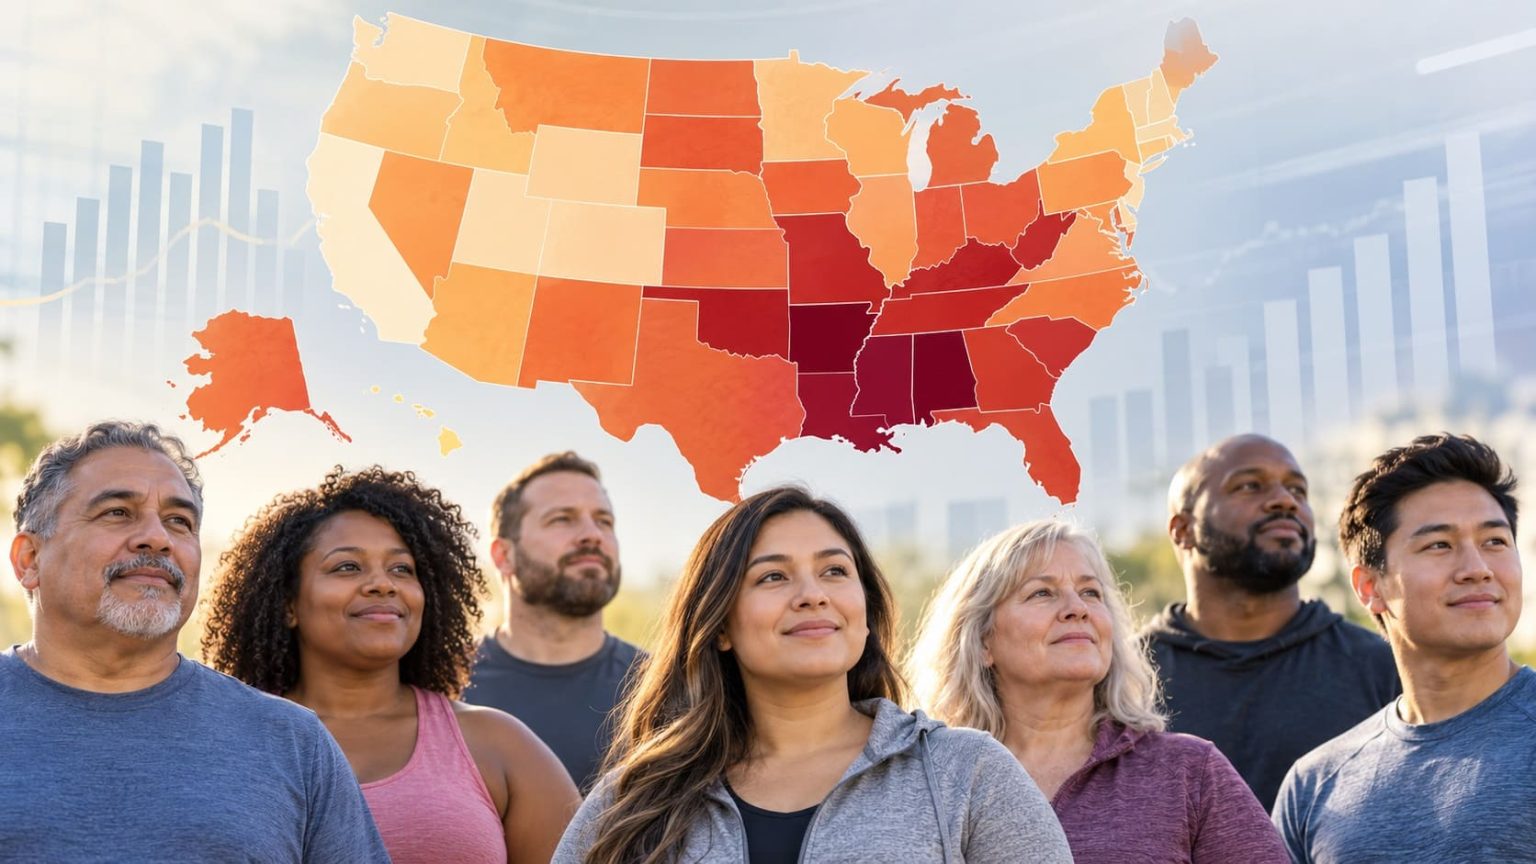
Adult Obesity Rate by U.S. State: 2025 CDC Ranking
Using CDC BRFSS data for 2025, StatRanker ranks states by the estimated share of adults aged 18 or older with a body mass index (BMI) of 30 or higher. The figures come from self-reported height and weight. 47 of the 50 U.S. states have a usable estimate; higher percentages rank first. The unit is percent of adults, not the number of people with obesity.
The Centers for Disease Control and Prevention (CDC) published the 2025 Behavioral Risk Factor Surveillance System (BRFSS) estimates on September 24, 2026. Source check: October 24, 2026. All 47 ranked rates are official_value, with no projected or modeled rates. StatRanker sorts the published CDC values and separately calculates summary statistics and 2024–2025 differences from observed inputs, not forecasts.
CDC did not publish usable 2025 estimates for California, Mississippi or Nevada, so those states are not ranked. Washington, D.C., and U.S. territories are outside this 50-state comparison.
Alabama, CDC BRFSS 2025; rank 1 of 47 states.
Colorado, CDC BRFSS 2025; rank 47. D.C. is lower but is not a state.
47 published state estimates; 3 states have insufficient or unavailable data.
Unweighted median of 47 official 2025 values; StatRanker calculation, not the U.S. national rate.
Overview: highest and lowest obesity rates in 2025
Alabama leads at 39.7%, just 0.6 percentage points above North Dakota (39.1%); Kentucky is third at 38.8%. At the other end, Colorado (25.7%) and Hawaii (26.4%) have the lowest rates, followed by Massachusetts and New Jersey, tied at 27.0%. The spread from first to last is 14.0 percentage points.
Of the 47 ranked states, 21 (44.7%) have rates of at least 35%; another 19 are at 30.0%–34.9%, and seven are below 30%. No published state estimate reaches 40%. These are counts of states, not shares of the U.S. adult population.
CDC reports regional adult obesity prevalence of 35.5% in the Midwest, 34.8% in the South, 30.7% in the West and 29.6% in the Northeast. Those survey-weighted regional figures should not be confused with the equal-weight counts of states used in the distribution analysis below.
The order reflects point estimates, not statistically confirmed differences between adjacent states. Alabama's 95% confidence interval (37.7%–41.7%) overlaps North Dakota's (37.3%–40.8%).
Top 10 U.S. states with the highest adult obesity rate in 2025
The first ten states range from Alabama at 39.7% to Arkansas at 36.7%, a difference of 3.0 percentage points. Every value comes from CDC's 2025 survey; none is filled with a figure from an earlier year.
StatRanker ranking of CDC BRFSS 2025 · adult obesity prevalence (%) · highest first
| Rank | State | Rate | Region / note |
|---|---|---|---|
| 1 | Alabama | 39.7% | South; CDC BRFSS 2025; official_value; 95% CI 37.7–41.7%. |
| 2 | North Dakota | 39.1% | Midwest; CDC BRFSS 2025; official_value; 95% CI 37.3–40.8%. |
| 3 | Kentucky | 38.8% | South; CDC BRFSS 2025; official_value; 95% CI 37.1–40.6%. |
| 4 | Oklahoma | 38.1% | South; CDC BRFSS 2025; official_value; 95% CI 36.3–39.9%. |
| 5 | Tennessee | 37.9% | South; CDC BRFSS 2025; official_value; 95% CI 36.1–39.7%. |
| 6 | Indiana | 37.5% | Midwest; CDC BRFSS 2025; official_value; 95% CI 35.7–39.3%. |
| 7 | West Virginia | 37.4% | South; CDC BRFSS 2025; official_value; 95% CI 35.6–39.3%. |
| 8 | Kansas | 37.3% | Midwest; CDC BRFSS 2025; official_value; 95% CI 36.0–38.6%. |
| 9 | Iowa | 36.9% | Midwest; CDC BRFSS 2025; official_value; 95% CI 35.7–38.2%. |
| 10 | Arkansas | 36.7% | South; CDC BRFSS 2025; official_value; 95% CI 34.9–38.6%. |
The rates and 95% confidence intervals were published by CDC. StatRanker assigns ranks from highest to lowest rate; tied values share a rank.
Chart: top 20 state adult obesity rates in 2025
Bars use the same CDC rates as the table, on a scale from 0% to 40% adult prevalence. The right edge marks the chart scale, not the share of the U.S. population represented by a state.
New Mexico is 20th at 35.3%. Tied states share a rank, and bar lengths reflect prevalence values rather than an invented ranking score.
Methodology: CDC BRFSS 2025 adult obesity estimates
Definition and direction
Adult obesity prevalence is the survey-weighted percentage of respondents aged 18 and older with BMI ≥ 30 kg/m², derived from self-reported height and weight. Larger prevalence ranks higher. Unit: percent of adults; changes are in percentage points.
Data year and provenance
2025 values and 95% confidence intervals come from CDC's BRFSS 2025 state appendix; 2024 baseline values come from the 2024 table in the same CDC document. Published September 24, 2026; checked October 24, 2026. One numeric publishing organization: CDC.
Inclusion and exclusions
The table contains the 47 states for which CDC published a usable 2025 estimate. CDC has insufficient data for California, Mississippi and Nevada. Its suppression rule covers samples smaller than 50, relative standard errors of at least 30%, or missing data. Washington, D.C., and U.S. territories are not included in state ranks.
Status and tie rules
All 47 primary 2025 rates are official_value. The ranking contains no imputed values or forecasts. StatRanker sorts CDC's published one-decimal rates from high to low. States with identical values share a competition rank and appear alphabetically within the tie.
StatRanker calculations
Spread = 39.7 − 25.7 = 14.0 percentage points. Median = middle of 47 sorted state values = 33.7%. Share at 35% or above = 21 / 47 × 100 = 44.7%. Regional concentration = (11 South + 9 Midwest) / 21 × 100 = 95.2%. All are unweighted state-level summaries.
Observed historical comparison
For each state with both years observed, change in percentage points = official 2025 rate − official 2024 rate. There are 46 such states. Tennessee has no 2024 estimate; California, Mississippi and Nevada have no 2025 estimate. The median difference is −0.3 pp. These differences are StatRanker calculated_value; the underlying rates remain official_value. No missing values are estimated.
Regional coding: State counts use the Census Bureau's Northeast, Midwest, South and West divisions of the country. CDC's population-weighted regional prevalence estimates use a different denominator, so they are not reconstructed by averaging state rates. This 2025 ranking uses BRFSS only: it does not mix in clinically measured NHANES data, PLACES model estimates or older-year replacements.
Uncertainty and limitations: BRFSS is a telephone survey; weight and height are self-reported. Sampling variation, recall/reporting bias and survey coverage can affect estimates. A difference between two point estimates is not, by itself, evidence of statistically significant change. The ranking does not measure new cases (incidence), obesity severity, absolute counts, childhood obesity, causes, or future prevalence. Values are displayed to the single decimal published by CDC.
Full 2025 adult obesity rate ranking: 47 U.S. states
Search by state, filter by Census region or change the sorting order. Top 10 and Top 20 always refer to the original nationwide 2025 ranks, even after sorting; a region or search filter may return fewer matches. Each row shows the 2025 CDC estimate, its 95% confidence interval and, where available, a 2024 baseline with a separately calculated change.
Showing 47 of 47 states.
| Rank | State | Rate | Region / source / uncertainty |
|---|---|---|---|
| 1 | Alabama | 39.7% | South; CDC BRFSS 2025; official_value; 95% CI 37.7–41.7%; 2024 38.9%; StatRanker calculated_value (2025 minus 2024): +0.8 pp. |
| 2 | North Dakota | 39.1% | Midwest; CDC BRFSS 2025; official_value; 95% CI 37.3–40.8%; 2024 36.8%; StatRanker calculated_value (2025 minus 2024): +2.3 pp. |
| 3 | Kentucky | 38.8% | South; CDC BRFSS 2025; official_value; 95% CI 37.1–40.6%; 2024 37.2%; StatRanker calculated_value (2025 minus 2024): +1.6 pp. |
| 4 | Oklahoma | 38.1% | South; CDC BRFSS 2025; official_value; 95% CI 36.3–39.9%; 2024 36.8%; StatRanker calculated_value (2025 minus 2024): +1.3 pp. |
| 5 | Tennessee | 37.9% | South; CDC BRFSS 2025; official_value; 95% CI 36.1–39.7%; 2024 estimate unavailable. |
| 6 | Indiana | 37.5% | Midwest; CDC BRFSS 2025; official_value; 95% CI 35.7–39.3%; 2024 38.4%; StatRanker calculated_value (2025 minus 2024): -0.9 pp. |
| 7 | West Virginia | 37.4% | South; CDC BRFSS 2025; official_value; 95% CI 35.6–39.3%; 2024 41.4%; StatRanker calculated_value (2025 minus 2024): -4.0 pp. |
| 8 | Kansas | 37.3% | Midwest; CDC BRFSS 2025; official_value; 95% CI 36.0–38.6%; 2024 37.6%; StatRanker calculated_value (2025 minus 2024): -0.3 pp. |
| 9 | Iowa | 36.9% | Midwest; CDC BRFSS 2025; official_value; 95% CI 35.7–38.2%; 2024 36.6%; StatRanker calculated_value (2025 minus 2024): +0.3 pp. |
| 10 | Arkansas | 36.7% | South; CDC BRFSS 2025; official_value; 95% CI 34.9–38.6%; 2024 38.9%; StatRanker calculated_value (2025 minus 2024): -2.2 pp. |
| 11 | Missouri | 36.6% | Midwest; CDC BRFSS 2025; official_value; 95% CI 34.9–38.4%; 2024 34.6%; StatRanker calculated_value (2025 minus 2024): +2.0 pp. |
| 11 | Wisconsin | 36.6% | Midwest; CDC BRFSS 2025; official_value; 95% CI 35.3–37.9%; 2024 37.4%; StatRanker calculated_value (2025 minus 2024): -0.8 pp. |
| 13 | South Carolina | 36.5% | South; CDC BRFSS 2025; official_value; 95% CI 33.6–39.5%; 2024 34.6%; StatRanker calculated_value (2025 minus 2024): +1.9 pp. |
| 14 | Delaware | 36.3% | South; CDC BRFSS 2025; official_value; 95% CI 34.1–38.5%; 2024 36.6%; StatRanker calculated_value (2025 minus 2024): -0.3 pp. |
| 15 | Texas | 36.1% | South; CDC BRFSS 2025; official_value; 95% CI 34.3–38.0%; 2024 35.6%; StatRanker calculated_value (2025 minus 2024): +0.5 pp. |
| 16 | Nebraska | 36.0% | Midwest; CDC BRFSS 2025; official_value; 95% CI 34.3–37.6%; 2024 37.6%; StatRanker calculated_value (2025 minus 2024): -1.6 pp. |
| 16 | Ohio | 36.0% | Midwest; CDC BRFSS 2025; official_value; 95% CI 34.5–37.6%; 2024 36.9%; StatRanker calculated_value (2025 minus 2024): -0.9 pp. |
| 18 | Georgia | 35.9% | South; CDC BRFSS 2025; official_value; 95% CI 34.2–37.7%; 2024 35.4%; StatRanker calculated_value (2025 minus 2024): +0.5 pp. |
| 19 | Louisiana | 35.6% | South; CDC BRFSS 2025; official_value; 95% CI 33.9–37.4%; 2024 39.2%; StatRanker calculated_value (2025 minus 2024): -3.6 pp. |
| 20 | New Mexico | 35.3% | West; CDC BRFSS 2025; official_value; 95% CI 32.9–37.7%; 2024 34.5%; StatRanker calculated_value (2025 minus 2024): +0.8 pp. |
| 21 | Michigan | 35.1% | Midwest; CDC BRFSS 2025; official_value; 95% CI 33.8–36.4%; 2024 36.1%; StatRanker calculated_value (2025 minus 2024): -1.0 pp. |
| 22 | South Dakota | 34.3% | Midwest; CDC BRFSS 2025; official_value; 95% CI 31.8–37.0%; 2024 37.0%; StatRanker calculated_value (2025 minus 2024): -2.7 pp. |
| 23 | Virginia | 34.2% | South; CDC BRFSS 2025; official_value; 95% CI 32.2–36.3%; 2024 32.3%; StatRanker calculated_value (2025 minus 2024): +1.9 pp. |
| 24 | Illinois | 33.7% | Midwest; CDC BRFSS 2025; official_value; 95% CI 32.5–34.8%; 2024 34.2%; StatRanker calculated_value (2025 minus 2024): -0.5 pp. |
| 25 | North Carolina | 33.5% | South; CDC BRFSS 2025; official_value; 95% CI 31.5–35.5%; 2024 34.5%; StatRanker calculated_value (2025 minus 2024): -1.0 pp. |
| 25 | Pennsylvania | 33.5% | Northeast; CDC BRFSS 2025; official_value; 95% CI 31.1–36.0%; 2024 34.2%; StatRanker calculated_value (2025 minus 2024): -0.7 pp. |
| 27 | Maryland | 33.1% | South; CDC BRFSS 2025; official_value; 95% CI 31.9–34.3%; 2024 32.7%; StatRanker calculated_value (2025 minus 2024): +0.4 pp. |
| 27 | Minnesota | 33.1% | Midwest; CDC BRFSS 2025; official_value; 95% CI 32.0–34.1%; 2024 32.3%; StatRanker calculated_value (2025 minus 2024): +0.8 pp. |
| 29 | Alaska | 33.0% | West; CDC BRFSS 2025; official_value; 95% CI 31.2–35.0%; 2024 34.0%; StatRanker calculated_value (2025 minus 2024): -1.0 pp. |
| 29 | Maine | 33.0% | Northeast; CDC BRFSS 2025; official_value; 95% CI 31.8–34.2%; 2024 33.2%; StatRanker calculated_value (2025 minus 2024): -0.2 pp. |
| 31 | Oregon | 32.7% | West; CDC BRFSS 2025; official_value; 95% CI 31.1–34.4%; 2024 33.5%; StatRanker calculated_value (2025 minus 2024): -0.8 pp. |
| 32 | Idaho | 32.6% | West; CDC BRFSS 2025; official_value; 95% CI 30.5–34.7%; 2024 32.7%; StatRanker calculated_value (2025 minus 2024): -0.1 pp. |
| 32 | Wyoming | 32.6% | West; CDC BRFSS 2025; official_value; 95% CI 30.8–34.5%; 2024 32.5%; StatRanker calculated_value (2025 minus 2024): +0.1 pp. |
| 34 | Arizona | 32.3% | West; CDC BRFSS 2025; official_value; 95% CI 30.1–34.5%; 2024 33.3%; StatRanker calculated_value (2025 minus 2024): -1.0 pp. |
| 35 | New Hampshire | 31.6% | Northeast; CDC BRFSS 2025; official_value; 95% CI 29.6–33.6%; 2024 31.1%; StatRanker calculated_value (2025 minus 2024): +0.5 pp. |
| 36 | Rhode Island | 31.3% | Northeast; CDC BRFSS 2025; official_value; 95% CI 29.6–33.0%; 2024 31.1%; StatRanker calculated_value (2025 minus 2024): +0.2 pp. |
| 37 | Washington | 31.0% | West; CDC BRFSS 2025; official_value; 95% CI 30.2–31.9%; 2024 31.5%; StatRanker calculated_value (2025 minus 2024): -0.5 pp. |
| 38 | Connecticut | 30.4% | Northeast; CDC BRFSS 2025; official_value; 95% CI 28.9–31.9%; 2024 32.0%; StatRanker calculated_value (2025 minus 2024): -1.6 pp. |
| 39 | Montana | 30.3% | West; CDC BRFSS 2025; official_value; 95% CI 28.8–31.8%; 2024 31.0%; StatRanker calculated_value (2025 minus 2024): -0.7 pp. |
| 40 | Florida | 30.0% | South; CDC BRFSS 2025; official_value; 95% CI 28.4–31.6%; 2024 29.6%; StatRanker calculated_value (2025 minus 2024): +0.4 pp. |
| 41 | Utah | 29.8% | West; CDC BRFSS 2025; official_value; 95% CI 28.6–30.9%; 2024 31.0%; StatRanker calculated_value (2025 minus 2024): -1.2 pp. |
| 42 | Vermont | 29.1% | Northeast; CDC BRFSS 2025; official_value; 95% CI 27.6–30.6%; 2024 29.0%; StatRanker calculated_value (2025 minus 2024): +0.1 pp. |
| 43 | New York | 28.5% | Northeast; CDC BRFSS 2025; official_value; 95% CI 27.6–29.6%; 2024 29.5%; StatRanker calculated_value (2025 minus 2024): -1.0 pp. |
| 44 | Massachusetts | 27.0% | Northeast; CDC BRFSS 2025; official_value; 95% CI 25.8–28.3%; 2024 27.0%; StatRanker calculated_value (2025 minus 2024): 0.0 pp. |
| 44 | New Jersey | 27.0% | Northeast; CDC BRFSS 2025; official_value; 95% CI 25.4–28.7%; 2024 27.7%; StatRanker calculated_value (2025 minus 2024): -0.7 pp. |
| 46 | Hawaii | 26.4% | West; CDC BRFSS 2025; official_value; 95% CI 25.0–27.8%; 2024 27.0%; StatRanker calculated_value (2025 minus 2024): -0.6 pp. |
| 47 | Colorado | 25.7% | West; CDC BRFSS 2025; official_value; 95% CI 24.6–26.7%; 2024 25.0%; StatRanker calculated_value (2025 minus 2024): +0.7 pp. |
All 2025 rates and 95% confidence intervals are CDC BRFSS official_value. Where present, the 2024 rate is a separate official CDC observation; the year-to-year difference (2025 minus 2024) is StatRanker calculated_value in percentage points. Ties share a rank. The table does not replace missing 2025 rates with older observations.
Four findings from the 2025 CDC state obesity data
Key Insight
The gap between Alabama (39.7%) and Colorado (25.7%) is 14.0 percentage points. The middle state in the 47-entry ranking is at 33.7%. Each state counts once in that median, regardless of population.
Notable Pattern
In the 46-state matched sample, 26 rates fell, 19 rose and 1 stayed the same from 2024 to 2025. The median change in the published point estimates was −0.3 percentage points; these differences have not been tested for statistical significance.
Regional Concentration
Among the 21 states with rates of at least 35%, 11 are Southern and 9 Midwestern: 20 of 21 (95.2%). New Mexico (35.3%) is the only Western state in this group; no Northeastern state reaches 35%.
Outlier
West Virginia has the largest observed drop among the 46 comparable states, from 41.4% in 2024 to 37.4% in 2025: −4.0 percentage points. This is a change in survey estimates, not evidence of a specific cause.
What the CDC obesity ranking does—and does not—mean
Use the ranking to compare reported prevalence across states, not to estimate how many residents have obesity. A high percentage does not necessarily mean a high number of affected adults. BRFSS also relies on self-reported height and weight rather than clinical measurements.
Alabama and North Dakota are separated by just 0.6 percentage points, and their 95% confidence intervals overlap. Treating first place versus second place as proof of a meaningful difference would overstate what these survey estimates show.
Mississippi illustrates why the observation year matters: CDC published 40.4% for 2024 but no usable 2025 rate. Putting that older figure into the 2025 table would distort the comparison. A rise or fall between two survey years also cannot, on its own, identify a cause.
FAQ about 2025 adult obesity rates by state
Which state had the highest adult obesity rate in 2025?
Alabama ranked first among the 47 states with usable CDC BRFSS data at 39.7%. North Dakota followed at 39.1%, then Kentucky at 38.8%.
Which state had the lowest rate?
Colorado was lowest among ranked states at 25.7%. Washington, D.C., had a lower published jurisdiction estimate of 24.2%, but it is not one of the 50 states and is not included in the rank order.
Are these actually 2025 data or 2026 projections?
These are survey estimates for 2025, released by CDC on September 24, 2026. There are no 2026 projections in the ranking.
Why are California, Mississippi and Nevada missing?
CDC did not publish a usable 2025 estimate for those states. Replacing missing values with 2024 figures would make the ranking incomparable, so only 47 states appear.
What qualifies as adult obesity in these data?
For adults aged 18 and older, obesity is defined as BMI of at least 30 kg/m². BRFSS computes BMI from self-reported weight and height collected in a population survey, not from a clinician's physical examination.
How were ties and confidence intervals treated?
Equal one-decimal rates receive the same rank. The 95% confidence intervals show estimation uncertainty; they are not used to break ties or claim that one closely ranked state is definitively above another.
How are the 2024–2025 changes calculated?
Change equals the published 2025 percentage minus the published 2024 percentage, expressed in percentage points. Exactly 46 states have both inputs. Tennessee lacks 2024 data; California, Mississippi and Nevada lack 2025 data. These are observed-year calculations, not predictions or proof of a trend.
Is the 33.7% median the U.S. national obesity prevalence?
No. The 33.7% figure is the unweighted middle value across 47 ranked states. It gives each state one observation regardless of adult population size, so it must not be presented as a national population estimate.
Sources and data provenance
CDC is the sole publisher of the 2025 and 2024 numeric observations used here. Its other pages explain definitions and data coverage. The U.S. Census Bureau provides only the geographic grouping, not the obesity rates.
BRFSS 2011–2025 obesity prevalence tables
Published state percentages and 95% confidence intervals for 2025; published 2024 values used solely as historical inputs. Primary record for the ranked values and year-to-year calculations.
https://www.cdc.gov/obesity/media/pdfs/2026/09/2011-2025_overall-obesity-prevalence-maps-508.pdfAdult Obesity Prevalence Maps
Confirms 2025 publication/update date, 47-state coverage, suppressed locations, prevalence bands, and published geographic-region estimates. Not an independent second numeric publisher.
https://www.cdc.gov/obesity/data-and-statistics/adult-obesity-prevalence-maps.htmlBehavioral Risk Factor Surveillance System
Defines the state-based adult telephone survey used to collect self-reported health data and explains the BRFSS survey setting.
https://www.cdc.gov/brfss/index.htmlCensus regions and divisions
Defines the Northeast, Midwest, South and West membership used solely for StatRanker's regional counts and concentration calculations, not obesity values.
https://www.census.gov/data/data-tools/survey-explorer/geo.htmlDownload the Adult Obesity Rate by U.S. State: 2025 CDC Ranking dataset
Adult Obesity Rate by U.S. State: 2025 CDC Ranking
47 ranked entries · Excel + CSV + methodology + sources + chart · Snapshot: CDC BRFSS adult obesity prevalence 2025; published 2026-09-24 · Version 1.0
The archive includes machine-readable data, methodology and source documentation. Quick human verification is required before the ZIP is delivered. Full Data Pack downloads require a free account. Free accounts can download 1 different Data Pack every 30 days; re-downloading the same pack does not use another slot. Annual Data Access provides unlimited manual downloads while annual access is active.
Download Excel + CSV Data Pack