

Government AI Readiness Index 2025 Methodology Weights: 14 Dimensions Explained
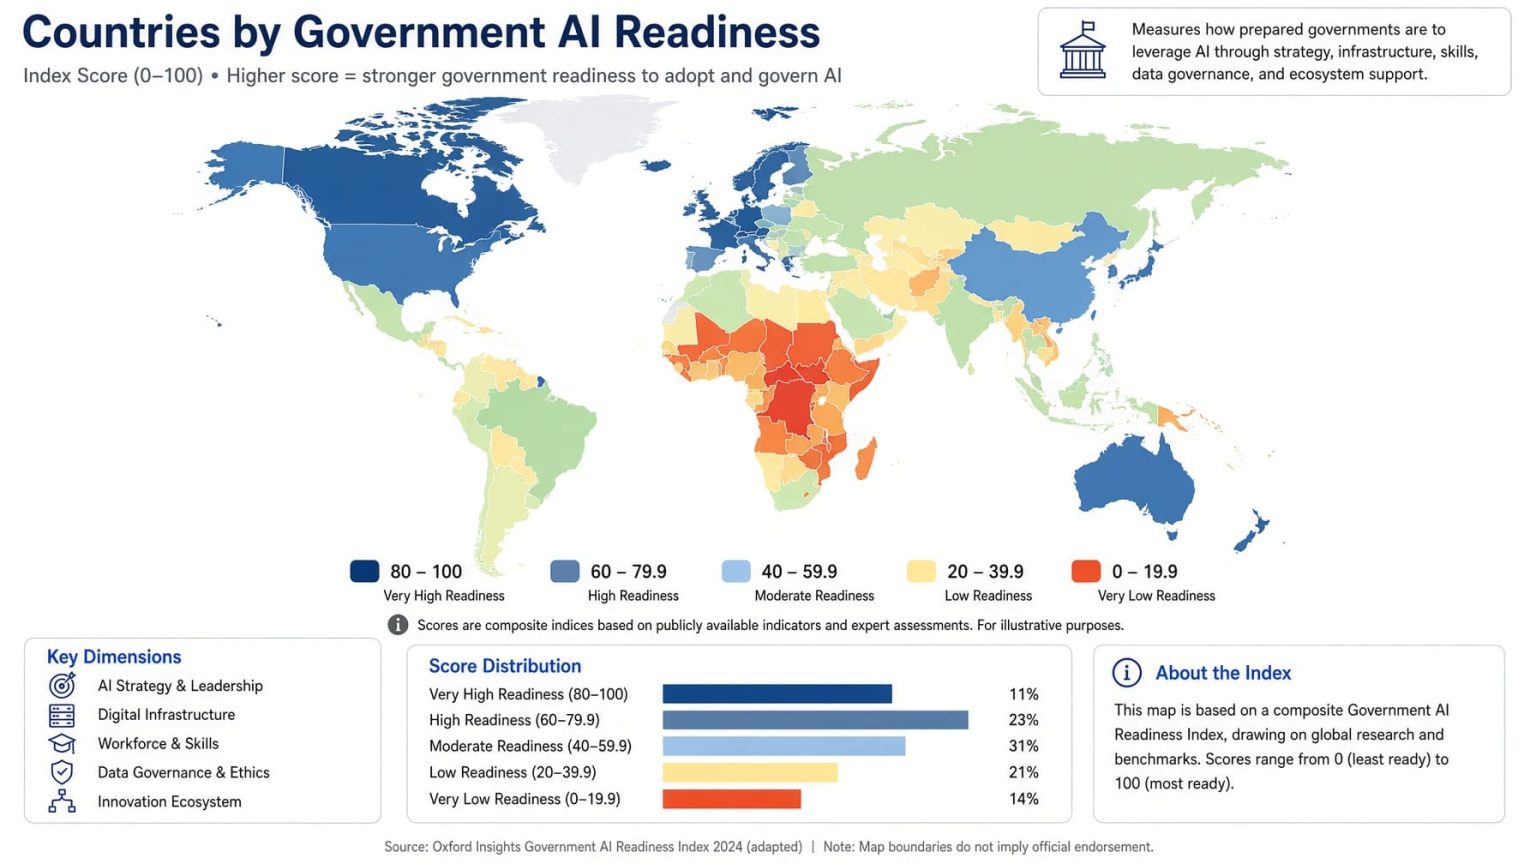
How Oxford Insights Weights the Government AI Readiness Index 2025
Oxford Insights redesigned the Government AI Readiness Index for the 2025 edition around a broader question: to what extent can a government harness artificial intelligence to benefit the public? The framework covers 195 governments and is organized into six pillars and fourteen dimensions.
This StatRanker research page analyzes the official methodology weights behind that framework. The metric is each dimension's published percentage contribution to the overall composite index. Higher weight ranks higher. All 14 dimension weights are direct Oxford Insights values with status official_value.
Scope: methodology weights, not government performance rankings. Source mode: single official publisher. Coverage: 14 of 14 published dimension weights. Unit: percent of the overall index. Direction: higher weight ranks higher. Target: 2025 edition. Methodology report published January 2026. Retrieval date: October 4, 2026.
AI Sector Maturity has the largest published dimension-level weight.
Policy Vision has the smallest published dimension-level weight.
The 7th and 8th values in the 14-row ordered dataset are both 7.50%.
All 14 official weights come from Oxford Insights; no dimension weight is missing.
What a methodology weight means
Oxford Insights describes the 2025 framework as normative. The structure reflects the capabilities the publisher considers important for a government's ability to harness AI for public benefit, while the published weights determine how strongly different parts of that framework contribute to the composite index.
Weight is not the same as performance. A dimension weighted at 10% can contribute more to the overall index than a dimension weighted at 4%, but neither number says whether a particular government performs well or poorly in that area.
The six pillars are Policy Capacity, Governance, AI Infrastructure, Public Sector Adoption, Development and Diffusion, and Resilience. The 2025 edition uses explicit published pillar and dimension weights.
Official pillar weights in the 2025 framework
AI Infrastructure and Development and Diffusion each receive 25% of the total index. Governance and Public Sector Adoption receive 15% each, while Policy Capacity and Resilience receive 10% each.
All six official pillar weights, sorted from highest to lowest
| Rank | Pillar | Weight | Source / method note |
|---|---|---|---|
| 1 | AI Infrastructure | 25% | official_value; Oxford Insights Methodology Report 2025; three dimensions. |
| 1 | Development and Diffusion | 25% | official_value; Oxford Insights Methodology Report 2025; three dimensions. |
| 3 | Governance | 15% | official_value; Oxford Insights Methodology Report 2025; two dimensions. |
| 3 | Public Sector Adoption | 15% | official_value; Oxford Insights Methodology Report 2025; two dimensions. |
| 5 | Policy Capacity | 10% | official_value; Oxford Insights Methodology Report 2025; two dimensions. |
| 5 | Resilience | 10% | official_value; Oxford Insights Methodology Report 2025; two dimensions. |
StatRanker calculation: official pillar weights are sorted descending. Equal values share the same competition rank. The six official pillar weights sum to 100%.
Chart: all 14 dimension weights
The chart uses the same entities and raw values as the main dimension-ranking table. Bar length is proportional to the largest published weight, AI Sector Maturity at 10.00%.
Methodology: from individual indicators to the composite index
Oxford Insights processes individual indicators before applying the published weighting structure. The dimension weights ranked on this page are direct source-published values; StatRanker does not recalculate government readiness scores.
Data sources
The 2025 framework combines reputable secondary datasets, 19 desk-research indicators collected by Oxford Insights, and evidence submitted by governments and cross-checked by the research team.
Distribution checks
Indicators are checked for problematic distributions. Values are flagged where absolute skewness is above 2.0 or kurtosis is above 3.5. When an indicator is both skewed and continuous, a logarithmic transformation is applied; discrete datasets are handled case by case.
Normalisation
Indicators measured in different units are converted to a common 0–100 scale using Min-Max normalisation before aggregation.
Missing continuous data
Eligible missing continuous observations can be replaced after normalisation using the mean of a peer group defined by the intersection of World Bank income and geographic categories.
Binary data and exclusion
Missing binary observations receive zero rather than an imputed fractional mean. A government is excluded from the final ranking when more than 50% of indicators are imputed; data older than three years are treated as out of date for this rule.
Aggregation
Indicator scores within a dimension use a simple arithmetic mean. Dimension and pillar scores are then aggregated with the explicit weights published for the 2025 edition.
Coverage on this page
All 14 official dimension weights are included. No official dimension weight is missing, modeled or replaced with a secondary estimate.
Source hierarchy
Oxford Insights is the sole numeric source for the weighting table. No cross-source averaging is used. If a secondary reproduction conflicts with the official methodology report, the Oxford Insights value takes precedence.
Source-published and StatRanker-calculated values are kept separate. The dimension and pillar weights are official Oxford Insights values. StatRanker calculations are limited to transparent arithmetic from those confirmed inputs: counts, sums, percentages, median, gaps and ratios.
The displayed dimension weights total 99.99% because three AI Infrastructure values are published as 8.33% each. The official parent-pillar weights total exactly 100%. The 0.01-point difference is a display-rounding effect, not a missing component.
The methodology weights do not directly measure AI company revenue, private investment, frontier-model quality, military capability, research output or the quality of every individual public service. They describe the relative contribution of components within the Oxford Insights composite-index framework.
Main ranking: all 14 dimensions by official weight
Use the controls to search dimensions, filter by pillar or status, and change display order. The Top 10 option always refers to the original ranking by published weight, even after the visible rows are sorted alphabetically or from low to high.
All official Oxford Insights dimension weights, 2025 edition
| Rank | Dimension | Weight | Source / method note |
|---|---|---|---|
| 1 | AI Sector Maturity | 10.00% | Development and Diffusion; official_value; Oxford Insights Methodology Report 2025; 2025 edition; report published January 2026. |
| 2 | Compute Capacity | 8.33% | AI Infrastructure; official_value; Oxford Insights Methodology Report 2025; 2025 edition; published weight displayed to two decimals. |
| 2 | Enabling Technical Infrastructure | 8.33% | AI Infrastructure; official_value; Oxford Insights Methodology Report 2025; 2025 edition; published weight displayed to two decimals. |
| 2 | Data Quality | 8.33% | AI Infrastructure; official_value; Oxford Insights Methodology Report 2025; 2025 edition; published weight displayed to two decimals. |
| 5 | Governance Principles | 7.50% | Governance; official_value; Oxford Insights Methodology Report 2025; 2025 edition. |
| 5 | Regulatory Compliance | 7.50% | Governance; official_value; Oxford Insights Methodology Report 2025; 2025 edition. |
| 5 | Government Digital Policy | 7.50% | Public Sector Adoption; official_value; Oxford Insights Methodology Report 2025; 2025 edition. |
| 5 | e-Government Delivery | 7.50% | Public Sector Adoption; official_value; Oxford Insights Methodology Report 2025; 2025 edition. |
| 5 | Human Capital | 7.50% | Development and Diffusion; official_value; Oxford Insights Methodology Report 2025; 2025 edition. |
| 5 | AI Technology Diffusion | 7.50% | Development and Diffusion; official_value; Oxford Insights Methodology Report 2025; 2025 edition. |
| 11 | Policy Commitment | 6.00% | Policy Capacity; official_value; Oxford Insights Methodology Report 2025; 2025 edition. |
| 12 | Societal Transition | 5.00% | Resilience; official_value; Oxford Insights Methodology Report 2025; 2025 edition. |
| 12 | Safety and Security | 5.00% | Resilience; official_value; Oxford Insights Methodology Report 2025; 2025 edition. |
| 14 | Policy Vision | 4.00% | Policy Capacity; official_value; Oxford Insights Methodology Report 2025; 2025 edition. |
Inclusion: 14 of 14 official dimension weights. Missing official weights: none. Numeric-source conflicts: none identified because Oxford Insights is the sole numeric publisher used for this table. Displayed dimension weights total 99.99% because of published rounding; official pillar weights total 100%.
Insights from the 2025 weighting structure
Key Insight
AI Infrastructure and Development and Diffusion each receive 25% of the total pillar weighting. Together they account for 50% of the complete 100% weighting: (25 + 25) / 100 × 100 = 50%.
Notable Pattern
Ten of the 14 dimensions are weighted at 7.50% or more, equal to 71.43% of all dimensions. Their published rounded weights sum to 79.99%: 10 + (3 × 8.33) + (6 × 7.50) = 79.99%.
Regional/Source Concentration
Numeric-source concentration is 100%: all 14 dimension weights come directly from Oxford Insights. No secondary publisher contributes a numeric weight to this analysis.
Outlier
AI Sector Maturity is the only dimension weighted at 10.00%. Policy Vision is lowest at 4.00%, creating a 6.00-percentage-point gap and a highest-to-lowest ratio of 2.5×.
What the weights mean when interpreting the index
A Government AI Readiness score is not a simple count of policies or technical assets. Oxford Insights processes and normalises individual indicators, combines them into dimensions and then applies the published dimension and pillar weighting structure.
Similar headline scores can therefore arise from different combinations of strengths and weaknesses. Detailed interpretation should consider the pillar and dimension results rather than treating the overall score as a single undifferentiated measure.
Historical comparisons require caution because the 2025 edition changes the central research question and introduces a redesigned explicit weighting framework. Differences from older editions can reflect methodology changes as well as changes in the underlying indicators.
This page analyzes the methodology weights only. It does not rank governments, estimate missing government scores, create forecasts or convert 2025 index values into synthetic 2026 results.
FAQ
What is ranked on this page?
The ranking compares all 14 official methodology dimensions by their published percentage weight in the Oxford Insights Government AI Readiness Index 2025. It does not rank governments.
Which dimension has the highest weight?
AI Sector Maturity has the highest published dimension weight at 10.00% of the overall index.
Which pillars have the highest weights?
AI Infrastructure and Development and Diffusion each receive 25%, together accounting for 50% of the total pillar weighting.
What is the median dimension weight?
The median is 7.50%. With 14 observations, the median is the average of the 7th and 8th ordered weights, and both are 7.50%.
How are indicators normalised?
Oxford Insights uses Min-Max normalisation to convert indicators measured in different units to a common 0–100 scale before aggregation.
How are missing values handled?
Eligible missing continuous observations can use peer-group mean imputation after normalisation, while missing binary observations receive zero. Governments with more than 50% imputed indicators are excluded from the final ranking.
Why do the displayed dimension weights total 99.99%?
The difference is caused by published rounding. Three AI Infrastructure dimensions are shown as 8.33% each, totaling 24.99%, while their parent pillar is officially weighted at 25%.
Are these 2026 weights?
No. These are official weights for the 2025 edition. The methodology report containing them was published in January 2026.
Sources
Oxford Insights — Methodology Report 2025
Role: numeric_source and methodology_source. Primary source for all pillar and dimension weights, distribution treatment, normalisation, missing-data rules, aggregation and explicit weighting.
https://oxfordinsights.com/wp-content/uploads/2026/01/Methodology-Report-2025-1.pdf
Oxford Insights — Government AI Readiness Index 2025
Role: validation_source and context_source. Used to confirm the edition, coverage of 195 governments, the revised research question and the overall index context.
https://oxfordinsights.com/ai-readiness/government-ai-readiness-index-2025/
Oxford Insights — Evidence Submission
Role: context_source for the index update process and current evidence collection; not used as a numeric source for weights.
https://oxfordinsights.com/ai-readiness/evidence-submission/
