

Global Gender Gap Index 2026: Top 100 Countries and Economies
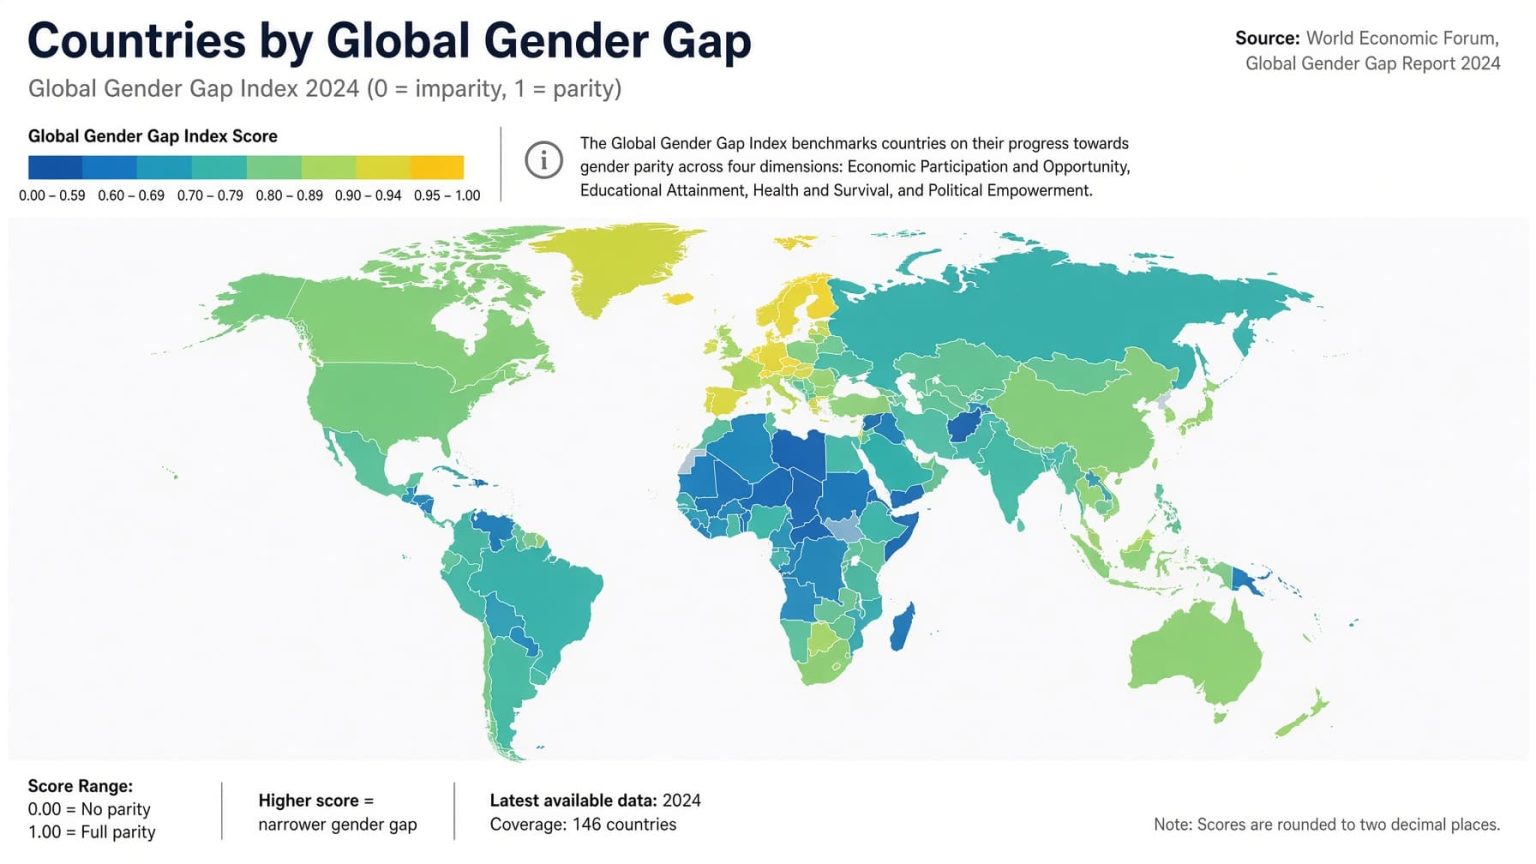
Who leads the Global Gender Gap Index in 2026?
Iceland ranks first in the 2026 Global Gender Gap Index with a score of 93.0%. Finland is second at 87.2%, Norway third at 85.7%, Namibia fourth at 84.5% and the United Kingdom fifth at 84.2%.
The World Economic Forum published the 20th edition of the Global Gender Gap Report on September 16, 2026. The index compares gender parity across Economic Participation and Opportunity, Educational Attainment, Health and Survival, and Political Empowerment.
This is not a gender pay-gap ranking. Wage equality and earned income contribute to the economic subindex, but the overall index also measures participation, education, health and political representation. For the separate wage metric, see StatRanker's gender pay gap analysis.
Source: World Economic Forum, Global Gender Gap Report 2026. Data checked October 4, 2026. Scores below use the WEF's published 0-to-1 index values, displayed as percentages for readability.
Iceland ranks first in the 2026 WEF index.
Lesotho ranks 100th; South Korea is 101st at the same displayed 69.3% after rounding.
The 2026 WEF edition benchmarks 145 economies.
WEF's overall 2026 global gender parity score.
Global Gender Gap Index 2026: full Top 100 ranking
Search, filter or sort the 100 WEF-ranked economies. Scores are shown as percentages; the published WEF rank order is preserved.
Top 100 economies · World Economic Forum · Global Gender Gap Index 2026 · published September 16, 2026
| Rank | Economy | Parity score | Score change | Rank change |
|---|---|---|---|---|
| 1 | Iceland | 93.0% | +0.5 pp | 0 |
| 2 | Finland | 87.2% | -0.6 pp | 0 |
| 3 | Norway | 85.7% | -0.6 pp | 0 |
| 4 | Namibia | 84.5% | +3.4 pp | +4 |
| 5 | United Kingdom | 84.2% | +0.4 pp | -1 |
| 6 | New Zealand | 82.8% | +0.1 pp | -1 |
| 7 | Sweden | 82.3% | +0.6 pp | -1 |
| 8 | Australia | 81.9% | +2.7 pp | +5 |
| 9 | Germany | 81.7% | +1.3 pp | 0 |
| 10 | Ireland | 81.4% | +1.3 pp | 0 |
| 11 | Denmark | 81.0% | +1.9 pp | +3 |
| 12 | Spain | 79.6% | -0.1 pp | 0 |
| 13 | Barbados | 79.4% | +0.8 pp | +2 |
| 14 | Lithuania | 79.1% | +0.8 pp | +5 |
| 15 | Republic of Moldova | 79.1% | -2.3 pp | -8 |
| 16 | Ecuador | 79.0% | +1.6 pp | +9 |
| 17 | Latvia | 78.8% | +1.0 pp | +4 |
| 18 | Mexico | 78.7% | +1.1 pp | +5 |
| 19 | Estonia | 78.2% | -1.7 pp | -8 |
| 20 | Philippines | 78.0% | -0.1 pp | 0 |
| 21 | Costa Rica | 77.9% | -0.7 pp | -5 |
| 22 | France | 77.9% | +1.4 pp | +13 |
| 23 | Slovenia | 77.8% | +0.8 pp | +6 |
| 24 | Canada | 77.7% | +1.0 pp | +8 |
| 25 | Albania | 77.5% | +1.2 pp | +11 |
| 26 | Burundi | 77.1% | +1.6 pp | +18 |
| 27 | Switzerland | 77.1% | -1.4 pp | -10 |
| 28 | Rwanda | 76.9% | +0.8 pp | +11 |
| 29 | Chile | 76.9% | -0.8 pp | -7 |
| 30 | South Africa | 76.6% | -0.1 pp | +3 |
| 31 | Singapore | 76.4% | +1.5 pp | +16 |
| 32 | Portugal | 76.3% | -0.3 pp | +2 |
| 33 | Belgium | 76.2% | -1.1 pp | -6 |
| 34 | Colombia | 76.1% | +0.3 pp | +7 |
| 35 | Guyana | 75.9% | -1.0 pp | -4 |
| 36 | Bolivia (Plurinational State of) | 75.8% | +1.0 pp | +12 |
| 37 | Jamaica | 75.7% | -0.5 pp | +1 |
| 38 | Trinidad and Tobago | 75.7% | -1.5 pp | -10 |
| 39 | Serbia | 75.4% | -2.0 pp | -13 |
| 40 | Austria | 75.3% | +1.8 pp | +16 |
| 41 | Panama | 75.3% | +1.1 pp | +10 |
| 42 | Luxembourg | 75.2% | +0.7 pp | +8 |
| 43 | Liberia | 75.1% | -0.9 pp | -3 |
| 44 | Poland | 75.1% | +0.1 pp | +1 |
| 45 | Argentina | 75.1% | -1.1 pp | -8 |
| 46 | Netherlands | 75.0% | -0.7 pp | -3 |
| 47 | United States of America | 74.9% | -0.8 pp | -5 |
| 48 | Croatia | 74.4% | +1.5 pp | +16 |
| 49 | Zimbabwe | 74.3% | -0.4 pp | 0 |
| 50 | Guatemala | 74.0% | +3.4 pp | +31 |
| 51 | Honduras | 74.0% | +1.3 pp | +16 |
| 52 | Belarus | 74.0% | +0.3 pp | +2 |
| 53 | Uruguay | 74.0% | +2.0 pp | +18 |
| 54 | United Republic of Tanzania | 73.6% | -0.1 pp | +1 |
| 55 | Thailand | 73.5% | +0.8 pp | +11 |
| 56 | Ghana | 73.2% | +2.9 pp | +32 |
| 57 | Suriname | 73.2% | -0.6 pp | -5 |
| 58 | Armenia | 73.1% | 0.0 pp | +1 |
| 59 | Mozambique | 72.8% | -1.0 pp | -6 |
| 60 | Georgia | 72.7% | -0.3 pp | +3 |
| 61 | El Salvador | 72.4% | +1.6 pp | +17 |
| 62 | Bosnia and Herzegovina | 72.3% | +0.5 pp | +11 |
| 63 | Botswana | 72.2% | -0.9 pp | -3 |
| 64 | Slovakia | 72.1% | -0.2 pp | +6 |
| 65 | Kenya | 72.1% | +3.2 pp | +33 |
| 66 | Ukraine | 72.1% | -0.9 pp | -4 |
| 67 | Dominican Republic | 72.1% | -0.9 pp | -6 |
| 68 | Gabon | 72.1% | +2.2 pp | +23 |
| 69 | Cape Verde | 72.1% | -4.9 pp | -39 |
| 70 | Mongolia | 71.9% | -0.9 pp | -5 |
| 71 | Israel | 71.7% | +0.8 pp | +5 |
| 72 | Brazil | 71.5% | -0.4 pp | 0 |
| 73 | Malta | 71.5% | -1.1 pp | 0 |
| 74 | Montenegro | 71.5% | +1.0 pp | +10 |
| 75 | Greece | 71.4% | +0.6 pp | +2 |
| 76 | Eswatini | 71.4% | -3.4 pp | -30 |
| 77 | Czechia | 71.2% | +2.7 pp | +25 |
| 78 | Cyprus | 71.2% | +0.6 pp | +4 |
| 79 | Bangladesh | 71.2% | -6.2 pp | -55 |
| 80 | Bulgaria | 71.0% | +0.4 pp | +3 |
| 81 | Madagascar | 70.9% | -2.5 pp | -23 |
| 82 | North Macedonia | 70.9% | +1.0 pp | +8 |
| 83 | Italy | 70.8% | +0.4 pp | +2 |
| 84 | Viet Nam | 70.7% | -0.6 pp | -10 |
| 85 | Hungary | 70.7% | +2.3 pp | +20 |
| 86 | Paraguay | 70.6% | +0.3 pp | +1 |
| 87 | Angola | 70.5% | +3.7 pp | +30 |
| 88 | Kyrgyzstan | 70.4% | +0.7 pp | +7 |
| 89 | Lao PDR | 70.3% | +1.1 pp | +7 |
| 90 | Cameroon | 70.3% | +0.5 pp | +3 |
| 91 | United Arab Emirates | 70.2% | -2.2 pp | -22 |
| 92 | Belize | 70.1% | 0.0 pp | -3 |
| 93 | Timor-Leste | 70.1% | -0.3 pp | -7 |
| 94 | Peru | 70.0% | -3.4 pp | -37 |
| 95 | Kazakhstan | 70.0% | +0.2 pp | -3 |
| 96 | China | 69.9% | +1.3 pp | +7 |
| 97 | Romania | 69.8% | +0.1 pp | -3 |
| 98 | Azerbaijan | 69.7% | +0.9 pp | +2 |
| 99 | Malawi | 69.5% | n/a | n/a |
| 100 | Lesotho | 69.3% | +0.5 pp | -1 |
Malawi re-entered the 2026 index, so year-over-year score and rank changes are shown as n/a. WEF reports that Qatar also re-entered the index, but Qatar ranks outside this Top 100 table.
StatRanker analysis of the 2026 Top 100
The calculations below use the 100 WEF scores and year-over-year rank movements shown in this ranking. They are StatRanker summaries of the published dataset, not additional WEF indicators.
Median Top 100 score
74.0%. Half of the economies in this Top 100 score at or above 74.0%, and half score at or below it.
Average Top 100 score
74.9% using the published index values shown in the table.
Rank movement
55 economies moved up, 34 moved down, 10 were unchanged and Malawi re-entered the index.
Spread from #1 to #100
23.7 percentage points separate Iceland at 93.0% from Lesotho at 69.3%. Forty-six Top 100 economies score at least 75.0%.
What changed in the 2026 ranking
Australia enters the Top 10
Australia rises five places to 8th with a score of 81.9%, its first Top 10 appearance in the index.
Namibia rises to 4th
Namibia moves up four positions to 4th and reaches 84.5%, the highest score among Sub-Saharan African economies.
Seven European economies are in the Top 10
Iceland, Finland, Norway, the United Kingdom, Sweden, Germany and Ireland occupy seven of the first ten positions.
Largest movements
Kenya (+33), Ghana (+32), Guatemala (+31), Angola (+30) and Czechia (+25) record the largest gains among Top 100 economies. Bangladesh falls 55 places.
Chart: top 20 Global Gender Gap scores in 2026
Bar length represents each economy's overall 2026 parity score on the 0–100% scale. The chart is not rebased to the top performer, so the visual distance reflects the published index level.
Methodology
Metric
The overall Global Gender Gap Index measures gaps between women and men. Higher scores indicate smaller measured gender gaps.
Scale
WEF reports scores from 0 to 1. StatRanker displays them as percentages by multiplying the published score by 100; the rank order is unchanged.
Four dimensions
Economic Participation and Opportunity, Educational Attainment, Health and Survival, and Political Empowerment.
Coverage and inclusion
The 2026 edition benchmarks 145 economies. WEF requires sufficiently recent data for at least 12 of the 14 indicators used in the index.
The index compares gender gaps within an economy, not absolute income, living standards or service quality. A lower-income economy can therefore rank above a richer economy if its measured gender gaps are smaller.
Scores displayed to one decimal place can tie even when WEF's underlying calculations produce different ranks. Lesotho is 100th and South Korea 101st although both display 69.3% after rounding.
Underlying indicators can use different reference years because source datasets are updated on different schedules. “2026” identifies the report edition, not the collection year of every input.
How to interpret the ranking
Rank and score should be read together. An economy can improve its score but fall in rank if other economies improve faster.
The index measures parity, not prosperity. It should not be read as a ranking of income levels, healthcare quality, education quality or overall living standards.
Economic parity is broader than wages alone. Labour-force participation, earned income and occupational representation all matter. For a separate country ranking focused on participation, see Top 100 Countries by Female Labor Force Participation Rate. For wage differences specifically, see countries with the lowest gender pay gap in Europe.
Country rankings and FAQ
Where does the United States rank in the Global Gender Gap Index 2026?
The United States ranks 47th with a parity score of 74.9%.
Where does Ukraine rank in 2026?
Ukraine ranks 66th with a parity score of 72.1%.
Where does China rank in 2026?
China ranks 96th with a parity score of 69.9%.
Why is India not in this Top 100 table?
India ranks 131st out of 145 economies with a score of 64.5%, so it falls outside the Top 100.
Is the Global Gender Gap Index the same as the gender pay gap?
No. Pay and earned income are only part of the Economic Participation and Opportunity dimension. The overall index also includes education, health and political empowerment.
Sources
World Economic Forum — Global Gender Gap Report 2026
Primary publication page; report edition, publication date and official access point.
https://www.weforum.org/publications/global-gender-gap-report-2026/
World Economic Forum — Benchmarking gender gaps, 2026
Primary analytical source for the 2026 global score, top performers, subindex results, regional findings and year-over-year movements.
World Economic Forum — Global Gender Gap Report 2026 PDF
Official report PDF and source document for the published Global Gender Gap Index tables and economy profiles.
World Economic Forum — User's Guide
Methodological reference for economy profiles, score interpretation and data-availability requirements.
