

U.S. States by Personal Bankruptcy Filing Rate, 2025
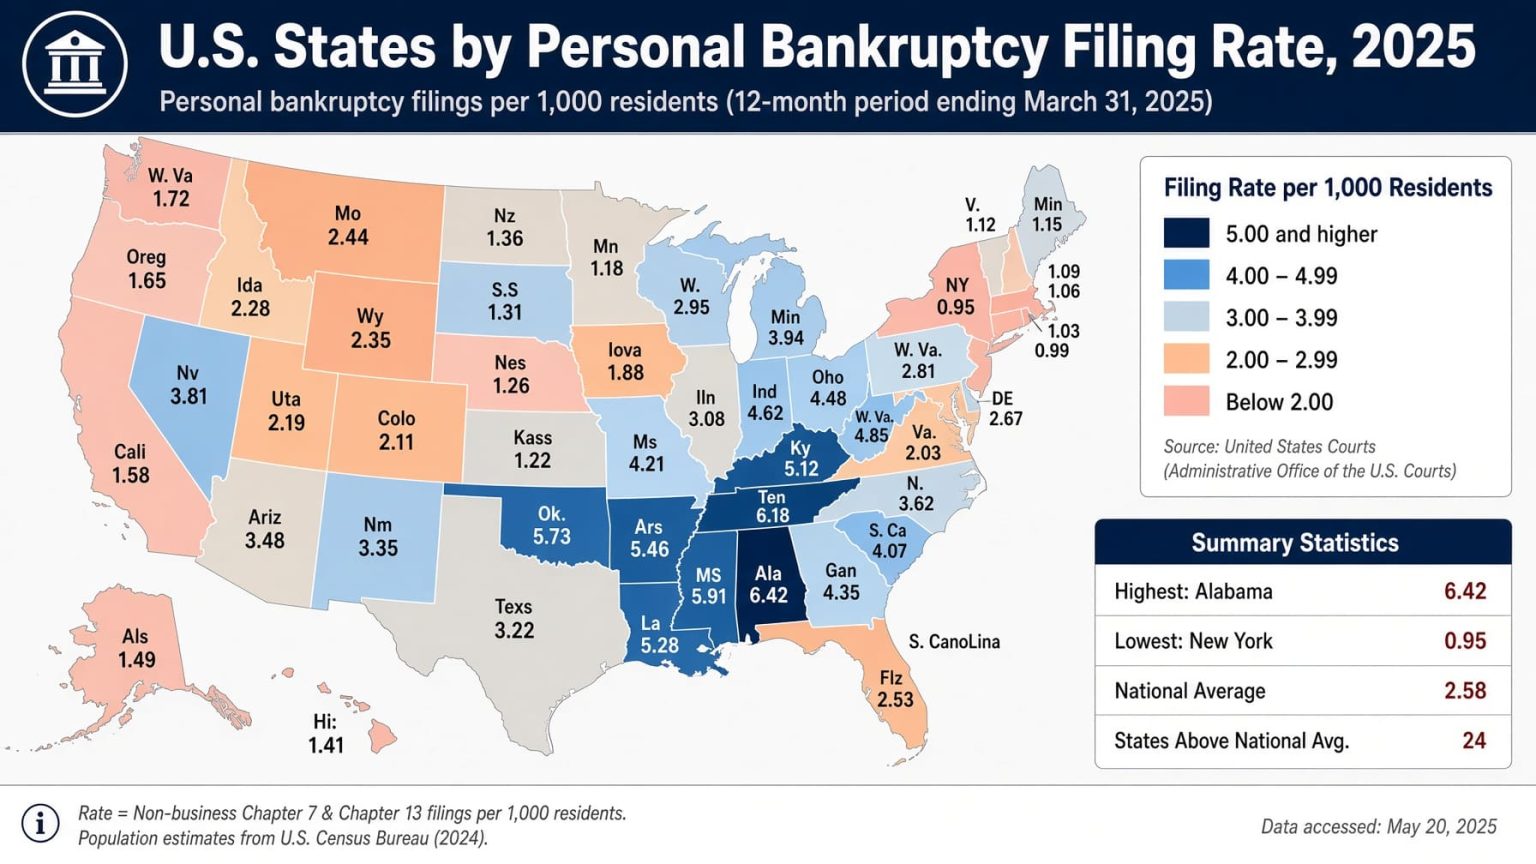
Personal Bankruptcy Filing Rates Across the 50 States
Alabama had the highest 2025 personal bankruptcy filing rate among the 50 states, at 392.7 nonbusiness bankruptcy cases per 100,000 residents. Mississippi ranked second at 323.7, followed by Tennessee at 279.8. Alaska had the lowest rate at 28.9.
The ranking uses the Administrative Office of the U.S. Courts category nonbusiness cases as the closest consistent federal measure of personal bankruptcy filings. Each state rate is calculated against the U.S. Census Bureau Vintage 2025 resident population estimate for July 1, 2025.
The table is a compiled research dataset based on 2 primary official sources, with row-level source and method notes shown in the ranking table. All 50 rates are calculated from observed 2025 filings and population data. No forecasts or modeled projections are used.
U.S. Courts reported 549,577 nonbusiness bankruptcy filings nationwide in the 12 months ending December 31, 2025, up 11.2% from 494,201 one year earlier. The state ranking below covers 543,096 cases assigned to the 50 states; the District of Columbia and U.S. territories are outside the ranking.
Alabama nonbusiness bankruptcy cases per 100,000 residents.
Alaska; Alabama's rate is about 13.6 times higher.
Calculated from the 50 state rates, between Colorado and Kansas.
543,096 nonbusiness cases assigned to the states in this ranking.
Calendar-year 2025 cases divided by Census Vintage 2025 population.
50 calculated values from official observed inputs; 0 forecasts; 0 projections.
What the personal bankruptcy filing rate measures
Bankruptcy filings by state can be compared using either raw case totals or population-adjusted rates. Raw totals are strongly influenced by state size. California, Florida and Texas can record many cases without necessarily having the highest filing intensity. A per-capita rate provides a more useful comparison between states with very different populations.
The numerator comes from U.S. Courts Table F-5A for the 12 months ending December 31, 2025. The table separates business and nonbusiness cases and reports filings by county. County codes are used to assign cases to states before the population rate is calculated.
The term nonbusiness is important. U.S. Courts defines nonbusiness debt as including consumer debt and other debt that a debtor indicates is neither consumer nor business debt. For that reason, this article uses “personal bankruptcy” as a reader-friendly description while retaining the official nonbusiness classification throughout the methodology.
The statistic counts bankruptcy cases rather than unique people. A joint petition filed by spouses is one case. The rate also does not show how much debt was involved, whether the case resulted in a discharge, or whether a Chapter 13 repayment plan was completed.
Top 10 States by Personal Bankruptcy Filing Rate in 2025
Alabama stands well above the rest of the ranking. Its rate of 392.7 cases per 100,000 residents is about 21.3% higher than Mississippi's 323.7. Tennessee, Nevada and Georgia form a much tighter group, with rates between 275 and 280.
Top 10 states — nonbusiness bankruptcy cases per 100,000 residents
| Rank | State | Rate | Source / method note |
|---|---|---|---|
| 1 | Alabama | 392.7 | Calculated from AOUSC F-5A: 20,395 cases; Census population: 5,193,088. |
| 2 | Mississippi | 323.7 | Calculated from AOUSC F-5A: 9,562 cases; Census population: 2,954,160. |
| 3 | Tennessee | 279.8 | Calculated from AOUSC F-5A: 20,464 cases; Census population: 7,315,076. |
| 4 | Nevada | 275.5 | Calculated from AOUSC F-5A: 9,042 cases; Census population: 3,282,188. |
| 5 | Georgia | 275.2 | Calculated from AOUSC F-5A: 31,110 cases; Census population: 11,302,748. |
| 6 | Kentucky | 261.1 | Calculated from AOUSC F-5A: 12,030 cases; Census population: 4,606,864. |
| 7 | Indiana | 257.6 | Calculated from AOUSC F-5A: 17,961 cases; Census population: 6,973,333. |
| 8 | Utah | 219.2 | Calculated from AOUSC F-5A: 7,757 cases; Census population: 3,538,904. |
| 9 | Ohio | 217.0 | Calculated from AOUSC F-5A: 25,824 cases; Census population: 11,900,510. |
| 10 | Michigan | 216.9 | Calculated from AOUSC F-5A: 21,969 cases; Census population: 10,127,884. |
Rate = nonbusiness bankruptcy cases ÷ 2025 resident population × 100,000. Ranking uses unrounded values; displayed rates are rounded to one decimal.
Top 20 States by Bankruptcy Filing Rate
Alabama is clearly separated from the rest of the Top 20. Mississippi also stands above the next group, while Tennessee, Nevada and Georgia have nearly identical filing rates.
Methodology
This ranking combines two official statistical datasets: Administrative Office of the U.S. Courts bankruptcy filings and U.S. Census Bureau Vintage 2025 state population estimates. The filing rate itself is a calculated_value: it is derived directly from official observed values using the disclosed formula below and is neither a forecast nor a modeled projection.
Metric
Nonbusiness bankruptcy cases filed during the 12 months ending December 31, 2025, per 100,000 residents.
Formula
Rate = nonbusiness cases ÷ July 1, 2025 resident population × 100,000.
Ranking direction
Descending. A higher filing rate receives a higher rank. A high rank does not represent a better outcome.
Coverage
All 50 U.S. states. The District of Columbia and U.S. territories are excluded from the state ranking.
Bankruptcy numerator
The numerator comes from U.S. Courts Table F-5A, “Business and Nonbusiness Bankruptcy Cases Commenced, by County and Chapter of the Bankruptcy Code,” for the 12 months ending December 31, 2025. The ranking uses the Nonbusiness — All Chapters total.
F-5A reports county identifiers using five-digit county codes. The state portion of the county code is used to aggregate county-level filings into state totals. This avoids treating the bankruptcy court district itself as the state assignment when a county is identified outside the corresponding district.
Population denominator
The denominator is the Census Bureau Vintage 2025 resident population estimate as of July 1, 2025. The same population vintage and reference date are used for every state.
Source hierarchy and conflicts
Administrative Office of the U.S. Courts data control all bankruptcy counts. U.S. Census Bureau data control all population values. The two sources serve different parts of the calculation and are not averaged with third-party datasets.
Missing values and exclusions
All 50 states have usable filing and population values, so no state is omitted for missing data. Washington, D.C., Puerto Rico and other U.S. territories are outside the coverage because the metric is defined as a ranking of U.S. states.
Assumptions
- A bankruptcy case is the counting unit, not a unique individual debtor.
- The official nonbusiness classification is used as the consistent federal proxy for personal bankruptcy filings.
- The July 1, 2025 population estimate is used as the denominator for the full 2025 filing period.
- One F-5A nonbusiness filing without a county code appears under the Middle District of Florida and is assigned to Florida.
- No adjustment is made for age, income, household size, debt balances, local exemption rules or bankruptcy eligibility.
Data status
Every state row is classified as calculated_value. The bankruptcy case counts and population inputs are official observed 2025 values, while the per-capita rate is calculated directly from those inputs. There are no official forecasts and no modeled projections in the ranking.
Rounding
Rates are calculated from the full case and population counts. Ranking is performed before rounding, and displayed rates are rounded to one decimal place.
What this metric does not measure
The filing rate does not measure total household debt, delinquency, credit scores, financial wellbeing, Chapter 7 or Chapter 13 eligibility, debt discharged, repayment-plan completion or the economic cause of a filing. Differences among states should not be interpreted as evidence that any single policy or economic factor caused the observed ranking.
All 50 States Ranked by Personal Bankruptcy Filing Rate
Search for a state, filter by Census region or data status, change the sort order or limit the table to the Top 10 or Top 20.
2025 nonbusiness bankruptcy cases per 100,000 residents
| Rank | State | Rate | Source / method note |
|---|---|---|---|
| 1 | Alabama | 392.7 | AOUSC: 20,395 cases; Census: 5,193,088 residents; calculated_value. |
| 2 | Mississippi | 323.7 | AOUSC: 9,562 cases; Census: 2,954,160 residents; calculated_value. |
| 3 | Tennessee | 279.8 | AOUSC: 20,464 cases; Census: 7,315,076 residents; calculated_value. |
| 4 | Nevada | 275.5 | AOUSC: 9,042 cases; Census: 3,282,188 residents; calculated_value. |
| 5 | Georgia | 275.2 | AOUSC: 31,110 cases; Census: 11,302,748 residents; calculated_value. |
| 6 | Kentucky | 261.1 | AOUSC: 12,030 cases; Census: 4,606,864 residents; calculated_value. |
| 7 | Indiana | 257.6 | AOUSC: 17,961 cases; Census: 6,973,333 residents; calculated_value. |
| 8 | Utah | 219.2 | AOUSC: 7,757 cases; Census: 3,538,904 residents; calculated_value. |
| 9 | Ohio | 217.0 | AOUSC: 25,824 cases; Census: 11,900,510 residents; calculated_value. |
| 10 | Michigan | 216.9 | AOUSC: 21,969 cases; Census: 10,127,884 residents; calculated_value. |
| 11 | Arkansas | 216.4 | AOUSC: 6,741 cases; Census: 3,114,791 residents; calculated_value. |
| 12 | Louisiana | 212.8 | AOUSC: 9,827 cases; Census: 4,618,189 residents; calculated_value. |
| 13 | Illinois | 201.0 | AOUSC: 25,567 cases; Census: 12,719,141 residents; calculated_value. |
| 14 | Maryland | 193.5 | AOUSC: 12,122 cases; Census: 6,265,347 residents; calculated_value. |
| 15 | Oregon | 186.4 | AOUSC: 7,964 cases; Census: 4,273,586 residents; calculated_value. |
| 16 | Florida | 180.3 | AOUSC: 42,312 cases; Census: 23,462,518 residents; one unallocated F-5A row assigned from the Middle District of Florida. |
| 17 | Virginia | 177.3 | AOUSC: 15,742 cases; Census: 8,880,107 residents; calculated_value. |
| 18 | Oklahoma | 172.8 | AOUSC: 7,127 cases; Census: 4,123,288 residents; calculated_value. |
| 19 | Minnesota | 170.8 | AOUSC: 9,961 cases; Census: 5,830,405 residents; calculated_value. |
| 20 | Wisconsin | 166.7 | AOUSC: 9,954 cases; Census: 5,972,787 residents; calculated_value. |
| 21 | Missouri | 165.6 | AOUSC: 10,385 cases; Census: 6,270,541 residents; calculated_value. |
| 22 | Arizona | 163.7 | AOUSC: 12,479 cases; Census: 7,623,818 residents; calculated_value. |
| 23 | Delaware | 143.0 | AOUSC: 1,516 cases; Census: 1,059,952 residents; calculated_value. |
| 24 | New Jersey | 140.1 | AOUSC: 13,374 cases; Census: 9,548,215 residents; calculated_value. |
| 25 | Colorado | 135.6 | AOUSC: 8,152 cases; Census: 6,012,561 residents; calculated_value. |
| 26 | Kansas | 135.4 | AOUSC: 4,032 cases; Census: 2,977,220 residents; calculated_value. |
| 27 | Nebraska | 134.9 | AOUSC: 2,722 cases; Census: 2,018,006 residents; calculated_value. |
| 28 | California | 130.5 | AOUSC: 51,345 cases; Census: 39,355,309 residents; calculated_value. |
| 29 | Idaho | 117.2 | AOUSC: 2,379 cases; Census: 2,029,733 residents; calculated_value. |
| 30 | Washington | 112.4 | AOUSC: 8,995 cases; Census: 8,001,020 residents; calculated_value. |
| 31 | Iowa | 109.6 | AOUSC: 3,549 cases; Census: 3,238,387 residents; calculated_value. |
| 32 | Texas | 106.9 | AOUSC: 33,884 cases; Census: 31,709,821 residents; calculated_value. |
| 33 | New York | 105.3 | AOUSC: 21,062 cases; Census: 20,002,427 residents; calculated_value. |
| 34 | Pennsylvania | 102.5 | AOUSC: 13,381 cases; Census: 13,059,432 residents; calculated_value. |
| 35 | Connecticut | 96.6 | AOUSC: 3,564 cases; Census: 3,688,496 residents; calculated_value. |
| 36 | South Carolina | 92.1 | AOUSC: 5,133 cases; Census: 5,570,274 residents; calculated_value. |
| 37 | Rhode Island | 91.8 | AOUSC: 1,023 cases; Census: 1,114,521 residents; calculated_value. |
| 38 | Wyoming | 90.9 | AOUSC: 535 cases; Census: 588,753 residents; calculated_value. |
| 39 | North Carolina | 83.7 | AOUSC: 9,376 cases; Census: 11,197,968 residents; calculated_value. |
| 40 | West Virginia | 80.3 | AOUSC: 1,419 cases; Census: 1,766,147 residents; calculated_value. |
| 41 | Hawaii | 79.1 | AOUSC: 1,133 cases; Census: 1,432,820 residents; calculated_value. |
| 42 | New Mexico | 74.7 | AOUSC: 1,587 cases; Census: 2,125,498 residents; calculated_value. |
| 43 | North Dakota | 74.1 | AOUSC: 592 cases; Census: 799,358 residents; calculated_value. |
| 44 | South Dakota | 69.5 | AOUSC: 650 cases; Census: 935,094 residents; calculated_value. |
| 45 | Montana | 68.4 | AOUSC: 783 cases; Census: 1,144,694 residents; calculated_value. |
| 46 | Massachusetts | 66.7 | AOUSC: 4,770 cases; Census: 7,154,084 residents; calculated_value. |
| 47 | New Hampshire | 59.5 | AOUSC: 842 cases; Census: 1,415,342 residents; calculated_value. |
| 48 | Vermont | 39.1 | AOUSC: 252 cases; Census: 644,663 residents; calculated_value. |
| 49 | Maine | 38.0 | AOUSC: 538 cases; Census: 1,414,874 residents; calculated_value. |
| 50 | Alaska | 28.9 | AOUSC: 213 cases; Census: 737,270 residents; calculated_value. |
Compiled from Administrative Office of the U.S. Courts Table F-5A and U.S. Census Bureau Vintage 2025 population estimates. Each displayed rate has status calculated_value because it is calculated directly from official observed inputs.
What Stands Out in the 2025 Ranking
Key Insight
Alabama leads at 392.7 cases per 100,000, about 21.3% above Mississippi. The difference between first and second place is much larger than the gaps separating most states immediately below them.
Notable Pattern
The 50-state median is 135.5 cases per 100,000. Twenty-five states are above the median and twenty-five are below it, with Colorado and Kansas on either side of the midpoint.
Regional Concentration
Eleven of the Top 20 states are in the South, six are in the Midwest and three are in the West. The highest-ranked Northeast state is New Jersey at No. 24.
Outlier
Alaska's 28.9 rate is about one-thirteenth of Alabama's. Maine and Vermont are also below 40 cases per 100,000, creating a clear low-rate tail at the bottom of the ranking.
How to Read the Bankruptcy Filing Rate
Use this ranking to compare bankruptcy filing intensity across states. A rate of 300 per 100,000 means roughly three nonbusiness bankruptcy cases were filed for every 1,000 residents during 2025. It does not mean that 0.3% of individual residents necessarily filed because the unit is a bankruptcy case and some petitions are filed jointly.
The distinction between nonbusiness and total bankruptcy filings also matters. Total filings include business cases. This ranking removes that category and focuses on the federal nonbusiness classification before adjusting the resulting state totals for population.
A high filing rate is not, by itself, proof that households in a state have more debt or weaker finances. Bankruptcy is a legal process affected by federal rules, state exemption laws, household circumstances, filing costs and chapter choice. The ranking measures filings, not their causes.
For people considering Chapter 7, Chapter 13, debt consolidation, debt settlement or another debt-relief option, the state rate provides context about how frequently bankruptcy cases are filed. It does not determine whether bankruptcy is appropriate or which chapter a particular debtor may qualify for.
Download the U.S. States by Personal Bankruptcy Filing Rate, 2025 dataset
U.S. States by Personal Bankruptcy Filing Rate, 2025
50 ranked entries · Excel + CSV + methodology + sources + chart · Snapshot: 2025 nonbusiness bankruptcy filings + 2025 Census population · Version 1.0
The archive includes machine-readable data, methodology and source documentation. Quick human verification is required before the ZIP is delivered. Full Data Pack downloads require a free account. Free accounts can download 1 different Data Pack every 30 days; re-downloading the same pack does not use another slot. Annual Data Access provides unlimited manual downloads while annual access is active.
Download Excel + CSV Data PackFAQ
Which state had the highest personal bankruptcy filing rate in 2025?
Alabama ranked first at 392.7 nonbusiness bankruptcy cases per 100,000 residents. The calculation uses 20,395 cases and a 2025 Census population estimate of 5,193,088.
Which state had the lowest bankruptcy filing rate?
Alaska ranked last among the 50 states at 28.9 cases per 100,000 residents. Maine was next at 38.0 and Vermont at 39.1.
What does “personal bankruptcy” mean in this ranking?
The underlying U.S. Courts category is “nonbusiness.” It includes consumer debt and other debt reported as neither consumer nor business debt. The article therefore retains the official nonbusiness terminology when describing the underlying data.
Are Chapter 7 and Chapter 13 cases included?
Yes. The numerator uses the F-5A “Nonbusiness — All Chapters” total, which includes nonbusiness cases filed under the bankruptcy chapters reported in the federal table.
Why can this ranking differ from rankings based on total bankruptcy filings?
Total bankruptcy filings include business cases. This ranking excludes the business category and then adjusts nonbusiness cases for each state's population.
Does the rate show the percentage of residents who filed bankruptcy?
No. The numerator counts bankruptcy cases rather than unique individuals. Joint petitions are one reason a case rate should not be interpreted as the exact percentage of residents who filed.
Are the 2025 state rates official published rates?
No. The underlying bankruptcy counts and population values are official observed data. The rates are classified as calculated_value because they are calculated from those official inputs using the disclosed per-capita formula.
Sources
Two primary official datasets determine the ranking. Additional U.S. Courts material is used only for national context and bankruptcy terminology.
Administrative Office of the U.S. Courts — Table F-5A
Primary source for 2025 nonbusiness bankruptcy counts by county and chapter.
https://www.uscourts.gov/data-news/data-tables/2025/12/31/bankruptcy-filings/f-5a
https://www.uscourts.gov/sites/default/files/document/bf_f5a_1231.2025.xlsx
U.S. Census Bureau — Vintage 2025 State Population Estimates
Primary population denominator for the state rates, using resident population estimates for July 1, 2025.
https://www.census.gov/data/tables/time-series/demo/popest/2020s-state-total.html
https://www2.census.gov/programs-surveys/popest/tables/2020-2025/state/totals/NST-EST2025-POP.xlsx
U.S. Courts — Bankruptcy Filings Rise 11 Percent
National context confirming 549,577 nonbusiness filings in the year ending December 31, 2025 and the year-over-year increase.
https://www.uscourts.gov/data-news/judiciary-news/2026/02/04/bankruptcy-filings-rise-11-percent
U.S. Courts — Bankruptcy Basics
Reference for bankruptcy chapters and federal bankruptcy terminology. It does not replace the numeric sources used in the ranking.
https://www.uscourts.gov/court-programs/bankruptcy/bankruptcy-basics
