
Top 100 Countries by Renewable Power Capacity per
Renewable power capacity per person changes the ranking lens Installed renewable power per person highlights a different side of the
Explore comprehensive macroeconomic data on StatRanker.org. Analyze global trends in GDP, inflation, unemployment, fiscal policies, and monetary systems. Gain insights into how large-scale economic factors shape national and international economies.
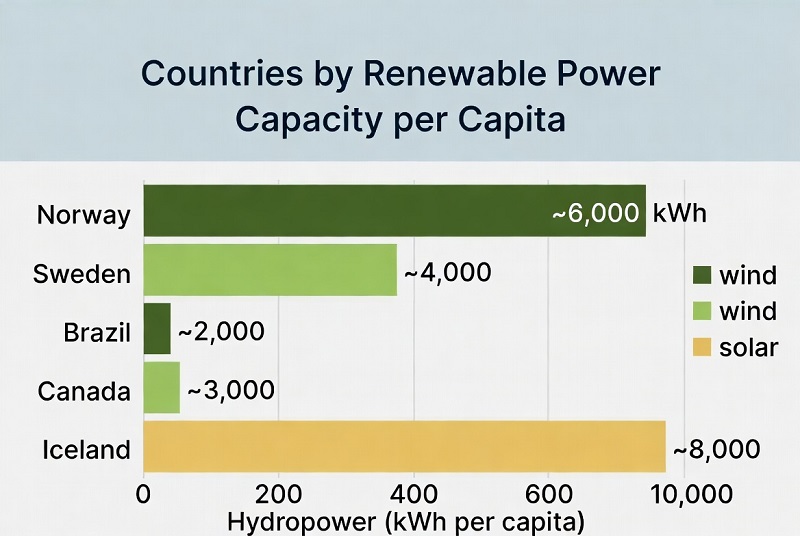
Renewable power capacity per person changes the ranking lens Installed renewable power per person highlights a different side of the
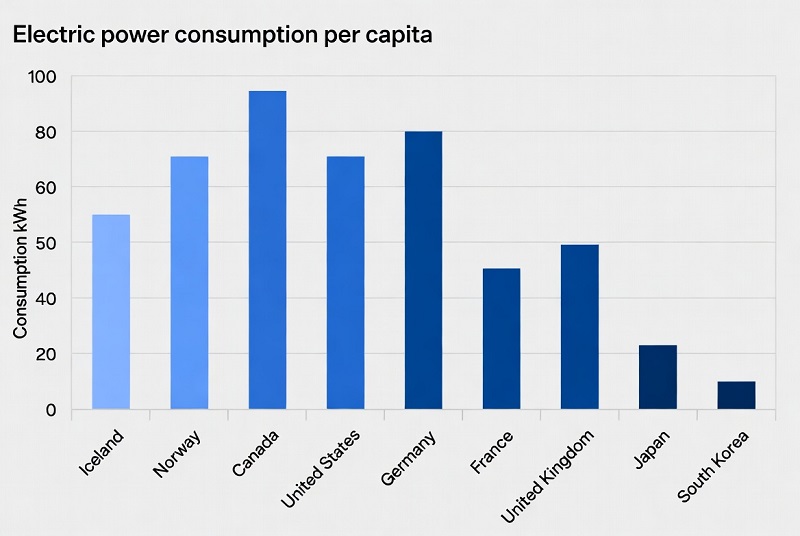
Energy · Utilities · Infrastructure What electric power consumption per capita shows in the latest World Bank / IEA comparison

Geopolitics · Defense budgets · SIPRI How military expenditure as a share of GDP shows defense burden in 2025 Military
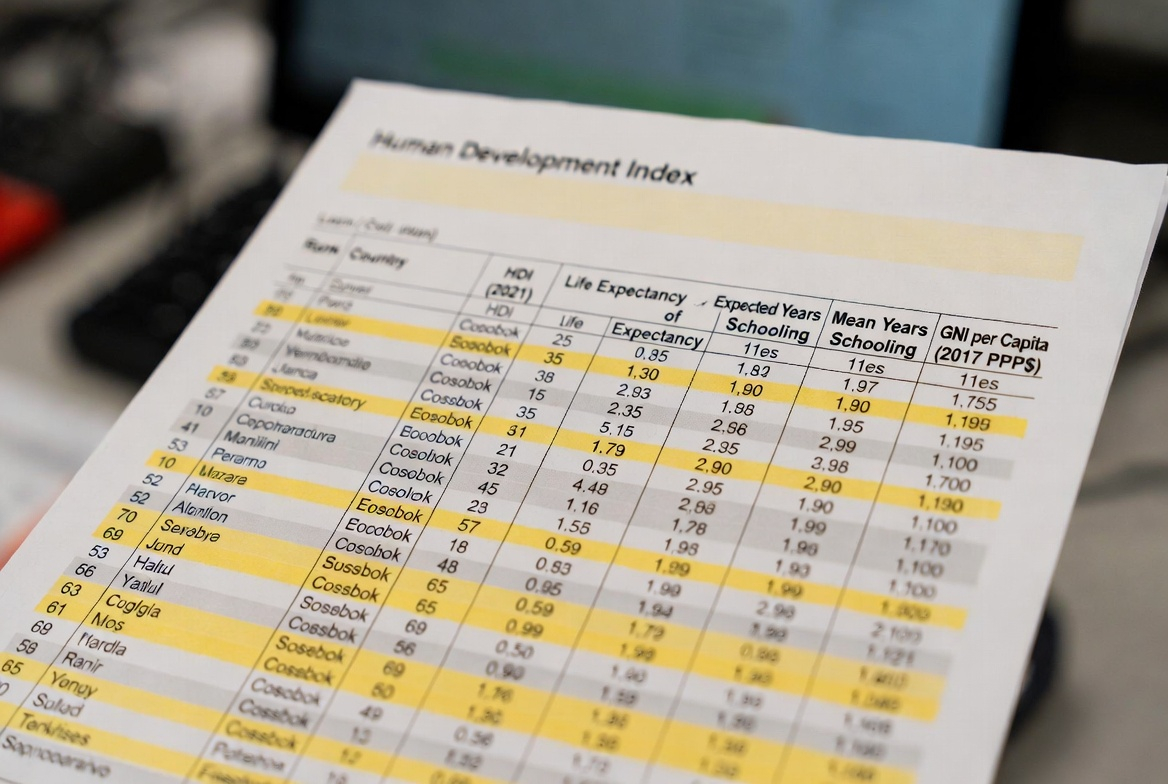
Society · Development · Composite index Human Development Index (HDI): a composite ranking of health, education, and living standards The
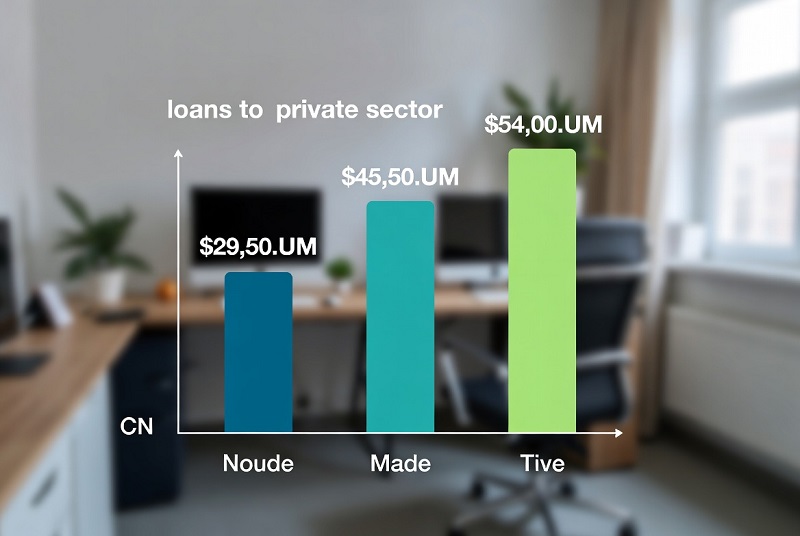
Private credit depth (bank lending to the private sector) This benchmark tracks how large bank credit to households and non-financial

Metric: Interest payments (% of revenue) Snapshot: latest available year (often 2022–2024) Coverage: government reporting varies by country When interest

What this ranking measures Inflation volatility is a practical way to describe how unpredictable price growth is. Instead of focusing
External sector · Balance of payments Countries by current account balance (% of GDP) — 2025 snapshot (latest full-year data
Economy · Macroeconomics · Growth Real GDP growth (annual %) measures how fast an economy expands in inflation-adjusted terms. This

StatRanker Labour Markets Ages 15–24 Youth unemployment is one of the fastest-moving stress indicators in any economy. When companies slow

StatRanker • Country rankings This page ranks countries by unemployment rate (share of the labour force without work, available for

2025 snapshot • inflation-adjusted rates Real interest rates by country: what this ranking is (and what it is not) “Real

Dec 2025 snapshot A central bank policy rate (also called a benchmark, key, or monetary policy rate) is the interest

Youth NEET 2025 Countries with the lowest NEET rates When we talk about youth not in employment, education or training

Remittances 2025 Top 10 by inflows per capita Remittances are cross-border money transfers that migrants send to households and relatives

Indicator snapshot Comparing countries by total online sales is distorted by population size. A more comparable intensity metric is annual
Economy · Macroeconomics · Living standards GDP per capita (PPP) is one of the cleanest ways to compare average material

Technology · Semiconductors · 2025 snapshot How to read the 2025 microchip cycle without confusing revenue with manufacturing depth “Microchip

Economy · Macroeconomics · Purchasing power parity GDP (PPP) in 2025: the clearest way to compare real economic scale across

In 2025, economic diversification remains a critical strategy for countries seeking to reduce reliance on raw materials and foster sustainable

The Role of ESG Factors in G20 Macroeconomic Forecasts In 2025, Environmental, Social, and Governance (ESG) factors have emerged as

In 2025, global supply chains remain a cornerstone of macroeconomic stability, influencing economic growth, inflation, and trade balances worldwide. The

In 2025, Central Bank Digital Currencies (CBDCs) are reshaping the global financial landscape, prompting intense debate about their macroeconomic implications.

This article provides a detailed comparative analysis of macroeconomic indicators between developed and developing countries, focusing on 2025 projections and
Economic cycles, characterized by alternating periods of growth (expansions) and decline (recessions), have a profound impact on the labor market,

The past decade (2015–2024) has been a defining period for the global economy, marked by periods of robust growth, unprecedented
